

According to the advanced slicing function of gear modeling along the tooth width direction, the gear is sliced during gear modeling, as shown in Figure 1. The tooth width parameter of the simulation gear is selected as 36mm, and N = 36 is set during the modeling. The gear is sliced with equal spacing along the tooth width to make the pre-set feature for the response characteristics of gear meshing force in the later stage.
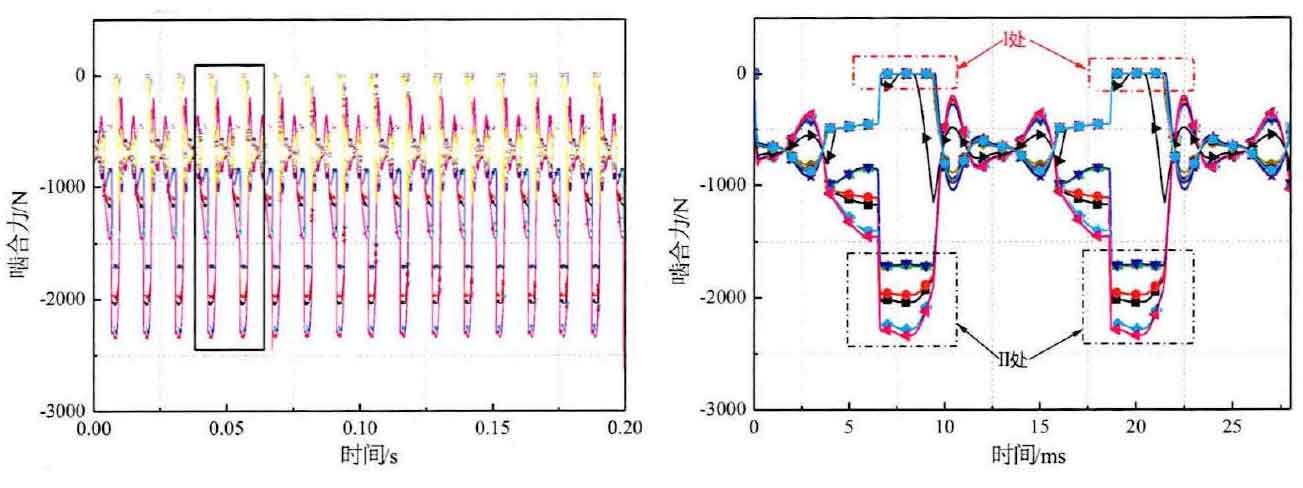
Due to the meshing continuity between gear teeth without pitting, the meshing force has continuous and stable change, which will not be described here. Fig. 2 draws the gear meshing force response curve with pitting features. From Fig. 2 (a), it can be seen that the gear meshing force also presents periodic changes, and each curve represents the meshing force in a sliced region after slicing. It can be seen that the meshing force in each sliced region is different due to the effect of pitting features. Select the meshing force curve in two meshing cycles for local magnification display to study the change of meshing force, as shown in Fig. 2 (b). The change of meshing force curve in the figure shows that the meshing force decreases to 0 in the pitting feature area along the tooth profile direction, as marked at I in the figure, and increases to a larger value in the non pitting area along the same tooth width direction, as marked at II in the figure. The change effect of meshing force shows that the sudden unbalanced response of meshing force is caused in the pitting feature area. At the same time, when there is no pitting along the direction of tooth profile and in the reverse direction of tooth width, the amplitude of meshing force shows a small change, which is less obvious than that in the pitting area.

In order to better interpret the change effect of the gear meshing force curve in Fig. 2 (b), Fig. 3 draws the motion change diagram of the meshing force in each slice region of the gear at different times, and uses the length change of the load line to characterize the change effect of the meshing force. Among them, 0.4941s, 0.4955s and 0.4967s are used to draw the change diagrams of the meshing force in the double meshing area, while 0.4939s, 0.4935 and 0.4933 are used to draw the change diagrams of the meshing force in the single meshing area. It can be clearly seen from the figure that the existence of pitting corrosion causes uneven changes in the radial and circumferential components of the meshing force in both double meshing and single meshing regions. The shorter the load line is, the smaller the meshing force is, while the longer the load line is, the greater the meshing force is. The above diagram of meshing force change can clearly show that the pitting corrosion can cause uneven load on the meshing line along the tooth width direction. If the local contact stress exceeds the limit contact stress of the gear material, the rapid fatigue phenomenon of the tooth surface will occur under the cyclic action.