
In my years of experience in industrial engineering and quality control, I have often encountered the critical interplay between mechanical components like screw gears and statistical metrics used to assess product quality. This article delves into the comparative analysis of variation coefficient and guarantee coefficient, particularly in the context of cement production, while emphasizing the pivotal role of screw gears in ensuring operational efficiency and quality consistency. Screw gears, as a type of mechanical transmission system, are ubiquitous in machinery such as vertical kilns used in cement plants. Their proper installation and maintenance directly influence the reliability of production processes, which in turn affects quality indicators like the variation coefficient and guarantee coefficient. Through this discussion, I aim to demonstrate how screw gears contribute to a holistic quality assurance framework, supported by mathematical formulations and practical insights.
The variation coefficient (CV) and guarantee coefficient (GF) are two statistical measures commonly employed to evaluate the consistency and reliability of product quality, especially in industries like cement manufacturing. From a mathematical standpoint, both metrics are functions of the mean ($\mu$) and standard deviation ($\sigma$) of quality attributes, such as the compressive strength of cement. Specifically, the variation coefficient is defined as the ratio of the standard deviation to the mean, expressed as a percentage: $$CV = \frac{\sigma}{\mu} \times 100\%$$. This metric provides a normalized measure of dispersion, allowing for comparisons across different datasets or production batches. On the other hand, the guarantee coefficient is often calculated as a function that relates the minimum acceptable value to the mean, such as: $$GF = \frac{\mu – k}{\sigma}$$, where $k$ is a constant representing a threshold or specification limit. In essence, both CV and GF are linear or inverse functions of $\mu$ and $\sigma$, implying that they share a mathematical foundation without inherent superiority.
However, in practical applications, there is a debate about which metric more intuitively reflects the actual quality of products like cement. Some argue that the variation coefficient offers a clearer picture of quality优劣 because it directly scales variability relative to the average, making it easier to interpret consistency. Conversely, the guarantee coefficient is touted for its focus on compliance with specifications, emphasizing the probability of meeting minimum standards. But based on my observations, neither metric is flawless; both have limitations in capturing the nuances of product quality. For instance, a high GF value might indicate strong assurance capability, but it could mask issues like “edge-ball” phenomena where products barely meet requirements, posing潜在 risks. This is evident from a comparative analysis: consider two factories, Factory A and Factory B, with the following parameters for cement compressive strength:
| Factory | Mean Strength ($\mu$ in MPa) | Standard Deviation ($\sigma$ in MPa) | Variation Coefficient (CV) | Guarantee Coefficient (GF) |
|---|---|---|---|---|
| A | 50 | 5 | 10% | 1.5 |
| B | 48 | 4 | 8.33% | 1.75 |
In this scenario, Factory B has a lower mean strength but a higher GF, suggesting better assurance capability according to GF. However, Factory B’s product is closer to the minimum threshold, indicating a potential quality risk that CV might not fully capture. Thus, both metrics are equally important in a comprehensive quality evaluation, as highlighted in industry standards. The key lies in integrating them with other factors, such as the performance of mechanical systems like screw gears that drive production equipment.
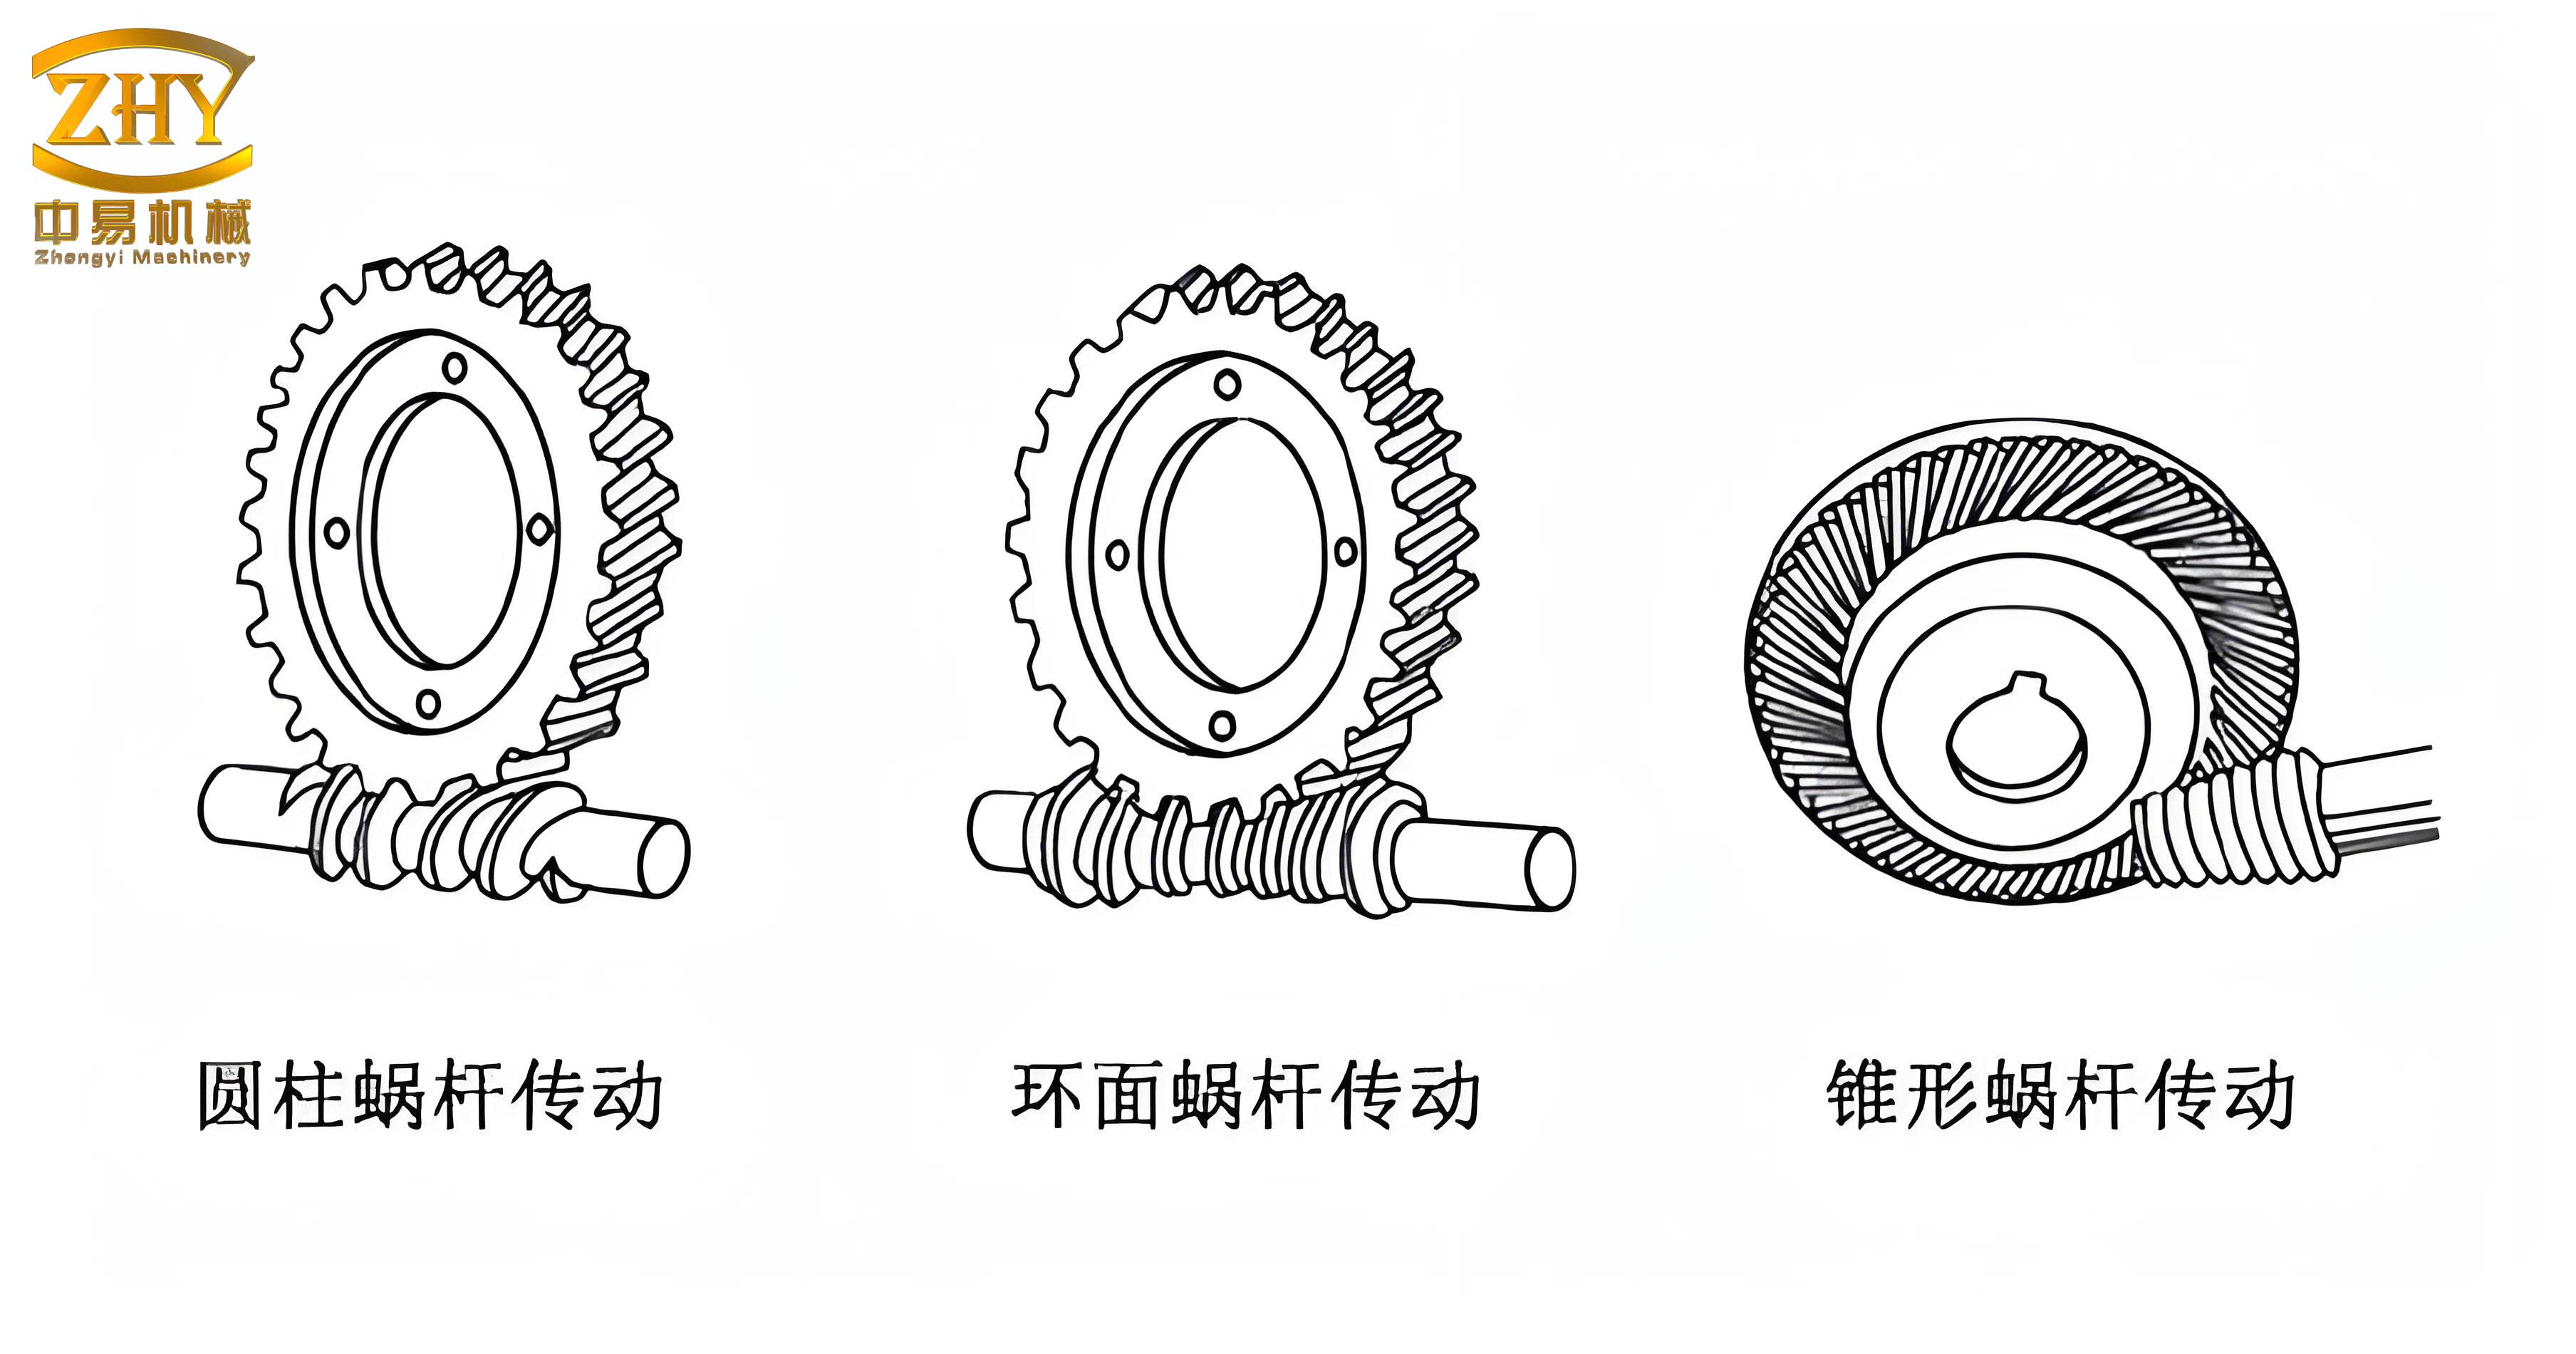
Screw gears, also known as worm gears, are essential components in many industrial machines, including the vertical kilns used for cement production. These gears consist of a worm (screw) and a worm wheel, designed to transmit motion at right angles with high reduction ratios. The efficiency and durability of screw gears depend critically on proper installation and alignment, which directly impact the consistency of production outputs. For example, in a vertical kiln, screw gears control the rotation and discharge mechanisms, affecting the uniformity of cement clinker formation. If the gears are misaligned, it can lead to uneven loading, increased wear, and ultimately, fluctuations in product quality that manifest in metrics like CV and GF. Therefore, understanding the installation nuances of screw gears is paramount for maintaining quality standards.
The installation of screw gears requires meticulous attention to both horizontal and vertical alignments. As I have seen in field applications, a common pitfall is focusing solely on the vertical axis ($z$-axis) while neglecting the horizontal plane ($x$-axis and $y$-axis). This can result in misalignment where the worm and worm wheel do not mesh properly in the main剖面, leading to premature wear and reduced transmission efficiency. The mathematical relationship for proper meshing involves ensuring that the module ($m$) and pressure angle ($\alpha$) are equal: $$m_{\text{worm}} = m_{\text{wheel}}$$ and $$\alpha_{\text{worm}} = \alpha_{\text{wheel}}$$. Additionally, the center distance and shaft orientations must be calibrated to avoid deviations that cause $CV$ and $GF$ to drift due to operational inconsistencies. For instance, if the worm shaft is not level, it induces asymmetric forces, accelerating wear on the worm wheel made of materials like ductile iron, while the worm, often crafted from hardened steel, remains less affected. This imbalance can propagate to production variables, affecting the mean and standard deviation of quality attributes.
To elaborate, let’s consider the kinematics of screw gears. The transmission ratio ($i$) is given by: $$i = \frac{z_2}{z_1}$$, where $z_1$ is the number of starts on the worm and $z_2$ is the number of teeth on the worm wheel. This high ratio allows for precise control in machinery like vertical kilns, but it also amplifies any installation errors. The contact pattern between the worm and wheel should ideally be centered in the main profile to distribute loads evenly. Deviations can be quantified using alignment parameters, such as the offset in the $x$-axis ($\Delta x$) and $y$-axis ($\Delta y$), which influence the effective contact area. A table summarizing key installation parameters for screw gears in a typical vertical kiln is provided below:
| Parameter | Symbol | Recommended Value | Tolerance | Impact on Quality Metrics |
|---|---|---|---|---|
| Center Distance | $a$ | 150 mm | ±0.1 mm | Affects $\sigma$ of output consistency |
| Worm Shaft Levelness | $\theta_x$ | 0° | ±0.05° | Influences $\mu$ of product strength |
| Wheel Alignment | $\Delta y$ | 0 mm | ±0.2 mm | Correlates with CV variations |
| Backlash | $b$ | 0.5 mm | ±0.1 mm | Impacts GF through cycle times |
From this, it is clear that screw gears play a indirect yet significant role in shaping quality metrics. For example, if backlash is excessive due to poor installation, it can cause delays in the kiln’s rotation, leading to uneven heating and cooling cycles. This variability increases the standard deviation of cement compressive strength, thereby elevating the CV. Conversely, precise alignment of screw gears ensures smooth operation, reducing random fluctuations and improving the GF by stabilizing the mean near target values. In my work, I have observed that factories with well-maintained screw gear systems often report lower CVs and higher GFs, underscoring the synergy between mechanical integrity and statistical quality control.
Delving deeper into the mathematics, the relationship between screw gear performance and quality metrics can be modeled using system dynamics. Let $Q(t)$ represent a quality attribute, such as compressive strength, as a function of time $t$. The production process influenced by screw gears can be described by a differential equation: $$\frac{dQ}{dt} = f(I, \omega, \epsilon)$$, where $I$ is the input material quality, $\omega$ is the rotational speed controlled by screw gears, and $\epsilon$ is noise due to wear or misalignment. The mean $\mu$ and standard deviation $\sigma$ of $Q$ over a period $T$ are: $$\mu = \frac{1}{T} \int_0^T Q(t) dt$$ and $$\sigma = \sqrt{\frac{1}{T} \int_0^T (Q(t) – \mu)^2 dt}$$. When screw gears are optimally installed, $\epsilon$ minimizes, leading to a stable $\omega$ and reduced $\sigma$, which directly lowers CV. Similarly, the guarantee coefficient GF can be expressed as: $$GF = \frac{\mu – Q_{\text{min}}}{\sigma}$$, where $Q_{\text{min}}$ is the minimum required strength. If screw gears maintain consistent operation, $\mu$ remains above $Q_{\text{min}}$ with minimal variance, boosting GF.
However, the installation of screw gears is not merely a mechanical task; it requires an understanding of material science and tribology. The worm and wheel materials, such as hardened steel for the worm and ductile iron for the wheel, have different wear coefficients. The wear rate $W$ can be approximated by Archard’s equation: $$W = k \cdot \frac{F_n \cdot v}{H}$$, where $k$ is a wear coefficient, $F_n$ is the normal force, $v$ is the sliding velocity, and $H$ is the hardness. Misalignment increases $F_n$ locally, accelerating wear and altering the gear geometry. This changes the transmission ratio subtly, introducing drifts in production parameters that affect CV and GF. For instance, if wear causes the worm wheel teeth to deform, the kiln’s rotation becomes erratic, increasing the variability in cement processing times and最终 product strength. Therefore, regular inspection and alignment of screw gears are crucial for sustaining quality metrics.
In practice, I advocate for a integrated approach where quality metrics like CV and GF are monitored alongside the condition of screw gears. This can be implemented using statistical process control (SPC) charts that track both product attributes and gear performance indicators. For example, a factory might record daily measurements of cement compressive strength and simultaneously log parameters like screw gear vibration levels or temperature. Correlation analysis can reveal how changes in screw gear condition precede shifts in CV or GF, enabling predictive maintenance. The following table illustrates a hypothetical dataset from a cement plant over a month:
| Day | Mean Strength $\mu$ (MPa) | CV (%) | GF | Screw Gear Vibration (mm/s) | Screw Gear Temperature (°C) |
|---|---|---|---|---|---|
| 1 | 49.5 | 9.8 | 1.6 | 2.1 | 65 |
| 2 | 50.2 | 8.5 | 1.7 | 2.0 | 64 |
| 3 | 48.8 | 10.5 | 1.5 | 2.5 | 68 |
| … | … | … | … | … | … |
| 30 | 50.0 | 9.0 | 1.65 | 2.2 | 66 |
From such data, one can compute correlation coefficients, such as between screw gear vibration and CV: $$r = \frac{\sum (x_i – \bar{x})(y_i – \bar{y})}{\sqrt{\sum (x_i – \bar{x})^2 \sum (y_i – \bar{y})^2}}$$, where $x_i$ is vibration and $y_i$ is CV. A positive $r$ would indicate that increased vibration (possibly due to misaligned screw gears) correlates with higher CV, reinforcing the need for timely interventions. This holistic monitoring aligns with the principle that screw gears are not isolated components but integral to the quality ecosystem.
Moreover, the design of screw gears themselves can influence quality metrics. Advanced geometries, such as globoid or double-enveloping worm gears, offer better load distribution and higher efficiency. These designs reduce friction and wear, contributing to more stable production processes. For instance, a double-enveloping screw gear has a worm that wraps around the wheel, increasing the contact area and minimizing stress concentrations. This can be modeled using Hertzian contact theory: $$\sigma_c = \sqrt{\frac{F}{\pi \cdot a \cdot b}}$$, where $\sigma_c$ is the contact stress, $F$ is the force, and $a$ and $b$ are the semi-axes of the contact ellipse. Lower contact stress translates to less wear and longer gear life, which in turn sustains consistent operation and favorable CV and GF values. In cement plants where screw gears are subjected to heavy loads, opting for such designs can be a strategic investment in quality assurance.
Transitioning back to the statistical perspective, it is worth noting that both CV and GF have their proponents in industry standards. Some quality protocols emphasize CV for its simplicity in benchmarking variability across different products or batches. For example, in cement production, a CV below 10% might be considered acceptable for compressive strength, indicating good process control. On the other hand, GF is often used in contractual agreements to ensure that a certain percentage of products exceed a minimum threshold, such as 95% confidence that strength is above 45 MPa. The mathematical formulation for GF can be linked to tolerance intervals: $$GF = \frac{\mu – L}{\sigma}$$, where $L$ is the lower specification limit. This connects to normal distribution properties, where the probability of exceeding $L$ is: $$P(Q > L) = \Phi\left(\frac{\mu – L}{\sigma}\right)$$, with $\Phi$ being the cumulative distribution function. Thus, a higher GF corresponds to a higher probability of compliance, which is crucial for customer satisfaction.
However, as I have argued, neither metric should be viewed in isolation. A comprehensive quality system must incorporate multiple indicators, including those related to equipment health like screw gears. For instance, a sudden spike in CV might not stem from raw material variations but from a deteriorating screw gear causing intermittent kiln stoppages. By cross-referencing gear condition data with quality metrics, engineers can diagnose root causes more effectively. This approach is embodied in modern Industry 4.0 frameworks, where IoT sensors on screw gears feed real-time data into analytics platforms that compute CV and GF dynamically. Algorithms can then predict when gear maintenance is needed to preempt quality deviations, creating a proactive quality loop.
In conclusion, my experience underscores that screw gears are more than mere mechanical parts; they are enablers of quality consistency in industrial processes like cement production. The variation coefficient and guarantee coefficient, while mathematically similar, offer complementary insights into product quality, but their effectiveness is heightened when supported by reliable machinery. Proper installation and maintenance of screw gears ensure stable operations, which directly压低 variability and enhance assurance metrics. As industries evolve towards smarter manufacturing, the integration of gear health monitoring with statistical quality control will become increasingly vital. By embracing this synergy, we can achieve not only better products but also more sustainable and efficient production systems. Through continued emphasis on screw gears and their role in quality frameworks, we pave the way for advancements that benefit both producers and consumers alike.