
In modern industrial applications, screw gears, commonly referred to as worm gears, play a critical role in power transmission systems due to their high reduction ratios and torque capabilities. These gears are integral components in machinery such as conveyors, lifts, and heavy-duty equipment, where reliable operation is paramount. However, screw gears are prone to various faults, with tooth profile changes being a significant failure mode that can lead to catastrophic breakdowns, unplanned downtime, and substantial economic losses. Early detection of such faults is essential for predictive maintenance and operational efficiency. In this study, we explore a vibration-based diagnostic approach combining Empirical Mode Decomposition (EMD) and Hilbert Transform to extract fault characteristics from screw gears experiencing tooth profile changes. Our methodology focuses on non-stationary signal processing to identify modulation features indicative of faults, validated through experimental testing and comparative analysis with precision measurement instruments.
The importance of screw gears in industrial systems cannot be overstated. Their ability to provide large speed reductions in compact designs makes them ideal for space-constrained applications. However, the sliding contact between the worm and gear teeth in screw gears often leads to wear and deformation, particularly in harsh environments. Tooth profile changes, which involve deviations from the ideal gear tooth geometry, can arise from manufacturing errors, improper installation, or operational stresses. These changes alter the meshing dynamics, generating unique vibration signatures that, if detected early, can prevent failures. Traditional diagnostic methods, such as visual inspection or periodic maintenance, are often inadequate due to their invasive nature or inability to capture real-time data. Thus, advanced signal processing techniques are required to monitor screw gears continuously and non-invasively.
Vibration analysis has emerged as a powerful tool for gear fault diagnosis, as it captures dynamic responses from rotating machinery. For screw gears, vibration signals are rich in information about meshing interactions, but they are typically non-stationary and noisy, making feature extraction challenging. Common methods like Fast Fourier Transform (FFT) may fail to resolve time-frequency details, while wavelet analysis, though effective, requires careful selection of basis functions. In contrast, EMD adaptively decomposes signals into Intrinsic Mode Functions (IMFs), each representing oscillatory modes at different frequency bands. This data-driven approach is well-suited for non-stationary signals, such as those from faulty screw gears. Subsequently, the Hilbert Transform can be applied to specific IMFs to obtain envelope spectra, revealing modulation frequencies associated with faults. This combined EMD-Hilbert method leverages the strengths of both techniques for enhanced diagnostic accuracy.
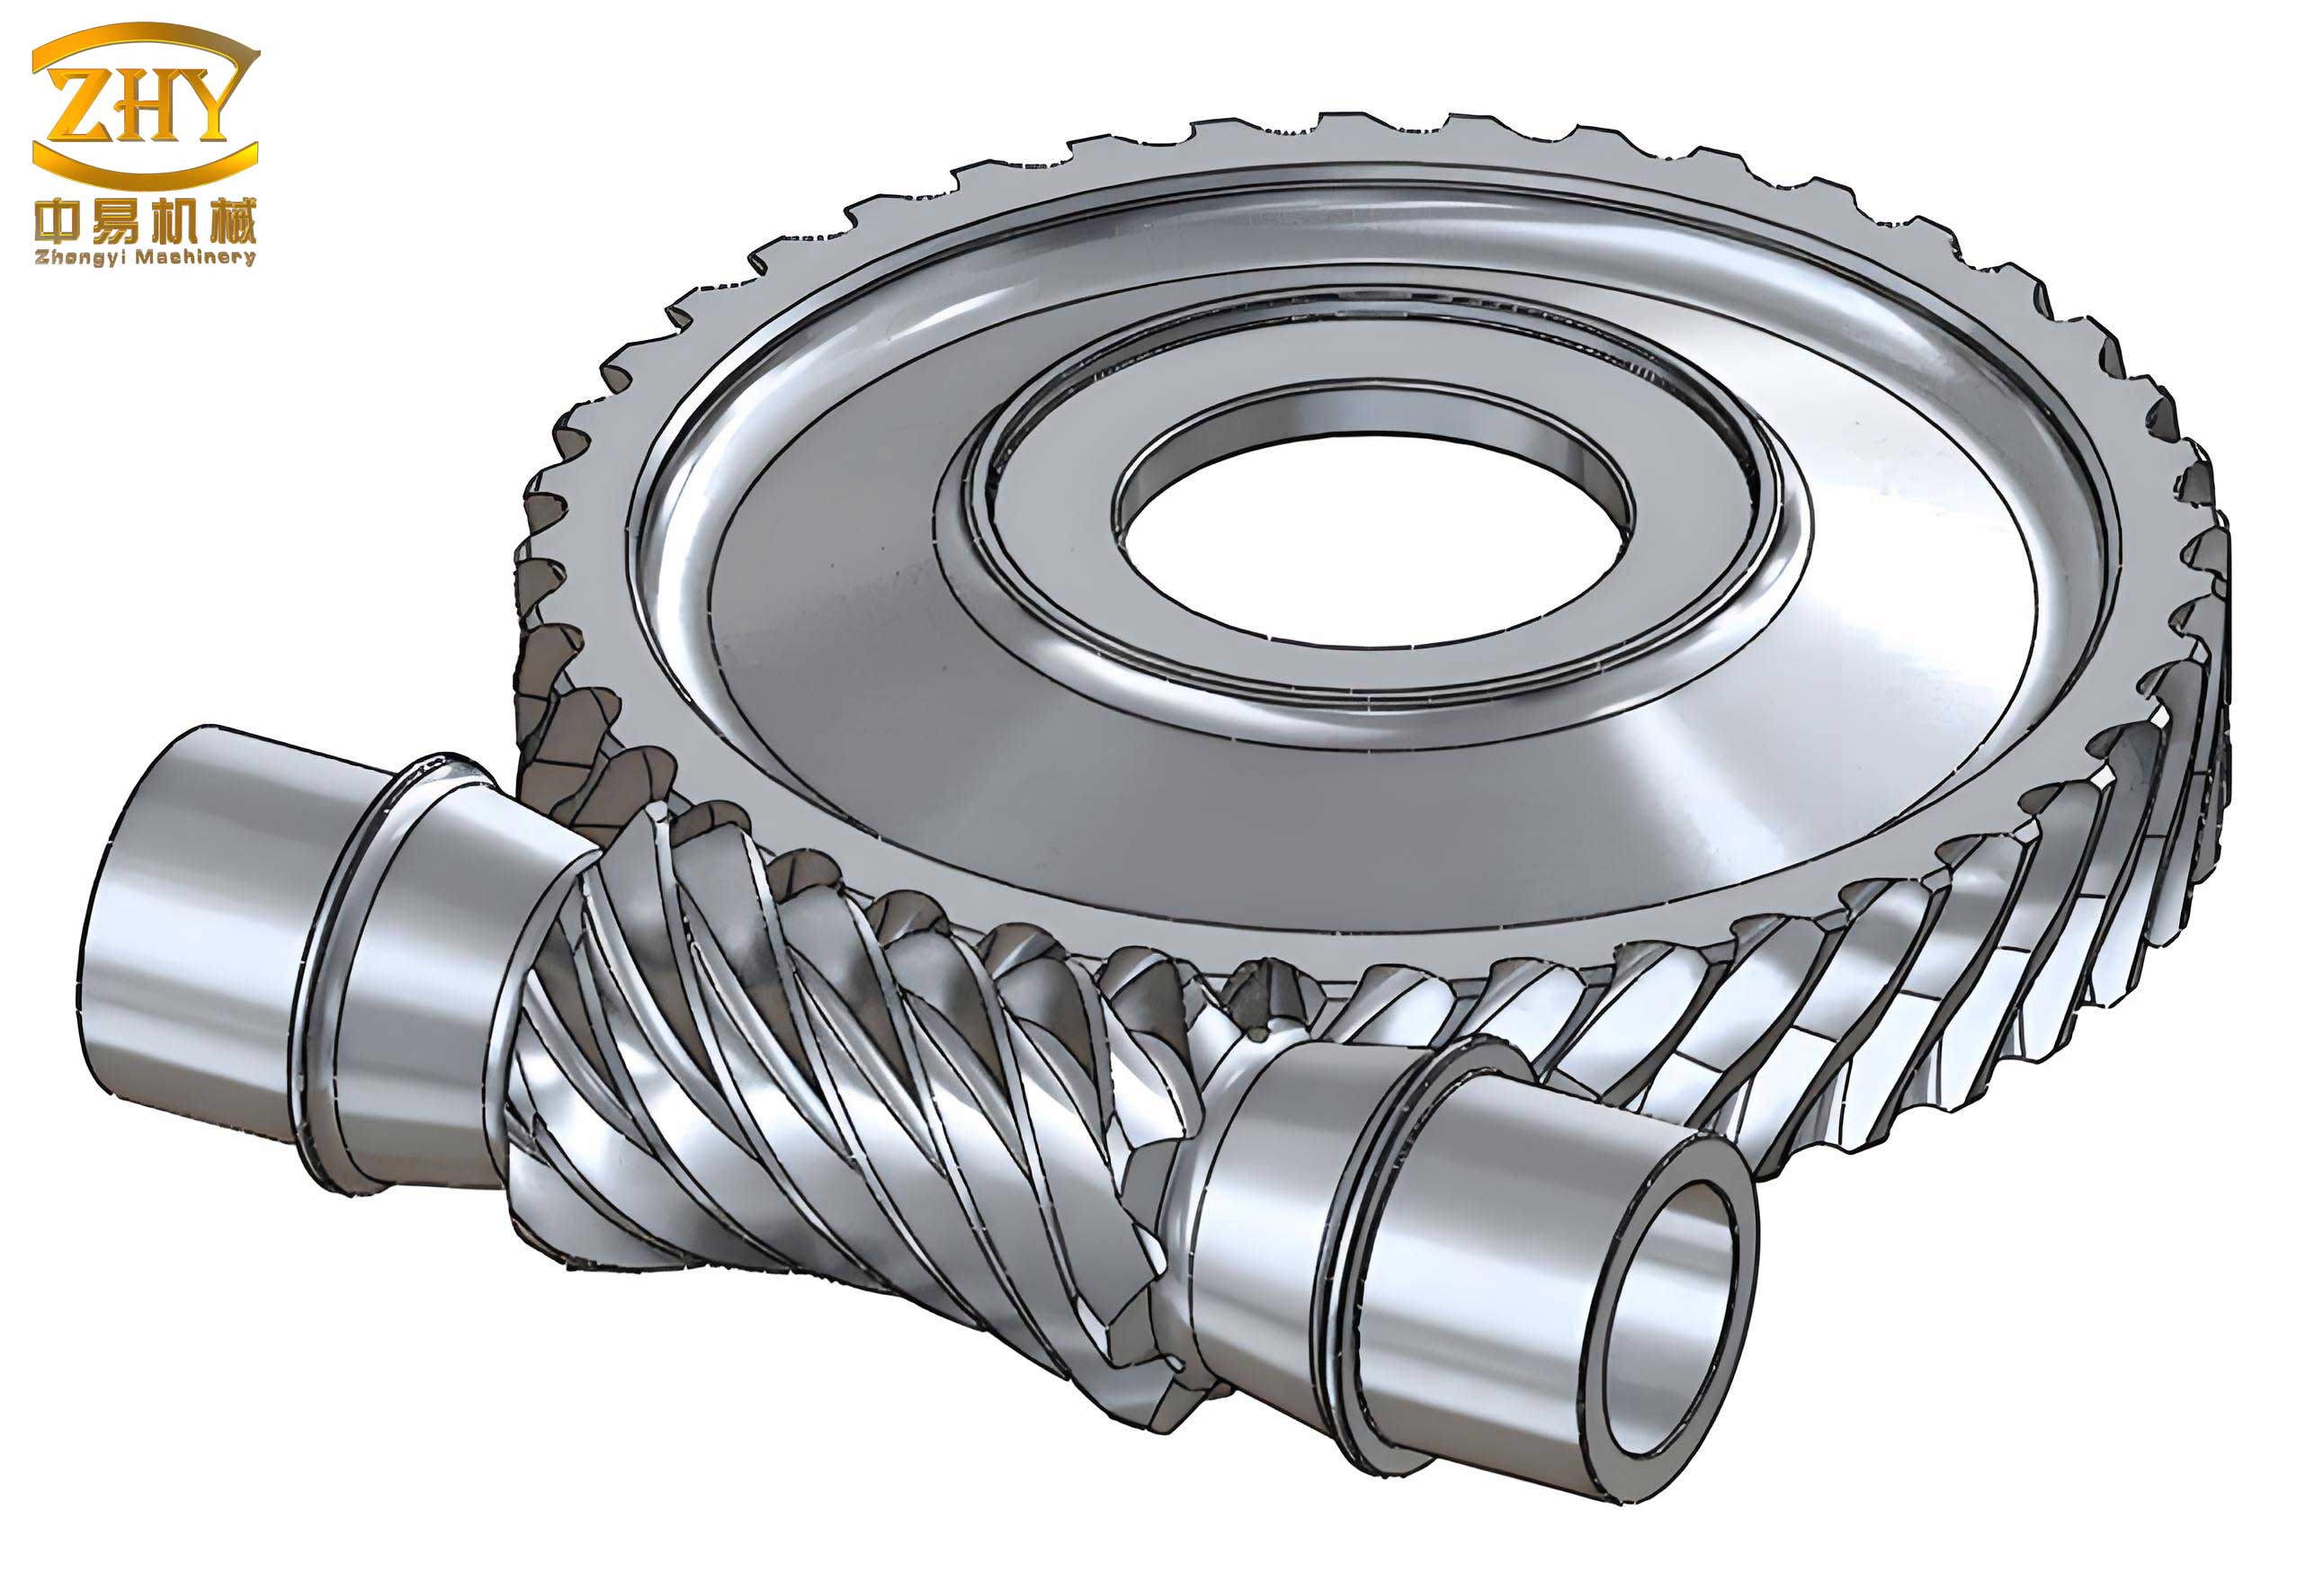
To understand the fault characteristics of screw gears, consider the dynamics of tooth profile changes. In a healthy screw gear system, vibration signals are dominated by the meshing frequency and its harmonics, with minimal modulation. When tooth profile changes occur, the meshing process becomes irregular, leading to amplitude and frequency modulation. Specifically, the meshing frequency acts as a carrier wave, modulated by the rotational frequency of the gear shaft. This results in sidebands around the meshing frequency in the spectrum, with the modulation frequency equal to the gear shaft rotational frequency. The severity of the fault influences the number and amplitude of these sidebands; minor changes produce few, low-amplitude sidebands, while severe changes can excite natural frequencies of the screw gear, causing resonance modulation. Mathematically, if $x(t)$ represents the vibration signal, the modulated component due to tooth profile changes can be expressed as:
$$x(t) = A[1 + m \cos(2\pi f_m t)] \cos(2\pi f_c t + \phi)$$
where $A$ is the amplitude, $m$ is the modulation index, $f_m$ is the modulation frequency (gear shaft rotational frequency), $f_c$ is the carrier frequency (meshing frequency), and $\phi$ is the phase. For screw gears, the meshing frequency $f_c$ is calculated based on the worm rotational speed and the number of gear teeth. If $N_w$ is the worm rotational speed in revolutions per minute (RPM) and $Z_g$ is the number of gear teeth, the meshing frequency in Hertz is:
$$f_c = \frac{N_w \times Z_g}{60}$$
Similarly, the gear shaft rotational frequency $f_m$ is derived from the output speed. In our experimental setup, with a worm input speed of 1440 RPM and a gear with 3 teeth (typical for screw gears), the theoretical meshing frequency is $f_c = 72 \text{ Hz}$, and the gear shaft rotational frequency is $f_m = 2.4 \text{ Hz}$. Detecting these frequencies in vibration signals requires precise signal processing, as noise and other components can obscure them.
The Empirical Mode Decomposition (EMD) method is a key component of our diagnostic approach. EMD is an adaptive time-frequency analysis technique that decomposes a signal into a set of IMFs without requiring pre-defined basis functions. Each IMF must satisfy two conditions: (1) the number of extrema and zero-crossings must differ by at most one, and (2) the mean of the upper and lower envelopes defined by local maxima and minima is zero. The decomposition process iteratively sifts the signal to extract IMFs, starting from the highest frequency components. Given a vibration signal $s(t)$, the EMD algorithm proceeds as follows:
- Identify all local maxima and minima of $s(t)$.
- Interpolate the upper envelope $e_{\text{max}}(t)$ and lower envelope $e_{\text{min}}(t)$ using cubic splines.
- Compute the mean envelope $m_1(t) = \frac{e_{\text{max}}(t) + e_{\text{min}}(t)}{2}$.
- Obtain the first candidate IMF: $h_1(t) = s(t) – m_1(t)$.
- Check if $h_1(t)$ meets the IMF criteria. If not, repeat steps 1-4 with $h_1(t)$ as the new signal until an IMF is obtained, denoted as $c_1(t)$.
- Calculate the residue $r_1(t) = s(t) – c_1(t)$.
- Repeat the process on $r_1(t)$ to extract subsequent IMFs $c_2(t), c_3(t), \dots, c_n(t)$ until the residue becomes monotonic or has negligible energy.
The final decomposition is represented as:
$$s(t) = \sum_{i=1}^{n} c_i(t) + r_n(t)$$
where $c_i(t)$ are the IMFs and $r_n(t)$ is the residue. For screw gear vibration signals, EMD effectively separates noise, high-frequency transients, and low-frequency trends, allowing focused analysis on specific IMFs related to fault features. The selection of relevant IMFs is crucial; typically, IMFs corresponding to the meshing frequency range are analyzed for gear faults. In our study, we found that the third IMF often contains significant information about tooth profile changes in screw gears.
Following EMD, the Hilbert Transform is applied to selected IMFs for envelope analysis. The Hilbert Transform of a signal $x(t)$ is defined as:
$$\hat{x}(t) = \frac{1}{\pi} \text{P.V.} \int_{-\infty}^{\infty} \frac{x(\tau)}{t – \tau} d\tau$$
where P.V. denotes the Cauchy principal value. In discrete form for a signal $x[n]$, the Hilbert Transform can be implemented using a finite impulse response (FIR) filter with impulse response $h[n]$ given by:
$$h[n] = \begin{cases}
0 & \text{for even } n \\
\frac{2}{n\pi} & \text{for odd } n
\end{cases}$$
The analytic signal $z[n]$ is then constructed as:
$$z[n] = x[n] + j \hat{x}[n]$$
where $j = \sqrt{-1}$. The envelope of $x[n]$ is the magnitude of the analytic signal:
$$e[n] = |z[n]| = \sqrt{x^2[n] + \hat{x}^2[n]}$$
By computing the Fourier transform of the envelope $e[n]$, we obtain the envelope spectrum, which highlights modulation frequencies. For screw gears with tooth profile changes, the envelope spectrum should exhibit peaks at the gear shaft rotational frequency $f_m$ and its harmonics, confirming fault presence. This combination of EMD and Hilbert Transform enhances fault detection by isolating relevant signal components and demodulating them to reveal characteristic frequencies.
To validate our method, we designed an experimental vibration test system for screw gears. The setup included a motor, torque sensors, a screw gear reducer (the test subject), a magnetic powder brake as a load, and a data acquisition system. Two identical screw gear reducers were tested: one with induced tooth profile changes (faulty) and one in normal condition (healthy). The reducers were manufactured with a reduction ratio of 20:1, typical for industrial screw gears. Key parameters of the screw gears are summarized in Table 1.
| Parameter | Value |
|---|---|
| Worm rotational speed (input) | 1440 RPM |
| Gear rotational speed (output) | 72 RPM |
| Number of gear teeth | 3 |
| Meshing frequency ($f_c$) | 72 Hz |
| Gear shaft rotational frequency ($f_m$) | 2.4 Hz |
| Reduction ratio | 20:1 |
| Material | Bronze gear, steel worm |
The vibration signals were acquired using a piezoelectric accelerometer mounted on the reducer housing near the gear shaft to maximize sensitivity. Data was sampled at 2731 Hz for 6 seconds, ensuring sufficient resolution for frequency analysis. Prior to data collection, the screw gears were run for 4 hours to achieve thermal stability and proper run-in, minimizing transient effects. The acquisition system stored time-domain signals for offline processing using MATLAB, where we implemented the EMD and Hilbert Transform algorithms.
Analysis of the vibration signals began with visual inspection of the raw data. As shown in Figure 1 (simulated representation), the raw signals from both healthy and faulty screw gears appeared noisy and complex, with no obvious fault indicators. This underscores the need for advanced processing. We applied EMD to decompose each signal into IMFs; typically, 8-10 IMFs were obtained, with the first few containing high-frequency noise and the latter ones representing low-frequency trends. For brevity, we focus on the first four IMFs, which captured most of the relevant dynamics. The decomposition process revealed that IMF3 consistently exhibited oscillations around the expected meshing frequency range for screw gears.
To quantify the energy distribution across IMFs, we computed the relative energy of each IMF as a percentage of the total signal energy. For a signal $s(t)$ with IMFs $c_i(t)$, the energy of the $i$-th IMF is $E_i = \int |c_i(t)|^2 dt$, and the total energy is $E_{\text{total}} = \sum E_i$. Table 2 presents the energy distribution for the faulty screw gear, indicating that IMF3 holds significant energy related to meshing vibrations.
| IMF Component | Energy (Relative %) |
|---|---|
| IMF1 | 15.2% |
| IMF2 | 22.7% |
| IMF3 | 30.5% |
| IMF4 | 18.1% |
| Residue | 13.5% |
We then applied the Hilbert Transform to IMF3 to compute the envelope spectrum. For the healthy screw gear, the envelope spectrum showed no distinct peaks at the gear shaft rotational frequency, confirming normal operation. In contrast, for the faulty screw gear, the envelope spectrum displayed a clear peak at $f = 2.34 \text{ Hz}$, closely matching the theoretical gear shaft rotational frequency of $2.4 \text{ Hz}$. Additionally, a zoomed-in view of the frequency spectrum around the meshing frequency revealed sidebands at $f_c \pm f_m$, i.e., at approximately $69.6 \text{ Hz}$ and $74.4 \text{ Hz}$, with low amplitudes. This pattern aligns with the expected modulation due to tooth profile changes in screw gears. The modulation index $m$ can be estimated from the sideband amplitudes relative to the carrier amplitude; for our data, $m$ was approximately 0.1, indicating a moderate fault severity.
To further validate our findings, we compared the vibration-based diagnosis with direct measurements using a gear measuring instrument. The screw gears were disassembled after testing, and tooth profile deviations were measured with a precision gear analyzer. The results, summarized in Table 3, show that the faulty screw gear had a maximum tooth profile deviation of 306.2 μm, far exceeding the tolerance of 39 μm for a Grade 9 gear (industrial standard). The healthy screw gear, however, exhibited deviations within tolerance. This correlation confirms that the EMD-Hilbert method accurately identifies tooth profile changes in screw gears based on vibration signals alone.
| Screw Gear Condition | Maximum Deviation (μm) | Tolerance (Grade 9) (μm) | Diagnosis from Vibration |
|---|---|---|---|
| Faulty | 306.2 | 39 | Tooth profile change detected |
| Healthy | 52.4 | 39 | No fault detected |
The effectiveness of the EMD-Hilbert method for screw gear fault diagnosis can be attributed to its adaptability to non-stationary signals. Unlike fixed-basis transforms, EMD tailors the decomposition to the signal’s inherent oscillations, making it ideal for the complex vibrations generated by screw gears. Moreover, the Hilbert Transform amplifies modulation effects, which are subtle in early fault stages. In industrial settings, this approach can be integrated into condition monitoring systems for real-time surveillance of screw gears, reducing maintenance costs and downtime. However, challenges remain, such as the computational intensity of EMD for long data streams and the need for automatic IMF selection. Future work could explore optimized EMD algorithms or machine learning techniques to enhance efficiency.
In conclusion, our study demonstrates that the combination of Empirical Mode Decomposition and Hilbert Transform provides a robust method for diagnosing tooth profile changes in screw gears. By decomposing vibration signals into intrinsic modes and analyzing envelope spectra, we successfully extracted fault characteristic frequencies that matched theoretical predictions and direct measurements. This non-invasive approach offers practical benefits for predictive maintenance in industries reliant on screw gear systems. As screw gears continue to be vital components in machinery, advancing diagnostic techniques will ensure their reliability and longevity. We recommend further research into automated fault classification and integration with IoT-based monitoring platforms for widespread application.