1 Experiment description
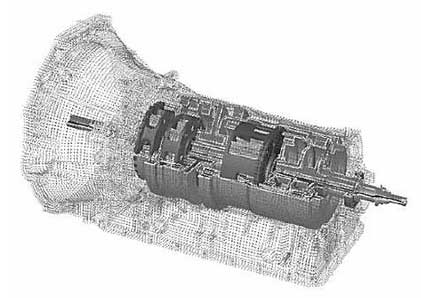
The main body of the experiment is the eight speed automatic transmission under development. The experiment is carried out in a semi anechoic chamber. A microphone is arranged 1m above the gearbox. The rotational speed signal extracts the rotational speed of the input shaft, i.e. the rotational speed of the ring gear. The input load is 100nm. The test system is bamp; K3560C. In the experiment, the subjective feeling is that there is obvious squealing noise in the gear using the first stage planetary row (the number of teeth is selected in accordance with scheme III).
2 Estimation of side frequency characteristics
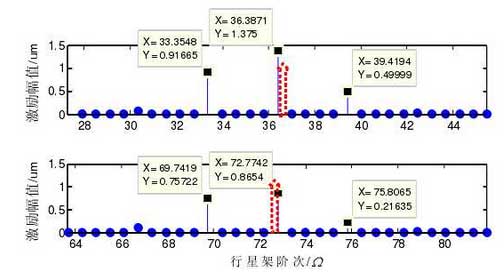
Firstly, the order distribution and side frequency characteristics of the first stage planetary row are predicted by using the model. Considering that the actual input is the ring gear and the sun wheel is fixed, at this time, the frequency order of planetary frame rotation is 94 / (94 61) 0.606 + =, 94 / (94 61) 0.606 C Ω = + =, the frequency order of engagement is 61 0.606 36.99m s C Ω = Z Ω = × =, M S C = Z Ω 61 0.606 36.99m s C Ω = Z Ω= × =, figure 1 shows the side frequency distribution near the first two harmonics of the engagement order. It can be seen that the lower side frequency (LSB = 36.99-0.606 = 36.384) of the first harmonic is excited, the main frequency and the upper side frequency (USB) are suppressed, and the other side frequency intervals are 5C Ω 5 Ω and asymmetric.
3 Comparison of experimental results
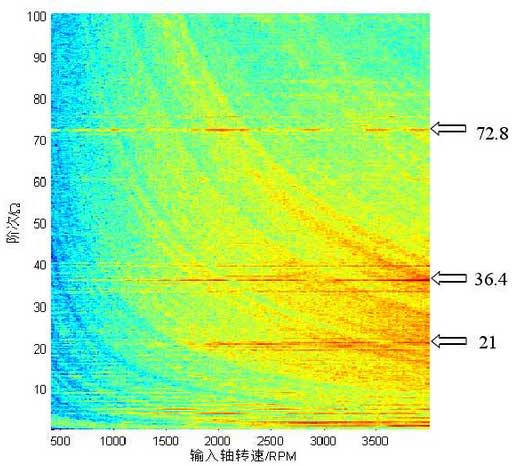
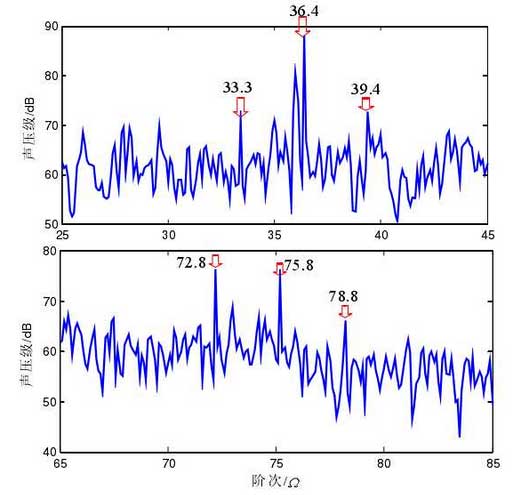
Using the order tracking analysis method, the sound pressure level waterfall diagram of the first stage planetary array is obtained, as shown in Figure 2. The main order 36.4 and 72.8 in Figure 2 are consistent with the side frequencies of the first and second harmonics simulated in Figure 1, while the order 21 is related to the pump noise, and the other includes the low-frequency noise related to the first and second-order shaft frequency. In order to observe the actual edge frequency distribution more carefully, the order diagram at 2500rpm is extracted, as shown in Figure 3.
In addition to the two main side frequencies 36.4 and 72.8, we can see the asymmetrical side frequency with the interval of C = 5500.6063.03c Ω = × = which is basically consistent with the distribution in Figure 1. It shows that the analysis model and side frequency estimation method are effective, and it is found that there is a direct relationship between the squeal noise and the excitation of side frequency. To reduce the noise, we should start from the suppression of side frequency.
4 Comparison of improvement schemes
In order to keep the side frequency as far away from the main meshing frequency as possible and suppress the excitation of the side frequency, the gear ratio of scheme-v is used instead of the original scheme. The speed ratio difference between the two schemes is 0.016, and the same center distance can be achieved by displacement, which meets the design requirements. It can be estimated that the nearest side frequency order of the new gear matching scheme is BD / level pressure sound 12 V 2 36.6 V C Ω =. 1 22 V V V−m c = Ω − Ω 1 22 V V V−m c = Ω − Ω 1 22 36.6V V V−m cΩ = Ω − Ω = 。 Because of the limited space, other side frequency characteristics of the improved scheme will not be described in detail.
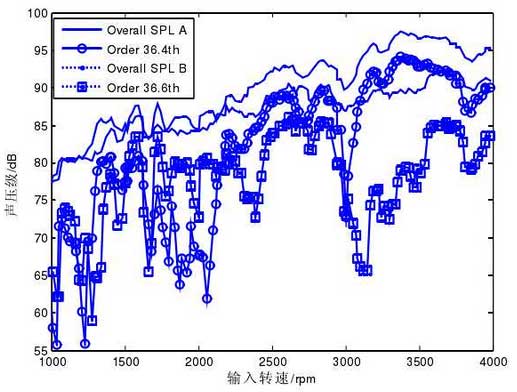
Figure 4 compares the total sound pressure level of the two schemes with the corresponding sound pressure level of the primary side frequency at the first harmonic, where the solid line is the original scheme and the dotted line is the new scheme. In the original scheme, 36.4-order side frequency is the main contribution of squealing noise, especially after 2200rpm. In the new scheme, the 36.6-order side frequency is significantly lower than the original scheme, which makes the total sound pressure level drop by more than 4dB after 2200rpm. It can be seen that the effect of noise reduction is obvious.
