
The autocorrelation function is first obtained from the time domain signal, and then the Fourier transform of the autocorrelation function is obtained as an estimate of the power spectrum. This correlation power spectrum estimation method can suppress white noise. The more points analyzed, the better the signal to noise ratio of the regular signal.
Since the angular acceleration in the time domain diagram is a non deterministic signal, it is now represented as uN (n), and its autocorrelation function r (m) is shown in the formula. The resulting power spectrum is denoted as S( ω), As shown in the formula:
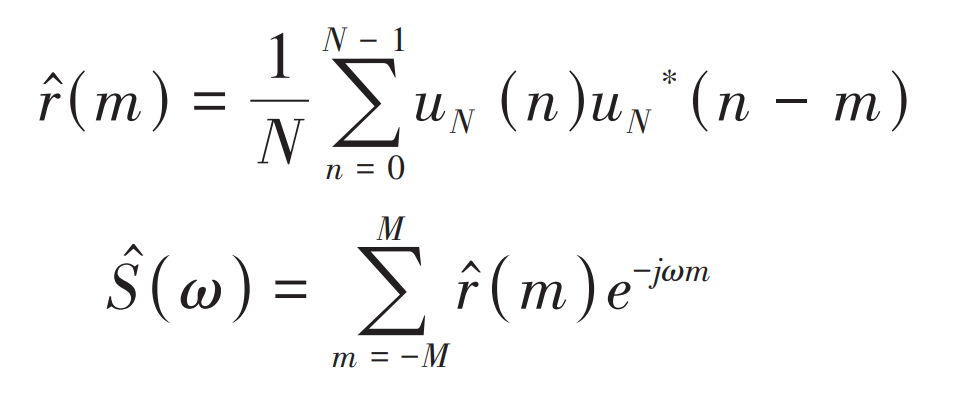
In the formula, n is the nth discrete data point; M is the m-th discrete data point; N is the total number of discrete data points; M is the total point of discrete data; ω Is the frequency interval of the sampling point; e^-j ω M is a function of complex variables, where e and j are constants.
When the sampling frequency is taken as 5500 Hz and the sampling points are taken as 1024 points, the power spectrum diagram of the original cylindrical gear pair can be obtained, as shown in the figure.
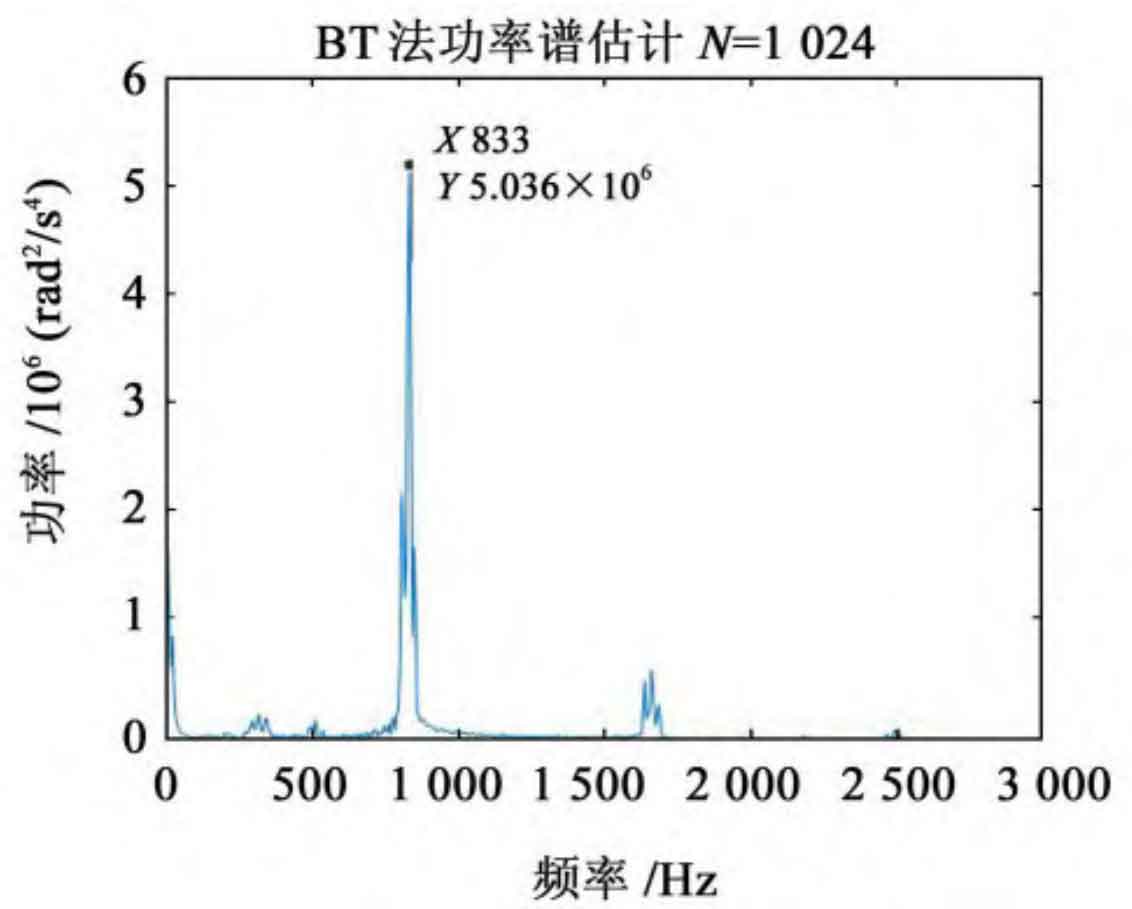
The power spectrum is obtained by using the correlation power spectrum estimation method, that is, the Wiener Simpson theorem. The area enclosed by the power spectrum curve can reflect the total power (energy) of cylindrical gear vibration. The total power value shown in the figure is 2.515 × 10^8rad^2/s^4。