
Misalignment of meshing can lead to eccentric loading of helical gears, worsen the contact state of the tooth surface, and increase the possibility of fatigue pitting damage of helical gears. The offset load of helical gears can be analyzed through the distribution cloud map of the load on the tooth surface of the driven gear (expressed as the maximum load per unit length, hereinafter referred to as the load per unit length). The cloud diagram of the load distribution on the tooth surface of the driven gear is shown in Figure 1.
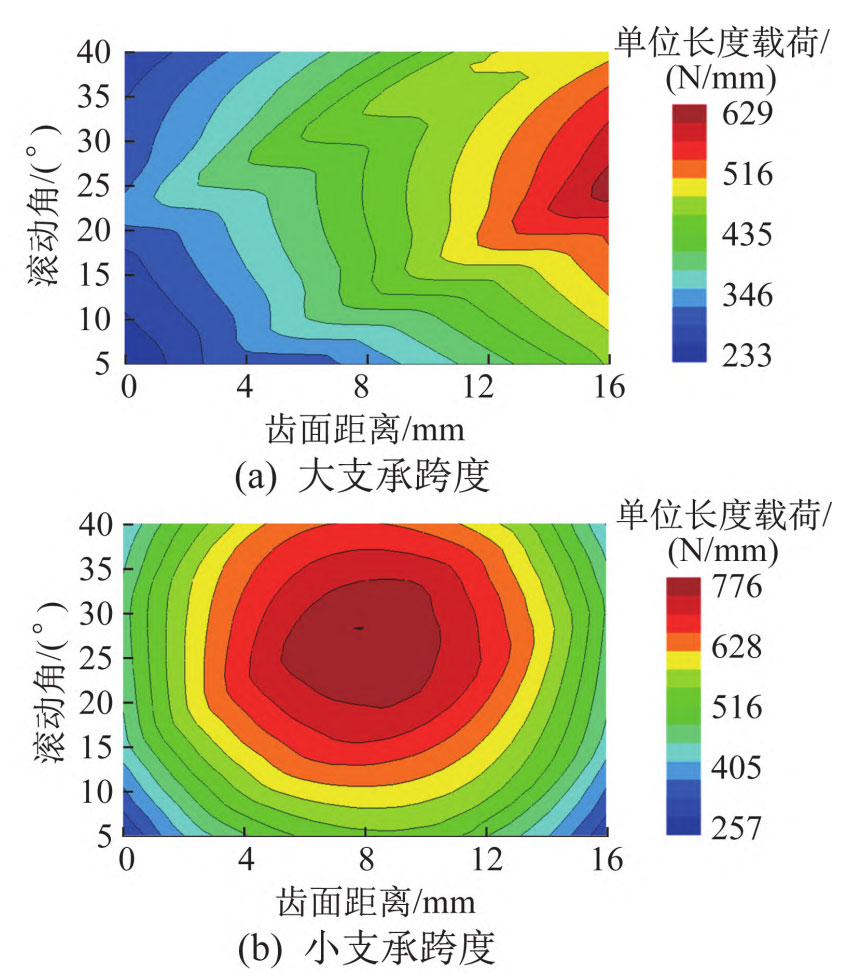
From Figure 1 (a), it can be seen that there is a wedge-shaped contact area on the tooth surface of the driven gear under a large support span, with a smaller contact area and a smaller support span. There is a significant phenomenon of eccentric load, and local stress concentration occurs on one side of the meshing tooth surface, which will exacerbate fatigue pitting damage; From Figure 1 (b), it can be seen that the contact area of the tooth surface under a small support span is elliptical, and the load is evenly distributed along the tooth width direction without obvious deviation, which can achieve ideal meshing quality. To further explore the mechanism of the influence of eccentric load on helical gears under different support spans, analyze the influence of input torque on tooth surface load. When the rolling angle is 25 °, the load changes on the tooth surface of the driven gear under different input torques are shown in Figure 2.
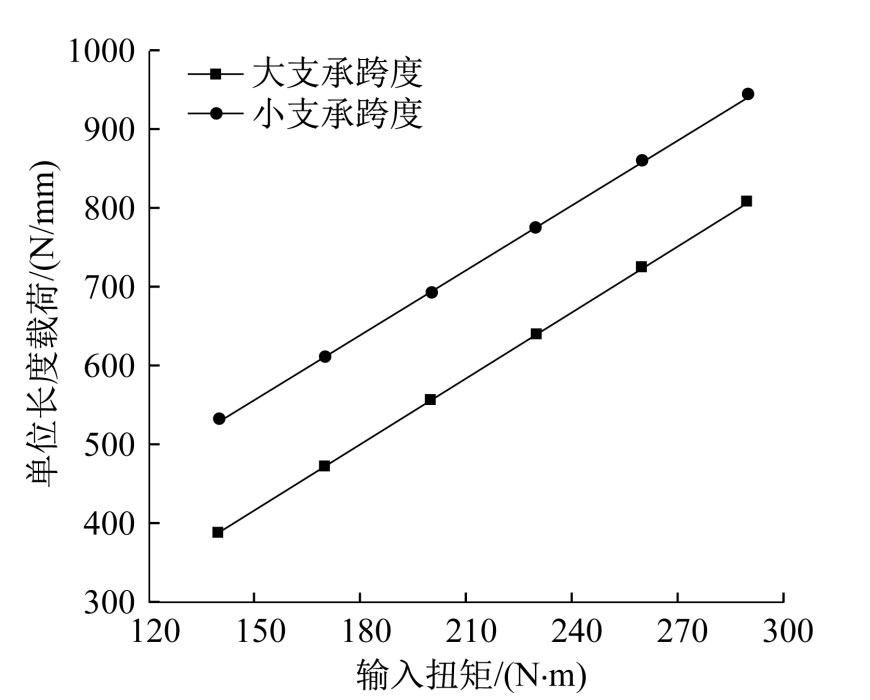
From Figure 2, it can be seen that under different support spans, the unit length load increases with the increase of input torque; When the input torque is the same, the load per unit length under a small support span is approximately 140 N/mm greater than that under a large support span. The comparison between the theoretical and simulated values of helical gear meshing misalignment under the working conditions of 2500 r/min and 230 N · m is shown in Table 1. From the table, it can be seen that the error between the theoretical and simulated values is below 5%, which verifies the accuracy of the model.
| Gear category | Theoretical value/μm | Simulation value/μm | Error/% |
| Large support span | 21.78 | 22.41 | 2.79 |
| Small support span | 2.82 | 2.91 | 2.95 |
Set the input speed to 2500 r/min and the input torque to 140170200230260290 N · m, respectively. Calculate the meshing misalignment of the helical gear under different working conditions, and the results are shown in Table 2. Set input
| Input torque/(N · m) | Large support span | Small support span |
| 140 | 13.77 | 2.19 |
| 170 | 16.68 | 2.46 |
| 200 | 19.56 | 2.70 |
| 230 | 22.41 | 2.91 |
| 260 | 25.24 | 3.09 |
| 290 | 28.04 | 3.25 |
The input torque is 230 N · m, and the input speeds are taken as 1500, 2000, 2500, 3000, 3500, and 4000 r/min, respectively. Calculate the meshing misalignment of the helical gear under different working conditions, and the results are shown in Figure 3.
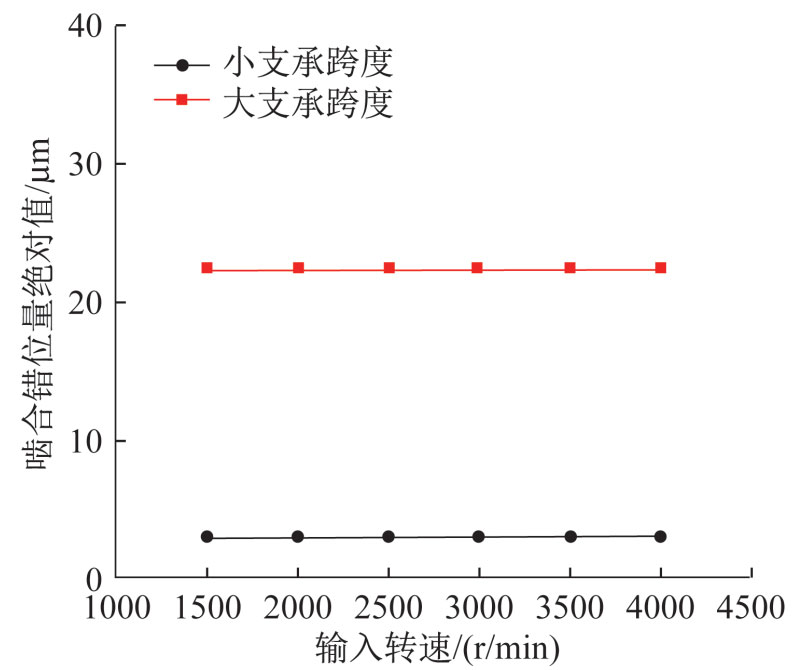
From Table 2, it can be seen that when the input speed is constant, the meshing misalignment increases linearly with the increase of input torque, and the increase in misalignment under large support spans is significantly higher than that under small support spans; From Figure 3, it can be seen that when the input torque is constant, there is no significant change in the meshing misalignment between the two support spans as the input speed increases.
The simulation results show that as the span of the shaft increases and the support stiffness decreases, the axial deflection generated increases, resulting in uneven distribution of tooth load on the helical gear, resulting in eccentric load and significant meshing misalignment; Reducing the span of the gear shaft, increasing the support stiffness, and reducing the amount of meshing misalignment play a significant role in reducing the offset load of helical gears and improving meshing noise.