
To verify the accuracy of the model, the simulation results are compared with the test data in the time domain and frequency domain.Figure 1 shows the time domain data of power take-off drive train test and simulation. From the simulation results, it can be seen that the lateral acceleration of the driving and passive gears of the tractor fluctuates roughly in the range of – 40~40g, and the minimum amplitude is not less than – 50g; The vertical acceleration fluctuates in the range of – 25~20g. The amplitude of transverse vibration is obviously greater than that of vertical vibration. This phenomenon can also be explained from the dynamic equation: the lateral motion is mainly affected by the meshing force of the tractor gear, and the vertical motion is mainly affected by the tooth surface friction during the meshing process, and the meshing force of the tractor gear is far greater than the tooth surface friction. From the test results in Figure 1, it can be seen that:
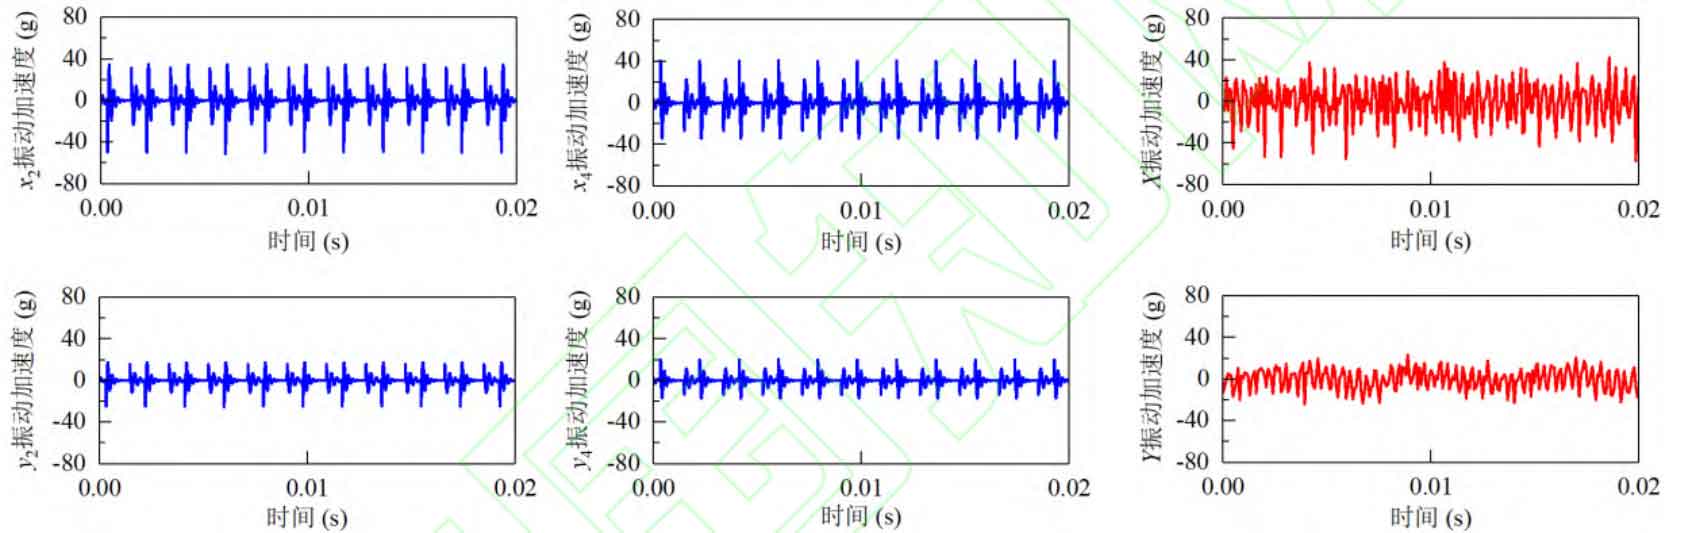
The lateral vibration fluctuates in the range of – 50~40g, and the vertical vibration is in the range of – 20~20g, which is basically consistent with the simulation data, and the phenomena described in the simulation can also be observed. In order to more accurately compare the simulation and test results, the maximum amplitude and standard deviation are used to make statistics on the results, as shown in Table 1.
| Maximum test amplitude/g | Simulation maximum amplitude/g | Test standard deviation/g | Simulation standard deviation/g | |
| Gear 2 | 54.98(24.12) | 49.18(24.66) | 10.42(7.06) | 4.55(2.73) |
| Gear 4 | 54.98(24.12) | 40.33(20.20) | 10.42(7.06) | 5.76(3.45) |
The power spectral density is used to analyze the time domain data, and the frequency domain distribution of the simulation results and test results of the power output driveline is shown in Figure 2. In the model simulation, the rotation frequencies of the driving and driven gears of the tractor are 31.06 Hz (fr2=n2/60) and 16.67 Hz (fr4=n4/60) respectively, and their meshing frequencies are 683.33 Hz (fm=z2fr2=z4fr4). It can be seen from the frequency domain results that:
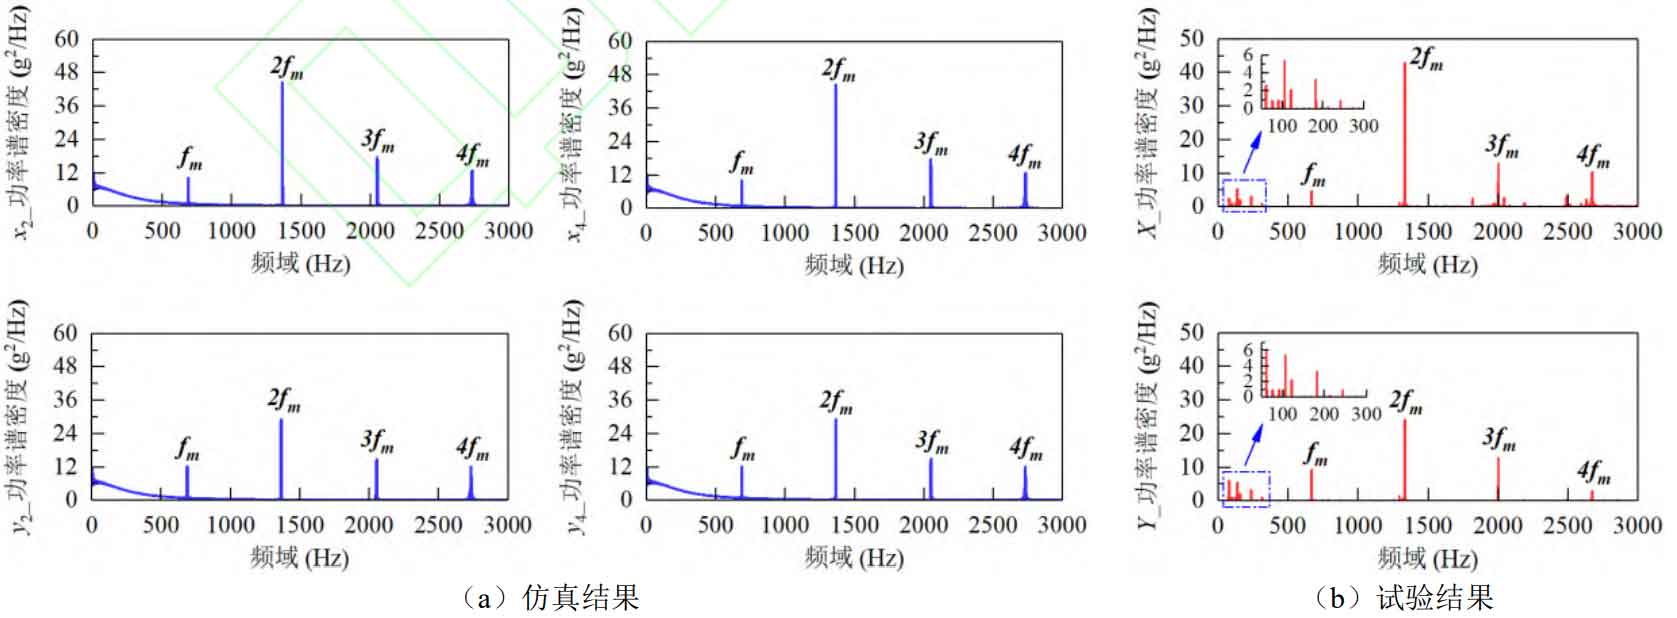
No matter the simulation results or the test results, the transverse and longitudinal vibration frequency domain distributions are the same, and the frequency domain components are the meshing frequency and its multiple frequency. However, in the low frequency region of 0-300Hz, there are differences between the simulation and test results, which may be caused by the transmission error and coupling effect of low frequency vibration between the transmission shafting and the box. Table 2 shows the comparison between simulation values and test values of frequency domain components. The maximum errors in the horizontal and vertical directions are 4.24% and 5.12% respectively.
| Meshing frequency | Simulation (X)/Hz | Test (X)/Hz | Error (X)/% | Simulation (Y)/Hz | Test (Y)/Hz | Error (Y)/% |
| 1fm | 683 | 668 | 2.20 | 683 | 663 | 2.93 |
| 2fm | 1367 | 1316 | 3.73 | 1367 | 1297 | 5.12 |
| 3fm | 2050 | 2024 | 1.27 | 2050 | 2014 | 1.76 |
| 4fm | 2733 | 2617 | 4.24 | 2733 | 2629 | 3.81 |
In conclusion, no matter in time domain or frequency domain, the results of the simulation model are basically consistent with the test results, and the accuracy and rationality of the model are verified.