Stress Analysis and Theoretical Basis
The contact fatigue life of spur gears depends on stress distribution during meshing. Using Hertz contact theory, the maximum contact stress at the pitch point is calculated as:
$$ \sigma_H = 2.5Z_EZ_\varepsilon\sqrt{\frac{2K_HT_1}{Bd_1^2} \cdot \frac{u+1}{u}} $$
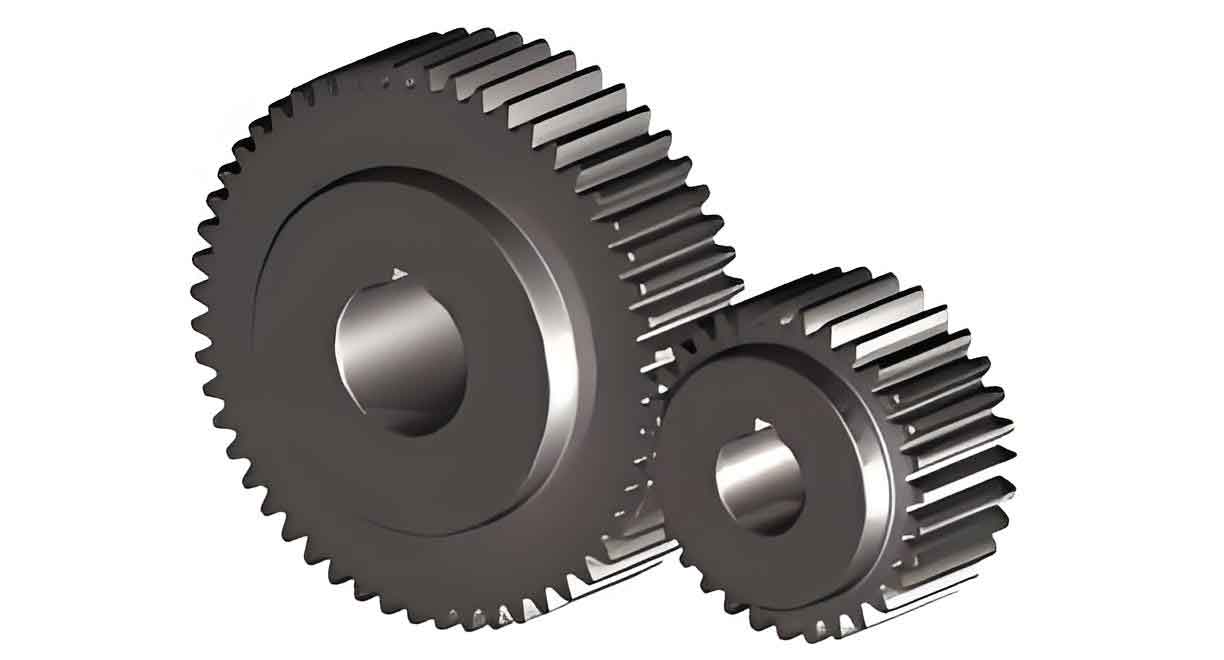
Where $Z_E$=189.8 (elastic coefficient), $K_H$=1.25×1.2×1.0×1.299=1.948 (load factor), and $T_1$=20,619 Nmm (input torque). For spur gears with parameters shown in Table 1, theoretical stress calculations align with finite element (FE) results within 5% error.
| Parameter | Driven Gear | Driver Gear |
|---|---|---|
| Teeth Count | 24 | 16 |
| Module (mm) | 4.5 | 4.5 |
| Face Width (mm) | 20 | 20 |
| Transmission Efficiency | 0.97 | |

Transient Dynamics and Load Spectrum
The time-dependent stress history for spur gears is derived through transient dynamics. The load spectrum scaling factor is defined as:
$$ S(step) = P(step) \times ScaleFactor \times S_{FE} $$
Where $S_{FE}$ represents FE-solved stress. A typical stress-time history for spur gear meshing under 30,000 Nmm torque shows peak stress at the pitch line:
| Torque (Nmm) | FE Stress (MPa) | Theoretical (MPa) | Error (%) |
|---|---|---|---|
| 30,000 | 498.43 | 485.34 | 2.63 |
| 60,000 | 698.58 | 686.38 | 1.74 |
| 90,000 | 866.56 | 840.64 | 2.99 |
Elastohydrodynamic Lubrication (EHL) Effects
Surface roughness significantly impacts spur gear friction coefficients under EHL conditions:
$$ \mu_{rms} = \frac{1}{N}\sqrt{\sum_{i=1}^{N}(\mu_i – \bar{\mu})^2} $$
Measured friction coefficients for different roughness levels are:
| Roughness (μm) | Friction Coefficient |
|---|---|
| 0.2 | 0.014 |
| 0.4 | 0.021 |
| 0.6 | 0.042 |
Fatigue Life Prediction Model
The S-N curve for Cr-alloy steel (UTS=1,010 MPa) is estimated using:
$$ \frac{\sigma_a}{\sigma_{UTS}} + \frac{\sigma_m}{\sigma_{UTS}} = 1 $$
Fatigue life calculations employ Palmgren-Miner rule:
$$ D = \sum_{i=1}^{k}\frac{n_i}{N_i} $$
Where $n_i$=cycles at stress level $σ_i$, $N_i$=failure cycles from S-N curve. Critical nodes predominantly appear at gear tooth ends due to edge loading.
Multi-Condition Simulation Results
Rotational Speed Effects
| Speed (rpm) | Cycles | Service Life (hrs) |
|---|---|---|
| 1,200 | 2.97×10⁹ | 41,222 |
| 1,500 | 1.37×10⁹ | 15,222 |
| 1,800 | 6.63×10⁸ | 6,152 |
Torque Loading Effects
| Torque (Nmm) | Cycles | Service Life (hrs) |
|---|---|---|
| 30,000 | 4.61×10⁸ | 3,650 |
| 60,000 | 7.13×10⁶ | 57 |
| 90,000 | 5.77×10⁵ | 5 |
Surface Roughness Effects
| Friction Coefficient | Cycles | Life Reduction (%) |
|---|---|---|
| 0.042 | 2.97×10⁹ | Base |
| 0.021 | 2.80×10⁹ | 5.7 |
| 0.014 | 2.64×10⁹ | 11.0 |
Conclusion
This study establishes a comprehensive spur gear contact fatigue model considering multiple operational parameters. Key findings include:
- Critical contact fatigue nodes concentrate at tooth ends along face width
- Load torque exhibits greatest influence on life reduction (99.8% decrease from 30kNmm to 90kNmm)
- Surface roughness reduction improves fatigue life through EHL friction modulation
The methodology provides valuable insights for spur gear design optimization in aerospace and power transmission applications.
