
Gears are fundamental transmission components that are continuously pushed toward higher power density, higher precision, lower noise, and miniaturization. The tribological performance of gear pairs is largely governed by the micro-scale interactions of rough surfaces. Under normal operating conditions, the contact between gear teeth occurs through the asperities that populate the real surfaces. Therefore, understanding the elastic-plastic contact behavior of single and multiple asperities on spur gear surfaces is essential for predicting friction, wear, scuffing, and fatigue failure. In this thesis, I develop a continuous elastic-plastic asperity contact model for both frictionless and frictional conditions, apply it to a real spur gear pair, and subsequently extend the analysis to multiple asperities represented by cylinder-shaped columns with parabolic cross-sections. The work combines analytical derivations, finite element simulations, and experimentally measured surface topography to provide a practical computational approach for gear micro-contact analysis.
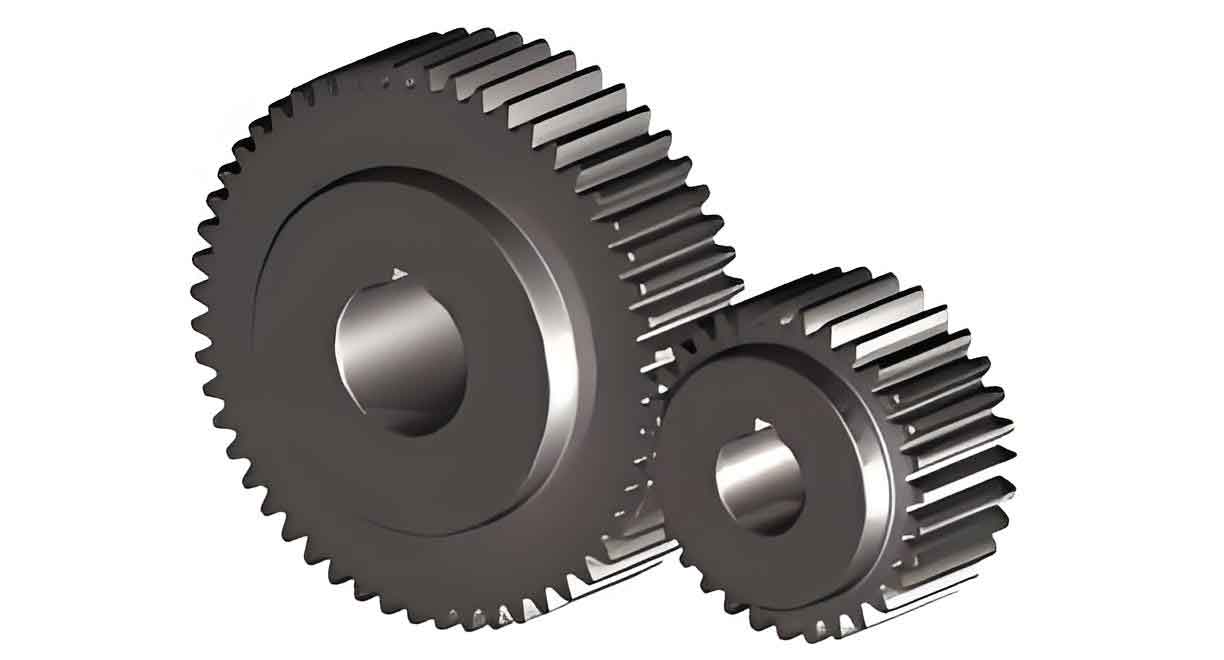
This study focuses on a spur gear pair manufactured by hobbing with a module of 6 mm, 30 teeth, and a face width of 80 mm. The gear material is 45 steel with elasticity modulus \(E = 206\) GPa, Poisson’s ratio \(\nu = 0.3\), and yield strength \(\sigma_s = 418\) MPa. Surface topography of the gear teeth was measured using a white light interferometer after running-in. From the raw data, the average asperity tip radii of the two contacting surfaces were determined to be \(R_1 = 1.65~\mu\text{m}\) and \(R_2 = 1.75~\mu\text{m}\).
1. Asperity Geometry and Contact Configurations
Real rough surfaces consist of numerous asperities of random heights and curvatures. In the present model, each asperity is approximated as a smooth paraboloid of revolution. For a gear pair, the local contact can be idealized either as a normal contact (no friction) where the asperity tips meet along the line normal to the nominal surface, or as a side contact (with friction) where the asperities touch at oblique points. These two configurations are shown schematically in the analytical model. In the normal contact case, the axes of the two paraboloids are parallel, and the load is applied along the common normal. In the side contact case, the asperities are offset, and the contact is made at a point where the tangent plane is inclined with respect to the applied load direction. The angle \(\theta\) between the applied force and the contact normal is related to the average friction coefficient \(\mu\) through \(\tan \theta = \mu\).
The equivalent radius of curvature for two spheres in contact is defined by
$$ R = \frac{R_1 R_2}{R_1 + R_2}. $$
The composite elastic modulus is calculated from the material properties of both bodies:
$$ \frac{1}{E_t} = \frac{1-\nu_1^2}{E_1} + \frac{1-\nu_2^2}{E_2}. $$
For the present gear steel, \(E_1=E_2=E\) and \(\nu_1=\nu_2=\nu\), leading to
$$ E_t = \frac{E}{2(1-\nu^2)} \approx 113.2~\text{GPa}. $$
2. Single Asperity Elastic-Plastic Contact Model
Based on the classical Hertz theory, the elastic contact radius \(r_a\) and the relative approach \(\delta\) for a sphere against a flat surface are given by:
$$ r_a = \left(\frac{3 F R}{4 E_t}\right)^{1/3}, $$
$$ \delta = \frac{r_a^2}{R}. $$
The corresponding load-displacement relationship is
$$ F = \frac{4}{3} E_t R^{1/2} \delta^{3/2}. $$
The onset of plastic deformation is determined by the critical interference \(\delta_c\), which according to the CEB model is
$$ \delta_c = \left(\frac{\pi k H}{2 E_t}\right)^2 R, $$
where \(k\) is the mean contact pressure factor given by \(k=0.454+0.41\nu\), and \(H\) is the hardness of the softer material, typically \(H=2.8\sigma_s\). For the gear steel with \(\nu=0.3\), \(k=0.577\), and \(H \approx 1.17~\text{GPa}\).
The critical load at the onset of yielding is then
$$ F_c = \frac{4}{3} E_t R^{1/2} \delta_c^{3/2}. $$
When \(\delta > \delta_c\), elastic-plastic deformation occurs. In the proposed model, the plastic zone starts below the contact surface at a depth \(y_1\) determined by the Von Mises yield criterion. Following Jackson and Green’s approach, the depth of the initial yielding point can be obtained by solving the equation
$$ \frac{d}{dy_1} \left[ \frac{F_0}{r_a^2} \left( \frac{1 + \nu}{2} \left( 1 – \frac{y_1}{r_a} \tan^{-1}\frac{y_1}{r_a} \right) – \frac{1}{2} \left( \frac{y_1^2}{r_a^2 + y_1^2} \right) \right) \right] = \sigma_s, $$
where \(F_0\) is the maximum contact pressure at the onset of yielding. For the present gear steel, this yields \(y_1 \approx 0.48 r_a\).
The elastic-plastic contact region is divided into an inner plastic zone of radius \(r_p\) and an outer elastic annulus. The total contact load is obtained by integrating the pressure distribution. For a spherical asperity, the pressure distribution in the elastic region is
$$ p(r) = \frac{3F}{2\pi r_a^2} \sqrt{1 – \left(\frac{r}{r_a}\right)^2}. $$
Thus, the force supported by the elastic annulus is
$$ F_{Te} = \int_{r_p}^{r_a} p(r) \, 2\pi r \, dr = \frac{2 E_t r_a^{3/2}}{3R^{1/2}} \left( r_a^2 – r_p^2 \right)^{3/2}. $$
The force supported by the inner plastic zone is approximated by
$$ F_{Tp} = \pi r_p^2 \sigma_{rp}, $$
where \(\sigma_{rp}\) is the mean contact pressure over the plastic zone. In the present model, the mean pressure is taken as the hardness \(H\) when the plastic zone is fully developed, but a smoother transition is assumed to avoid the discontinuity observed in the KE model. The total elastic-plastic contact load becomes
$$ F_T = F_{Te} + F_{Tp} = \frac{2 E_t}{3R} \left( r_a^2 – r_p^2 \right)^{1/2} \left( r_a^2 + 2 r_p^2 \right). $$
Defining the dimensionless interference and load as
$$ \delta^* = \frac{\delta}{\delta_c}, \qquad F^* = \frac{F}{F_c}, $$
the proposed model can be compared with the CEB and KE models. The comparison shows that for \(\delta^* < 40\), all three models agree well. For larger interferences, the CEB model deviates because it assumes a constant average contact pressure after yielding. The KE model exhibits a discontinuity at \(\delta^* = 6\), while the present model maintains continuity in both load and stress, which is physically more realistic for a continuous elastic-plastic material.
2.1 Frictional (Side) Contact Model
When friction is present, the contact point is offset from the line connecting the asperity centers. The equivalent radius of curvature at the contact point in the plane perpendicular to the contact normal must be calculated using the local radii of curvature at the oblique point. For two paraboloids, the equivalent radius in the side contact plane can be expressed as
$$ R_0 = \frac{R_1′ R_2′}{R_1′ + R_2′}, $$
where \(R_1’\) and \(R_2’\) are the principal radii of curvature at the side contact point. These are obtained from the derivatives of the surface profiles at the contact coordinates. The critical interference for side contact becomes
$$ \delta_{cn} = \left( \frac{\pi k H}{2 E_t} \right)^2 R_0. $$
The contact radius in the normal direction is
$$ r_{n0} = \sqrt{2 R_0 \delta_{n0}}, $$
where \(\delta_{n0}\) is the normal component of the interference. The contact area in side contact is elliptical rather than circular. The load-displacement relation follows the same form as the normal contact but with the modified radius \(R_0\).
For the gear pair studied, with an average friction coefficient of \(\mu=0.1\), the side contact angle is \(\theta=\arctan(0.1)\approx 5.71^\circ\). The offset distance \(d_0=0.68~\mu\text{m}\) and vertical separation \(y_0=0.068~\mu\text{m}\) were measured from the surface profiles.
3. Finite Element Verification of Single Asperity Contact
To verify the analytical model, a finite element model of two paraboloidal asperities was constructed in ABAQUS. Each asperity had a tip radius of 1.65 and 1.75 μm, respectively. The model used eight-node linear brick elements (C3D8R) with reduced integration. The lower asperity was fully constrained at its base, while a displacement-controlled load was applied to the top surface of the upper asperity. Several displacement levels were applied: \(1\delta_c\), \(2\delta_c\), \(6\delta_c\), \(7\delta_c\), and \(10\delta_c\). The analysis was performed for both normal contact and side contact cases.
The finite element results showed that the maximum Von Mises stress occurs below the contact surface for small interferences, confirming the assumption that plastic yielding initiates sub-surface. For \(\delta=6\delta_c\), the plastic zone reaches the surface, which corresponds to the discontinuity point in the KE model. The stress contours at the initial yielding plane are circular for normal contact and elliptical for side contact, as expected from the analytical assumptions.
Figure below presents the Von Mises stress distribution along the normal direction for different displacement levels.
$$ \text{Von Mises stress (GPa)} = f(y) \quad \text{for } y \in [0, 0.1~\mu\text{m}]. $$
The contact stress versus contact radius curves obtained from the analytical model and the finite element model are compared in the following tables.
| Displacement level | Analytical contact radius (μm) | FEM contact radius (μm) | Analytical max contact stress (GPa) | FEM max contact stress (GPa) |
|---|---|---|---|---|
| \(2\delta_c\) | 0.00412 | 0.00398 | 1.83 | 1.76 |
| \(6\delta_c\) | 0.0092 | 0.0088 | 2.42 | 2.35 |
| \(7\delta_c\) | 0.0104 | 0.0101 | 2.51 | 2.47 |
| \(10\delta_c\) | 0.0136 | 0.0132 | 2.73 | 2.68 |
The agreement between the analytical and FEM results is within 5% for all cases, validating the proposed model for spur gear asperity contact. The side contact model shows slightly better agreement with the FEM results than the normal contact model, likely because the elliptical contact shape is more realistic in the actual gear contact.
4. Reverse Engineering of the Real Rough Gear Surface
To analyze the real gear surface, I first measured the tooth flank topography using a Wyko NT9100 optical profiler. The measured data were exported in ASCII format. I imported the point cloud into CATIA using the reverse engineering module. The point cloud was cleaned and simplified to reduce computational cost while preserving the essential surface features. The points were then fitted to a surface, and from that surface a solid body was generated by extrusion.
Because the two contacting rough surfaces are extremely complex, I simplified the contact problem by converting the two rough surfaces into an equivalent single rough surface contacting a rigid flat plane. This is a standard procedure in contact mechanics: the equivalent surface has a separation distance \(y_e\) equal to the sum of the upper surface height \(y_u\) and the lower surface height \(y_d\) at each lateral position:
$$ y_e(x,y) = y_u(x,y) + y_d(x,y). $$
The equivalent rough surface retains the combined statistical properties of both surfaces. For the gear pair, the measured average roughness \(R_a\) was about 0.8 μm. The equivalent surface was then further simplified into a series of parallel cylinder-like asperities with parabolic cross-sections, based on the observation that the measured surface exhibited a wavy, directional texture.
5. Multi-Asperity Contact Model
Real gear surfaces contain many asperities that interact with each other through the substrate deformation. The interaction becomes significant when the spacing between asperities is comparable to their radii. To study this effect, I constructed models with three identical cylinder-shaped asperities of parabolic cross-section. The cross-section equation of each asperity is
$$ y(x) = -\frac{x^2}{2 R_m}, $$
where \(R_m\) is the radius of curvature at the asperity tip. Based on the measured surface parameters, the average tip radius \(R_m\) was set to 6.6 μm. The asperities were placed on a rigid base with different spacing \(d_m\) and different relative heights \(h_m\). The rigid plate was pressed against the asperities with a total displacement of \(6\delta_c\), where \(\delta_c\) for a cylinder-plane contact is
$$ \delta_{pc} = \frac{2 R_m \sigma_s}{E_t} \left[ \ln \left( \frac{2 E_t}{\sigma_s} \right) – 1 \right] C, $$
with \(C\) a constant depending on Poisson’s ratio. For \(\nu=0.3\), \(C=1.64\). The numerical value for the present material is \(\delta_{pc} \approx 0.38~\mu\text{m}\).
I considered four height distributions of the three asperities, denoted as LLH, LHL, LHH, and HLH. In these notations, ‘H’ denotes a high asperity and ‘L’ a low asperity. For instance, LLH means the first two asperities are low and the right one is high. I also varied the spacing \(d_m\) from 0.25 μm to 2 μm while keeping all asperities at the same height to isolate the spacing effect.
For a single parabolic cylinder contacting a rigid flat under elastic conditions, the half-width of the contact area is
$$ b = \sqrt{\frac{4 F R_m}{\pi L E_t}}, $$
where \(L\) is the length of the cylinder. The total contact area for a single cylinder is
$$ A = 2 b L. $$
For multiple asperities that do not interact, the total contact area would simply be the sum of the individual areas. However, when the asperities are close enough, the substrate deformation from neighboring asperities reduces the local contact pressure, altering the load sharing and the real contact area.
6. Finite Element Model of Three Asperities
Finite element models were built in ABAQUS for the three-asperity configuration. Each asperity was a long parabolic cylinder (plane strain condition) with a length of 10 μm. The rigid plate was modeled as an analytical rigid surface. The bottom of the asperities was fixed, and a downward displacement of \(6\delta_{pc}\) was applied to the rigid plate. The material behavior was defined using the measured stress-strain curve of the gear steel, with the plastic part summarized in the following table:
| Stress (MPa) | Plastic strain |
|---|---|
| 418 | 0 |
| 500 | 0.0158 |
| 605 | 0.0298 |
| 695 | 0.056 |
| 780 | 0.095 |
| 829 | 0.15 |
| 882 | 0.25 |
| 908 | 0.35 |
| 921 | 0.45 |
| 932 | 0.55 |
| 955 | 0.65 |
| 988 | 0.75 |
| 1040 | 0.85 |
Mesh convergence was studied by varying the element size near the contact region. I found that a minimum element size of 0.01 μm at the contact surface gave stable results for the maximum Von Mises stress and the total contact area. The final mesh had about 54,600 elements for a single three-asperity model.
7. Results and Discussion
7.1 Effect of Asperity Relative Heights
For a fixed spacing of \(d_m = 0.5~\mu\text{m}\), I evaluated the four height distributions with \(h_m = \delta_{pc}\), \(2\delta_{pc}\), and \(3\delta_{pc}\). The Von Mises stress along the contact surface is presented in the following table as the maximum values for the left, middle, and right asperities.
| Distribution | \(h_m\) | Left max stress (MPa) | Middle max stress (MPa) | Right max stress (MPa) |
|---|---|---|---|---|
| LLH | \(\delta_{pc}\) | 419.0 | 418.5 | 420.1 |
| LLH | \(2\delta_{pc}\) | 398.9 | 375.4 | 423.0 |
| LLH | \(3\delta_{pc}\) | 346.0 | 249.0 | 420.3 |
| LHL | \(\delta_{pc}\) | 419.0 | 420.3 | 418.7 |
| LHL | \(2\delta_{pc}\) | 394.0 | 421.0 | 393.7 |
| LHL | \(3\delta_{pc}\) | 304.0 | 420.7 | 304.5 |
| LHH | \(\delta_{pc}\) | 418.0 | 420.5 | 420.5 |
| LHH | \(2\delta_{pc}\) | 370.3 | 421.1 | 421.1 |
| LHH | \(3\delta_{pc}\) | 225.0 | 421.3 | 421.3 |
| HLH | \(\delta_{pc}\) | 420.0 | 418.3 | 420.0 |
| HLH | \(2\delta_{pc}\) | 422.0 | 297.3 | 422.0 |
| HLH | \(3\delta_{pc}\) | 421.0 | 104.2 | 421.2 |
The results indicate that when an asperity is adjacent to a high neighbor, its stress decreases significantly because the high neighbor carries more load. For example, in the HLH distribution, the middle low asperity experiences almost no contact when the height difference is \(3\delta_{pc}\), and the Von Mises stress on its surface drops to 104 MPa. This interaction is caused by the elastic deformation of the substrate, which makes the lower asperity act as if it is partially unloaded.
The relative deformation along the contact surface follows a similar trend. The maximum deformations for each distribution are summarized below.
| Distribution | \(h_m\) | Left max deformation (nm) | Middle max deformation (nm) | Right max deformation (nm) |
|---|---|---|---|---|
| LLH | \(\delta_{pc}\) | 2.900 | 2.898 | 3.478 |
| LLH | \(2\delta_{pc}\) | 2.319 | 2.319 | 3.478 |
| LLH | \(3\delta_{pc}\) | 1.739 | 1.739 | 3.478 |
| LHL | \(\delta_{pc}\) | 2.900 | 3.478 | 2.899 |
| LHL | \(2\delta_{pc}\) | 2.318 | 3.478 | 2.318 |
| LHL | \(3\delta_{pc}\) | 1.739 | 3.478 | 1.739 |
| LHH | \(\delta_{pc}\) | 2.900 | 3.478 | 3.478 |
| LHH | \(2\delta_{pc}\) | 2.319 | 3.478 | 3.478 |
| LHH | \(3\delta_{pc}\) | 1.740 | 3.478 | 3.478 |
| HLH | \(\delta_{pc}\) | 3.478 | 2.898 | 3.478 |
| HLH | \(2\delta_{pc}\) | 3.478 | 2.319 | 3.478 |
| HLH | \(3\delta_{pc}\) | 3.478 | 2.103 | 3.478 |
These values show that the high asperities always undergo the full applied displacement, while the low asperities deform less as the height difference increases. In the HLH case with \(3\delta_{pc}\), the middle low asperity deforms only 2.103 nm compared to 3.478 nm for the high ones.
7.2 Effect of Asperity Spacing
When the three asperities have equal heights (\(h_m=0\)), the spacing \(d_m\) was varied from 0.25 μm to 2 μm. The maximum Von Mises stress on each asperity was nearly constant (about 420 MPa), but the stress distribution between the asperities changed substantially. The Von Mises stress at the midpoint between two adjacent asperities decreases with increasing spacing, as shown in the following table.
| Spacing \(d_m\) (μm) | Midpoint stress (MPa) | Total contact area (μm²) |
|---|---|---|
| 0 (single asperity) | — | 0.513 |
| 0.25 | 152 | 0.924 |
| 0.5 | 124 | 1.030 |
| 0.75 | 111.5 | 1.185 |
| 1 | 91.7 | 1.224 |
| 1.25 | 72.5 | 1.252 |
| 1.5 | 54.8 | 1.292 |
| 2 | 34.1 | 1.376 |
The total contact area increases with spacing, approaching the sum of three independent asperities (3×0.513 = 1.539 μm²). The relationship between area and spacing is nearly linear in the range from 0.25 μm to 2 μm. The increase in contact area with spacing is a direct consequence of the reduced interaction: as the asperities move apart, the substrate deformation caused by one asperity has less influence on the others, allowing each asperity to carry more load and therefore to have a larger contact area for the same total displacement.
I also examined the Von Mises stress distribution along the normal direction from the contact point of the middle asperity. For each spacing, the stress first increases to a maximum below the surface, then decreases with depth. An inflection point was identified from the stress profile. The location of this inflection point and the corresponding stress value are listed in the table below.
| Spacing \(d_m\) (μm) | Inflection point depth (μm) | Stress at inflection point (MPa) |
|---|---|---|
| 0.25 | 0.193 | 321.1 |
| 0.5 | 0.296 | 251.7 |
| 0.75 | 0.385 | 214.0 |
| 1 | 0.471 | 190.6 |
| 1.25 | 0.628 | 156.3 |
| 1.5 | 0.793 | 133.4 |
| 2 | 0.995 | 114.7 |
As the spacing increases, the inflection point moves deeper, and the stress at that point decreases. This indicates that the interaction effect weakens with spacing, which is consistent with the midpoint stress results.
7.3 Total Contact Area for Different Height Distributions
For a fixed spacing of 0.5 μm, the total contact areas for the four height distributions at different height differences are summarized in the next table.
| Distribution | \(h_m = \delta_{pc}\) (μm²) | \(h_m = 2\delta_{pc}\) (μm²) | \(h_m = 3\delta_{pc}\) (μm²) |
|---|---|---|---|
| LLH | 0.950 | 0.894 | 0.758 |
| LHL | 0.990 | 0.888 | 0.754 |
| LHH | 1.025 | 0.977 | 0.906 |
| HLH | 1.014 | 0.967 | 0.785 |
In every distribution, the total contact area decreases as the height difference increases. The reduction is most pronounced in the LHL distribution, where the high asperity is in the middle. When the high asperity is on the side (LHH), the reduction is smaller because the two high asperities share more load and the low one is unloaded rather than disappearing from contact. The HLH distribution shows an intermediate trend because the low middle asperity loses contact quickly, but the two high side asperities maintain a large contact area.
8. Conclusion
I have presented a comprehensive study of elastic-plastic contact between rough surfaces of a spur gear drive, focusing on single and multiple asperities. The main contributions and findings are summarized as follows:
- A continuous elastic-plastic asperity contact model was developed for both normal (frictionless) and side (frictional) contacts. The model yields results consistent with the CEB and KE models for small to moderate plastic deformation, while avoiding the constant mean contact pressure simplification of the CEB model and the discontinuity of the KE model at \(\delta^*=6\). Thus, the model is suitable for micro-contact analysis of spur gear surfaces.
- The analytical model was verified against finite element simulations of two gear asperities under controlled displacement. The contact radius and maximum contact stress agreed within 5% for both normal and side contact configurations. The stress contours at the initial yielding plane were circular for normal contact and elliptical for side contact, confirming the assumed pressure distributions.
- Using measured surface topography of a real spur gear, I constructed a three-dimensional rough surface model by reverse engineering in CATIA. The contact between two rough surfaces was reduced to an equivalent rough surface against a rigid flat, which allowed efficient finite element modeling while preserving the statistical characteristics of the interface.
- Multi-asperity contact was analyzed using three parabolic cylinder asperities in different height distributions and spacings. The results showed that the presence of higher neighboring asperities significantly reduces the stress and deformation of lower asperities. For example, in the HLH distribution with a height difference of \(3\delta_{pc}\), the middle low asperity carries almost no load. As the spacing increases, the interaction weakens, and the total contact area increases nearly linearly, approaching the sum of independent asperities.
- The total contact area of multiple asperities depends on both the relative heights and the spacing. For a given spacing, the area is the largest when the high asperities are on the sides (LHH) and the smallest when the low asperities are on the sides (LLH or LHL). This suggests that the spatial distribution of asperities on a spur gear surface plays a critical role in determining the real contact area and hence the friction and wear behavior.
The proposed models and simulation procedures provide a practical tool for predicting the micro-contact behavior of spur gear surfaces under both ideal and frictionally loaded conditions. Future work will extend the analysis to more realistic random surfaces with a larger number of asperities, and incorporate the effect of sliding velocity and temperature on the elastic-plastic contact response.