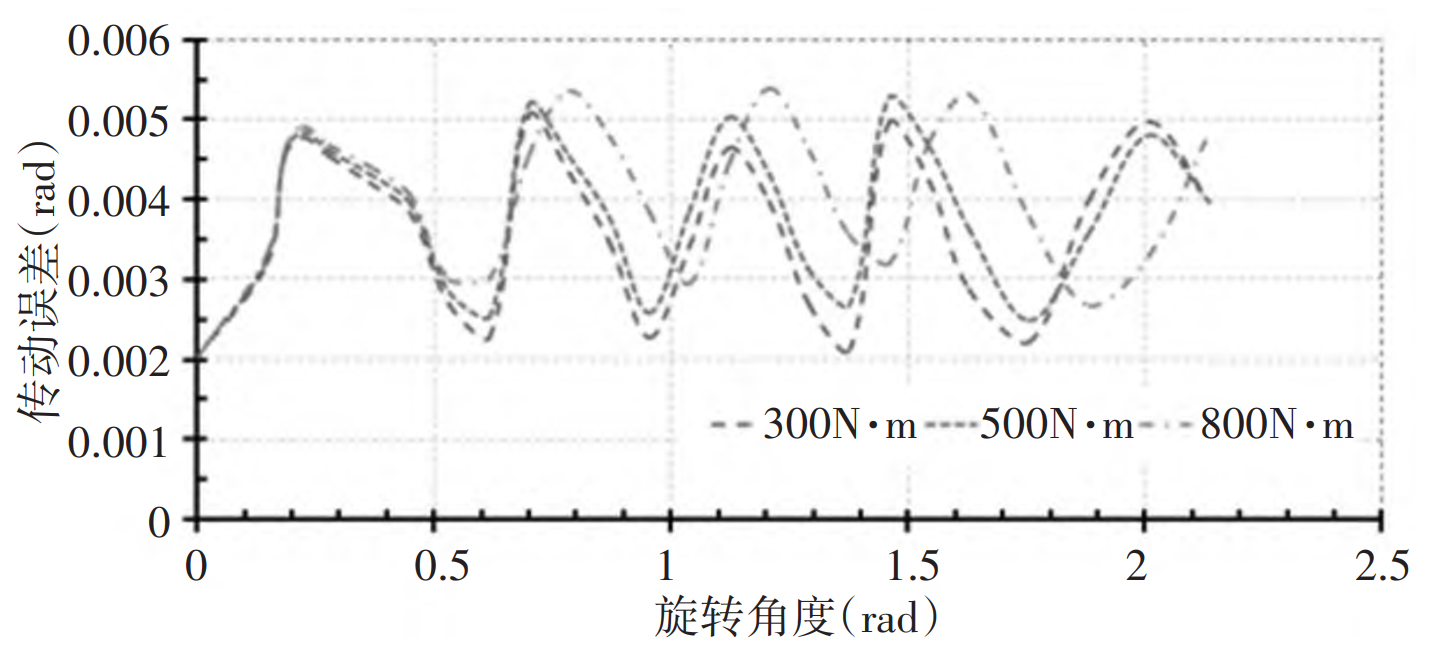
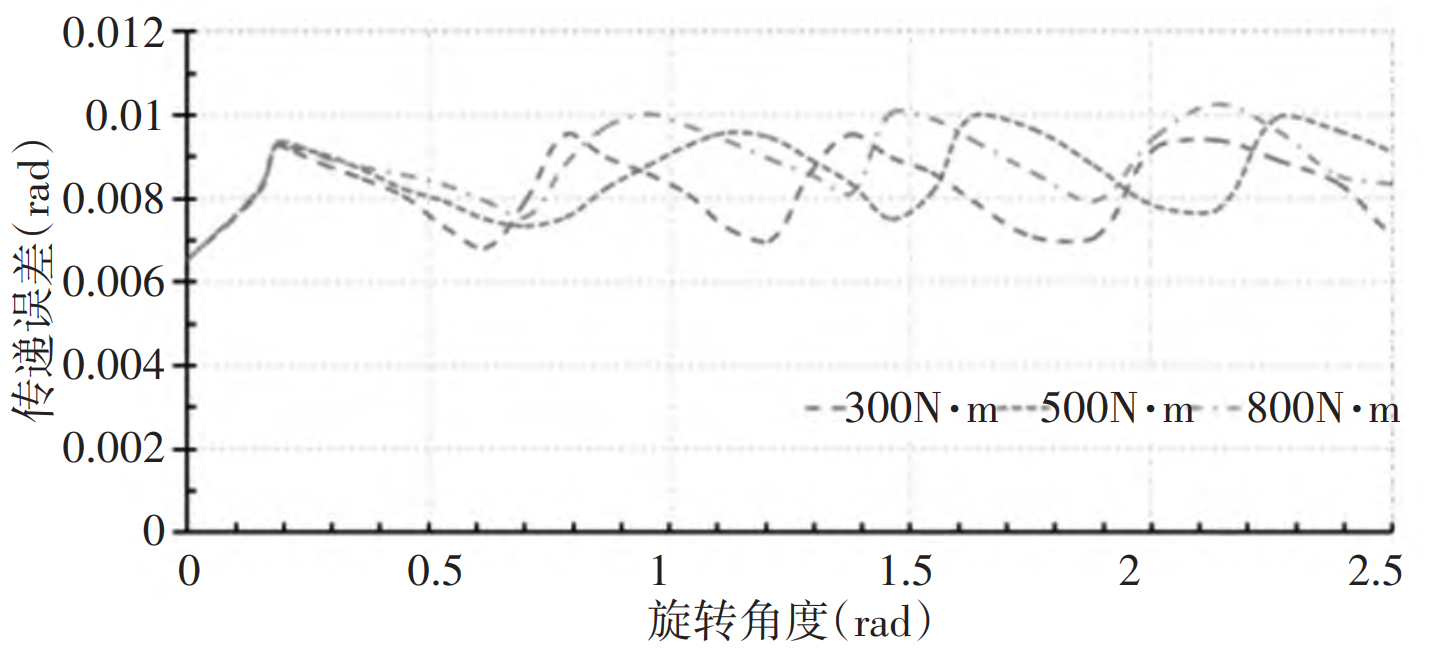
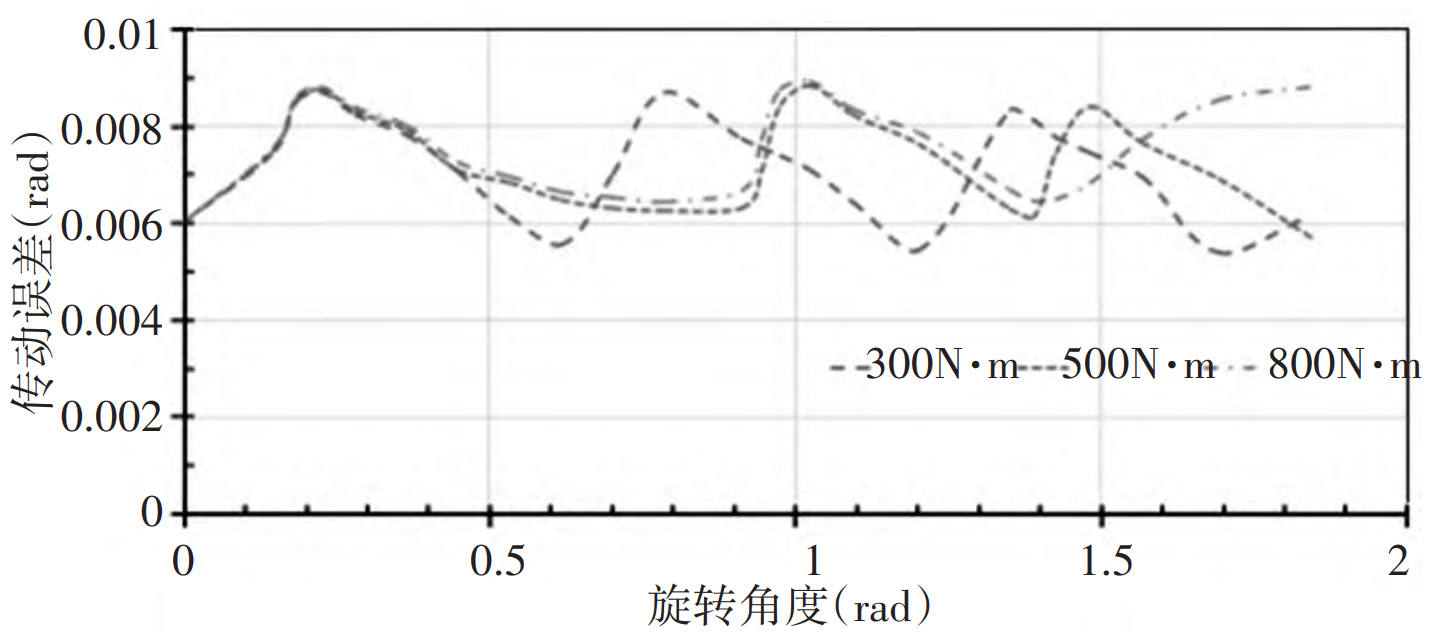
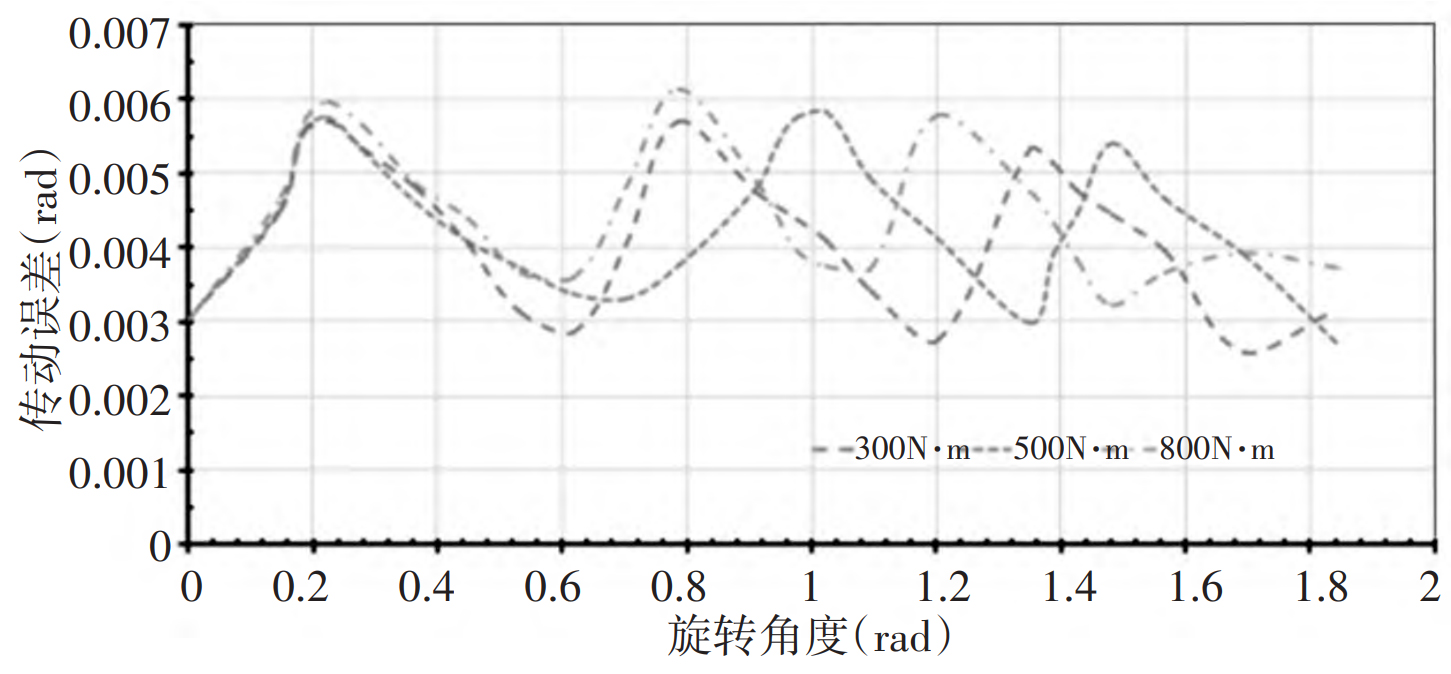
Through the finite element software, output the angle of spiral bevel gear with four types of offset error under three load conditions, calculate the transmission error value, and draw the spiral bevel gear transmission error curve, as shown in Fig. 1~Fig. 4.
Static error curve analysis:
First of all, it can be intuitively seen that the transmission error curve has obvious periodicity, which is caused by the impact received when the spiral bevel gear meshing in and out. The periodicity of the transmission error curve is more regular when the load is lower.
From Figure 1 to Figure 4, we can see the approximate range of error values of each group of models, as shown in Table 1.
| Model | Error value range |
| Axial deviation of large gear | (0.002~0.006) |
| Axial offset of pinion | (0.006~0.010) |
| Axis intersection offset | (0.006~0.009) |
| Axis spacing offset | (0.003~0.006) |
Therefore, the transmission error values of the four kinds of error offsets can be obtained from small to large: the axial displacement of the big gear, the shaft spacing, the shaft intersection angle, and the axial displacement of the small gear.
The amplitude and fluctuation of the transmission error curve can reflect the meshing performance of spiral bevel gears. In order to more intuitively reflect the results of the transmission error curve, we use the statistical analysis method to measure the results of the transmission error curve by amplitude, average value and standard deviation.
Among them, amplitude is the maximum absolute value in a period, and standard deviation can reflect the dispersion of a group of data. We use the standard deviation of transmission error value to consider the fluctuation of amplitude. The average value of amplitude and transmission error is used to reflect the size of error curve value, as shown in Tables 2 to 5.
| Amplitude | Average value | Standard deviation | |
| 300N·m | 0.005052999 | 0.003637856 | 0.000990218 |
| 500N·m | 0.005263446 | 0.003845665 | 0.000935207 |
| 800N·m | 0.005375891 | 0.004042188 | 0.0009098 |
| Amplitude | Average value | Standard deviation | |
| 300N·m | 0.009526091 | 0.008223235 | 0.000889053 |
| 500N·m | 0.009962499 | 0.008568622 | 0.000872394 |
| 800N·m | 0.010240365 | 0.008878075 | 0.000845831 |
| Amplitude | Average value | Standard deviation | |
| 300N·m | 0.008689623 | 0.004283802 | 0.00095472 |
| 500N·m | 0.008818365 | 0.004401501 | 0.000937085 |
| 800N·m | 0.00890846 | 0.004514541 | 0.000878544 |
| Amplitude | Average value | Standard deviation | |
| 300N·m | 0.005689623 | 0.004283802 | 0.00095472 |
| 500N·m | 0.005818365 | 0.004401501 | 0.000937085 |
| 800N·m | 0.00611891 | 0.004514541 | 0.000878544 |
From the values in the table, we can see that the amplitude and average value of the transmission error of the four spiral bevel gear models will increase with the increase of the load, while the standard deviation will decrease with the increase of the load. This shows that with the increase of load, the transmission error value of spiral bevel gear increases, and the fluctuation of transmission error amplitude becomes gentle.


