
As a fundamental transmission component in mechanical systems, the dynamic behavior of helical gear pairs under operational conditions has been a persistent focus of engineering research. The pursuit of high precision, high load capacity, and high reliability in modern gear drives, especially in high-speed gearboxes, necessitates a deeper understanding of the factors influencing their dynamic signature. Among various design and manufacturing tolerances, the control of the base tangent length is a critical parameter specified in design handbooks, primarily governing gear accuracy. However, its direct impact on the meshing dynamics, mediated through changes in gear backlash and time-varying mesh stiffness, has not been extensively explored in literature. This article establishes a comprehensive nonlinear dynamic model for a helical gear transmission system to investigate how deviations in the base tangent length influence system characteristics such as dynamic transmission error, impact behavior, and overall vibrational response.
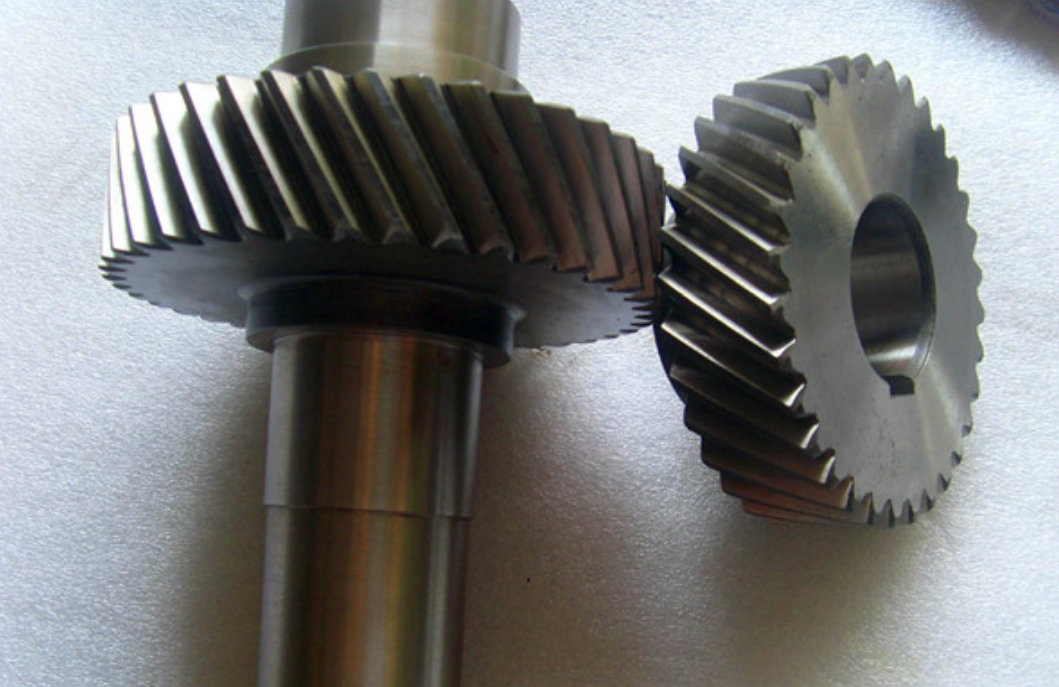
1. Modeling Gear Backlash Based on Base Tangent Length Deviation
Within the framework of gear tolerance standards, the base tangent length tolerance belongs to the first inspection group, directly reflecting the transmission accuracy of the gear. The base tangent length deviation, denoted as $f_{wn}$, is defined as the difference between the actual measured base tangent length $W_k$ and its theoretical value $W_{k}^{th}$. This deviation directly correlates with the tooth thickness deviation $E_{sns}$, a primary determinant of gear backlash $J_n$. Backlash is the clearance between non-working flanks of a meshing gear pair when the working flanks are in contact. Adequate backlash is essential to accommodate thermal expansion, manufacturing inaccuracies, and lubrication, preventing binding during operation.
The relationship between base tangent length deviation and gear backlash can be derived from international standards such as ISO/TR 10064. The fundamental formula for calculating the normal backlash $J_n$ on the pitch circle for a spur gear analogy is:
$$J_n = \left| E_{sns1} + E_{sns2} \right| / \cos(\alpha_n)$$
where $E_{sns1}$ and $E_{sns2}$ are the tooth thickness deviations of the pinion and gear, respectively, and $\alpha_n$ is the normal pressure angle. The tooth thickness deviation is related to the base tangent length deviation $E_{wns}$ and the radial runout tolerance $F_r$ by:
$$E_{wns} = E_{sns} \cos(\alpha_n) – 0.72 F_r \sin(\alpha_n)$$
Substituting and rearranging, we obtain the mathematical model linking base tangent length deviation to the system’s nominal backlash:
$$J_n = |E_{wns1} + E_{wns2}| + 0.72 (F_{r1} + F_{r2}) \sin(\alpha_n)$$
This model clearly shows that the total backlash in the system is a function of the base tangent length deviations of both meshing gears and their individual radial runout tolerances. A larger negative $E_{wns}$ (thinner tooth) contributes to a larger backlash, and vice-versa.
For the purpose of dynamic analysis, a specific helical gear pair with a contact ratio greater than 3 is considered. The main parameters are summarized in Table 1.
| Parameter | Pinion | Gear |
|---|---|---|
| Number of Teeth, $z$ | 25 | 77 |
| Normal Module, $m_n$ (mm) | 1.6933 | 1.6933 |
| Helix Angle, $\beta$ (°) | 21.25 | 21.25 |
| Normal Pressure Angle, $\alpha_n$ (°) | 18.5 | 18.5 |
| Face Width (mm) | 21 | 21 |
| Hand of Helix | Left | Right |
Assuming both gears are manufactured to a Grade 6 accuracy level, four distinct sets of base tangent length deviations are selected from the tolerance tables, representing different combinations of upper and lower deviation limits and median values. Using the derived backlash model, the corresponding nominal backlash for each set is calculated, as presented in Table 2. This table forms the basis for comparing the dynamic effects of different “tightness” levels in the helical gear mesh.
| Deviation Set | $E_{wns1}$ (Pinion, μm) | $E_{wns2}$ (Gear, μm) | Calculated Backlash $J_n$ (μm) |
|---|---|---|---|
| Set 1 | -56.14 | -57.01 | 104.72 |
| Set 2 | -64.68 | -71.69 | 127.92 |
| Set 3 | -73.73 | -86.65 | 150.92 |
| Set 4 | -81.47 | -99.70 | 172.92 |
2. Nonlinear Dynamic Modeling of the Helical Gear System Incorporating Deviation Effects
The dynamic model must account for the primary nonlinearities influenced by the base tangent length: time-varying mesh stiffness $k_m(t)$ and gear backlash $2b$ (where $b=J_n/2$ is the semi-backlash). A 12-degree-of-freedom (12-DOF) lumped parameter model is developed, considering translational vibrations in the $x$, $y$, and $z$ directions and rotational vibrations about these axes for both the pinion and the gear. The generalized coordinate vector is:
$$\boldsymbol{\delta} = [x_p, y_p, z_p, \theta_{xp}, \theta_{yp}, \theta_{zp}, x_g, y_g, z_g, \theta_{xg}, \theta_{yg}, \theta_{zg}]^T$$
The total mesh deformation along the line of action, $X_n(t)$, is the sum of the vibrational displacements of both gears projected onto the line of action, minus any static transmission error $e(t)$ which is often modeled as a harmonic excitation: $e(t)=e_0 + e_1 \sin(\omega_m t)$, where $\omega_m$ is the mesh frequency.
The mesh force $F_n$ is then expressed as a combination of a nonlinear elastic restoring force and a linear damping force:
$$F_n = k_m(t) \cdot f(X_n) + c_m \dot{X}_n$$
Here, $c_m$ is the mesh damping, and $f(X_n)$ is the backlash function, a piecewise linear function defining the contact state:
$$
f(X_n) =
\begin{cases}
X_n – b, & X_n > b \\
0, & -b \le X_n \le b \\
X_n + b, & X_n < -b
\end{cases}
$$
The time-varying mesh stiffness $k_m(t)$ is significantly affected by the base tangent length deviation. A larger negative deviation (thinner tooth) generally results in a slightly reduced mesh stiffness because the tooth is less robust, while a smaller deviation (thicker tooth) increases it. For a helical gear with a contact ratio between 3 and 4, multiple tooth pairs are in contact simultaneously. The comprehensive mesh stiffness $K_m(t)$ is obtained by summing the stiffness contributions $K_i(t)$ of each engaged tooth pair $i$, weighted by their contact line lengths $l_i(t)$:
$$K_m(t) = L(t) \left( \sum_{i=1}^{[ \varepsilon ]} K_i(t) \right) / \left( \sum_{i=1}^{[ \varepsilon ]} l_i(t) \right)$$
where $L(t)$ is the total length of contact lines and $[ \varepsilon ]$ is the integer part of the contact ratio. Finite Element Analysis (FEA) can be employed to calculate the single-tooth-pair stiffness $K_i(t)$ for different tooth thicknesses corresponding to the base tangent deviation sets. The resulting composite mesh stiffness waveforms for the four deviation sets show perceptible variations in both magnitude and shape.
Using Newton’s second law, the equations of motion for the 12-DOF system can be derived. For the pinion, the equations for translational motion are:
$$
\begin{aligned}
m_p \ddot{x}_p + c_{xp} \dot{x}_p + k_{xp} x_p &= \sum F_{px} \\
m_p \ddot{y}_p + c_{yp} \dot{y}_p + k_{yp} y_p &= \sum F_{py} \\
m_p \ddot{z}_p + c_{zp} \dot{z}_p + k_{zp} z_p &= \sum F_{pz}
\end{aligned}
$$
and for rotational motion:
$$
\begin{aligned}
I_{xp} \ddot{\theta}_{xp} + c_{\theta xp} \dot{\theta}_{xp} + k_{\theta xp} \theta_{xp} &= \sum T_{px} \\
I_{yp} \ddot{\theta}_{yp} + c_{\theta yp} \dot{\theta}_{yp} + k_{\theta yp} \theta_{yp} &= \sum T_{py} \\
I_{zp} \ddot{\theta}_{zp} &= \sum T_{pz} + T_{applied}
\end{aligned}
$$
Similar sets of equations govern the motion of the gear. The forces $F_{px}, F_{py}, …$ and torques $T_{px}, T_{py}, …$ are the projections of the total mesh force $F_n$ onto the respective coordinate directions, determined by the geometry of the helical gear contact, including the helix angle $\beta$.
3. Dynamic Response Analysis and Optimal Base Tangent Length Selection
The nonlinear differential equations are solved numerically using a variable-step Runge-Kutta method. The primary output for dynamic analysis is the dynamic transmission error (DTE) along the line of action, $X_n(t)$. To evaluate the influence of base tangent length deviation, the system’s response is analyzed across a range of dimensionless mesh frequencies $\omega$ (normalized to the system’s natural frequency). Key metrics include bifurcation diagrams, time-domain waveforms, phase portraits, Poincaré maps, frequency spectra, and the root-mean-square (RMS) and peak-to-peak (PP) values of the DTE.
3.1 Global Dynamics: Bifurcation and RMS Analysis
Bifurcation diagrams, plotting the local maxima of $X_n$ against $\omega$, reveal the global dynamic state (periodic, chaotic) for each deviation set. A common trend observed is that at low speeds ($\omega < 0.78$), all systems exhibit stable periodic-1 motion, and the influence of deviation is minimal. However, as the speed increases into a critical range ($\omega \approx 0.78-1.03$), significant differences emerge.
- Deviation Sets 1 & 2 (Smaller Backlash): These systems undergo a sudden jump into a chaotic regime at $\omega \approx 0.78$. The chaos exhibits further transitions; for Set 1, a distinct change occurs at $\omega \approx 1.03$.
- Deviation Sets 3 & 4 (Larger Backlash): While also experiencing a jump into complex dynamics, the response is generally more contained. The chaotic attractor appears less wide, suggesting a lower level of vibration severity.
This indicates that systems with tighter meshes (smaller backlash from smaller base tangent deviations) are more prone to severe nonlinear instabilities, like pronounced chaos, at high speeds.
The RMS and PP values of DTE provide a quantitative measure of vibration severity. The plots of $X_{n,RMS}$ vs. $\omega$ clearly show that in the low-speed stable region, a smaller backlash (Set 1) results in slightly lower vibration levels. However, after the jump phenomenon, the RMS values for Sets 1 and 2 escalate dramatically and become significantly higher than those for Sets 3 and 4 across much of the high-speed range. This is a critical finding: although a tight mesh seems beneficial at low speed, it can lead to excessively high vibrations at operational high speeds. The peak-to-peak value plots reinforce this conclusion, showing much larger displacement amplitudes for the smaller deviation sets in the chaotic regime.
3.2 Time-Domain and Impact Characteristics
Examining specific frequency points provides insight into the nature of the dynamic response. At $\omega = 0.782$, just after the jump, the time-domain responses differ markedly:
- Sets 1 & 2: The DTE waveform shows impacts on both sides of the backlash zone (double-sided impacting), evident from the repeated, sharp transitions in the time history and the discontinuities in the phase portrait.
- Sets 3 & 4: The DTE waveform primarily impacts on one side (single-sided impacting), leading to a somewhat smoother, though still nonlinear, response.
Double-sided impacting is generally more severe, generating higher shock loads and broader frequency content, as seen in the corresponding spectra where higher harmonics are more excited. At a higher frequency, $\omega = 0.91$, this pattern holds. The spectra confirm that while Set 1 might have the smallest fundamental harmonic amplitude in some cases, Sets 3 and 4 consistently show a significant reduction in the overall vibrational energy, particularly in the higher harmonics associated with impacts.
3.3 Procedure for Optimal Deviation Selection
Based on the analysis, a systematic procedure for selecting the optimal base tangent length deviation for a helical gear pair can be proposed, moving beyond handbook selection:
- Define Operating Range: Identify the primary operational mesh frequency range for the gear system.
- Establish Model: Develop the nonlinear dynamic model for the specific helical gear pair, incorporating the relationship between base tangent deviation, backlash, and mesh stiffness.
- Calculate Responses: For a series of candidate deviation sets (e.g., representing minimum, maximum, and intermediate tolerances for the desired accuracy grade), compute the dynamic response over the operating speed range.
- Evaluate Metrics: Compare key dynamic metrics: bifurcation behavior (avoiding severe chaos), RMS/PP of DTE (minimizing vibration level), and impact characteristics (preferring single-sided over double-sided impacting).
- Select Optimal Set: Choose the deviation set that offers the best compromise—stable, low-vibration operation across the intended speed range, even if it requires a slightly larger nominal backlash than the traditional minimum.
For the case study presented, applying this procedure leads to a clear conclusion. While Set 1 offers the lowest DTE at very low speeds, its behavior at operational high speeds is unacceptable due to severe chaos and high RMS levels. Set 2 also exhibits strong nonlinearities. Sets 3 and 4 provide much better high-speed stability. Between them, Set 3 (with a backlash of ~151 μm) is identified as the optimal choice. It provides a significant improvement in high-speed stability over the tighter sets while maintaining a lower vibration level than Set 4 in the critical transition regions, offering the best overall dynamic performance for this particular helical gear system.
4. Conclusion
The investigation into the effects of base tangent length deviation on the dynamics of a helical gear system yields several important conclusions:
- The base tangent length deviation, by governing gear backlash and influencing mesh stiffness, is a significant design parameter affecting the nonlinear dynamics of helical gear systems. Its influence is minimal at low speeds but becomes profound at high rotational speeds.
- Smaller deviations (leading to smaller backlash) tend to push the system into more severe nonlinear regimes, such as pronounced chaotic motion with double-sided impacts, resulting in higher dynamic transmission error and vibration levels at high speeds.
- Conversely, appropriately increasing the base tangent deviation (accepting a larger designed backlash) can effectively mitigate severe nonlinear responses. It can transition the system’s impact character from harsh double-sided impacts to relatively smoother single-sided impacts, thereby reducing vibrational severity.
- A dynamics-based evaluation methodology is essential for optimal selection. The traditional approach of selecting the minimum permissible backlash from handbooks may lead to suboptimal dynamic performance. The proposed procedure, which analyzes bifurcation behavior, RMS/PP values of DTE, and impact nature, provides a rational foundation for choosing the base tangent length deviation that ensures robust, low-vibration operation across the gear’s intended speed range.
- For the specific helical gear case analyzed, the deviation set corresponding to an intermediate backlash value (Set 3) delivered the best overall dynamic characteristics, balancing stability and vibration amplitude. This finding underscores the value of integrating dynamic performance assessment into the gear tolerance design process for high-performance applications.