
In modern manufacturing, thermal errors significantly impact the precision of machine tools, accounting for 40% to 70% of total machining errors. For CNC gear hobbing machines, which are critical for producing high-precision gears, thermal deformation during gear hobbing processes can lead to substantial deviations in gear geometry, affecting performance and longevity. To address this, we developed a comprehensive thermal error modeling approach that integrates finite element analysis and Bayesian network theory. This study aims to reduce the influence of thermal errors on CNC gear hobbing accuracy by simulating temperature rise and displacement, optimizing temperature variables, and constructing a predictive model. Our methodology involves analyzing heat sources, performing thermal-structural simulations, and employing fuzzy clustering and Bayesian networks for model development. Through experimental validation, we demonstrate the effectiveness of our model in predicting thermal errors, providing a foundation for compensation strategies in gear hobbing applications.
The CNC gear hobbing machine under investigation consists of several key components: a column, a direct-drive hob spindle system, a worktable, a feed system, and a bed. The machine’s structure is designed for precision gear hobbing, where the hob rotates and engages with the workpiece to generate gear teeth. We created a simplified 3D model focusing on the hob headstock, as it is the primary area affected by thermal loads during gear hobbing. The model includes the hob spindle, bearings, motor, and supporting structures, enabling detailed analysis of heat generation and dissipation. Understanding the machine’s configuration is essential for accurate thermal modeling, as heat sources are concentrated in the hob area during gear hobbing operations.
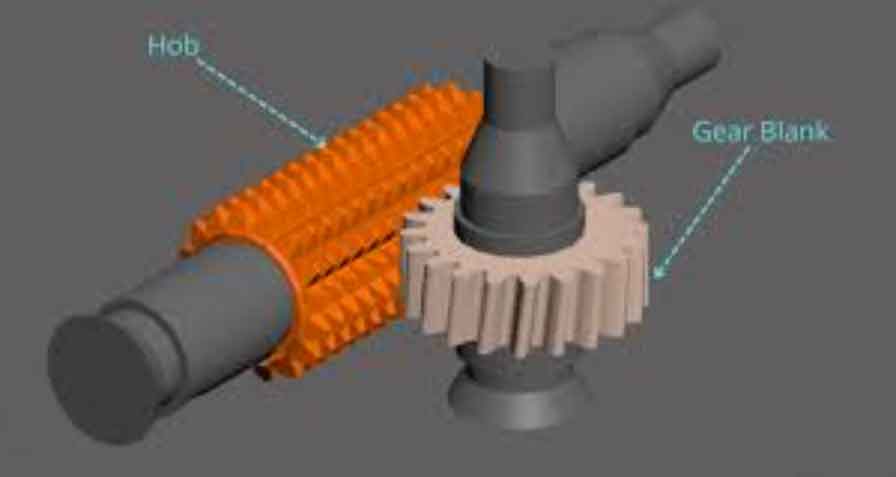
Thermal sources in the CNC gear hobbing machine primarily arise from the gear hobbing process itself, including cutting heat, motor发热, and bearing friction. During gear hobbing, the hob engages with the workpiece, generating substantial heat due to plastic deformation and friction. We calculate the cutting heat using the formula for heat power: $$Q = P \nu$$ where \(Q\) is the thermal power, \(P\) is the cutting force, and \(\nu\) is the spindle speed. The cutting force is derived from the maximum torque experienced by the hob during gear hobbing: $$M_{\text{max}} = 9.1 m^{1.75} S^{0.65} T^{0.81} \nu_0^{-0.26} z^{0.27} K_{\text{material}} K_{\text{hardness}} K_{\text{helix}}$$ and $$P = 2 M_{\text{max}} / d$$ Here, \(m\) is the normal module, \(S\) is the axial feed rate, \(T\) is the depth of cut, \(\nu_0\) is the spindle speed, \(z\) is the number of gear teeth, and \(K\) coefficients account for material, hardness, and helix angle adjustments in gear hobbing. Only a fraction of this heat, approximately 5%, transfers to the hob, with the rest carried away by chips.
Bearing heat is another critical source, especially from sliding and rolling bearings in the hob spindle system. For sliding bearings, the frictional heat is computed as: $$Q_1 = f p v$$ where \(f\) is the friction coefficient, \(p\) is the bearing load, and \(v\) is the journal circumferential speed. For rolling bearings, such as thrust ball bearings used in the machine, the heat generation power is: $$q = 1.047 \times 10^{-4} M \cdot n$$ with the frictional moment \(M\) given by: $$M = M_0 + M_1$$ where \(M_0\) is the load-dependent moment and \(M_1\) is the viscous moment. These are calculated as: $$M_0 = \begin{cases} 10^{-7} \cdot f_0 \cdot (\nu n)^{2/3} \cdot d_m^3, & \nu n \geq 2000 \\ 160 \times 10^{-7} \cdot f_0 \cdot d_m^3, & \nu n < 2000 \end{cases}$$ and $$M_1 = f_1 p_1 d_m$$ In these equations, \(f_0\) and \(f_1\) are constants related to bearing type and lubrication, \(\nu\) is the kinematic viscosity, \(p_1\) is the load for moment calculation, and \(d_m\) is the bearing pitch diameter.
The direct-drive motor of the hob spindle also contributes to heat generation, primarily from copper losses and core losses. The heat from the motor is expressed as: $$Q_d = P_1 (1 – \eta)$$ where \(P_1\) is the input power and \(\eta\) is the motor efficiency. This heat dissipates through conduction and convection, affecting the surrounding components during extended gear hobbing operations.
Boundary conditions for heat transfer include forced convection from air and coolant during gear hobbing. For the hob spindle and motor rotor, the forced convection coefficient is determined by: $$\alpha = \frac{N_u \lambda}{d_s}$$ with the Nusselt number \(N_u\) calculated as: $$N_u = 0.133 R_e^{2/3} P_r^{1/3}$$ and the Reynolds number \(R_e\) given by: $$R_e = \frac{\omega d_s^2}{\nu_f}$$ Here, \(\alpha\) is the convection coefficient, \(\lambda\) is the fluid thermal conductivity, \(d_s\) is the equivalent diameter of the spindle, \(\omega\) is the angular speed, and \(\nu_f\) is the fluid kinematic viscosity. For motor cooling via water circulation, the convection coefficient inside pipes is: $$h_1 = 0.023 R_e^{0.8} P_r^{0.4} \lambda / D$$ where \(D\) is the characteristic diameter and \(u\) is the fluid velocity. These parameters are crucial for simulating heat dissipation in the gear hobbing environment.
To summarize the material properties and thermal parameters, we present the following tables. Table 1 lists the material properties of key components in the CNC gear hobbing machine, which are essential for finite element analysis.
| Component | Material | Density (kg/m³) | Elastic Modulus (Pa) | Poisson’s Ratio | Specific Heat (J/(kg·K)) | Thermal Conductivity (W/(m·K)) | Thermal Expansion Coefficient (1/K) |
|---|---|---|---|---|---|---|---|
| Hob Spindle | 40Cr | 7870 | 2.11E+11 | 0.269 | 460 | 44 | 1.20E-05 |
| Motor Shaft | 45 Steel | 7890 | 2.10E+11 | 0.278 | 450 | 48 | 1.17E-05 |
| Bed and Frame | HT200 | 7200 | 1.48E+11 | 0.31 | 510 | 45 | 1.10E-05 |
| Sliding Bearing | CuAl10Fe3 | 7400 | 1.10E+11 | 0.3 | 380 | 56 | 1.70E-05 |
| Rolling Bearing | GCr15 | 7830 | 2.19E+11 | 0.3 | 460 | 81 | 1.25E-05 |
| Hob Tool | W18Cr4V | 8260 | 2.25E+11 | 0.25 | 420 | 27.2 | 1.21E-05 |
Table 2 provides the heat source intensities calculated for various components during gear hobbing, based on the operating conditions.
| Heat Source | Intensity (W) |
|---|---|
| Hob Cutting Heat | 238.5 |
| Tailstock Bearing Heat | 46.5 |
| Motor Heat | 502 |
| Sliding Bearing II Heat | 40.6 |
| Rolling Bearing Heat | 1.6 |
Table 3 shows the convection coefficients for different parts of the machine, which are used in thermal simulations.
| Surface | Convection Coefficient (W/(m²·K)) |
|---|---|
| Hob with Coolant | 2943 |
| Motor Water Cooling | 2752 |
| Hob Spindle Air | 12.8 |
| Motor Rotor Air | 12 |
We performed thermal-structural simulations using finite element software to analyze the temperature distribution and thermal displacement of the CNC gear hobbing machine. The model was meshed with tetrahedral elements, focusing on refining the hob spindle area to ensure accuracy. The mesh consisted of 397,046 elements and 632,875 nodes, as shown in the grid划分. Steady-state thermal analysis was conducted with an ambient temperature of 20°C, applying the calculated heat powers and convection coefficients. The results revealed that the motor rotor reached a temperature of 41.6°C due to residual heat despite water cooling, while the tailstock bearing warmed to 33°C. The hob, cooled by cutting fluid, exhibited minimal temperature rise. The thermal displacement distribution followed similar trends, with maximum deformation occurring at the motor rotor (approximately 92 μm) and the hob spindle showing smaller displacements (around 35 μm). Notably, the hob spindle displacement was primarily in the X and Y directions, with negligible Z-direction movement, which is critical for gear hobbing accuracy.
Transient simulations were also carried out to observe the evolution of temperature and displacement over time. We extracted temperature data from seven key locations (T1 to T7) and the hob spindle thermal displacement. The temperature curves showed a continuous rise, with the hob spindle displacement increasing correspondingly. These transient results align with steady-state findings, confirming that thermal effects accumulate during prolonged gear hobbing operations. The displacement curves emphasized the dominance of X and Y directional errors, which directly impact gear tooth geometry in gear hobbing.
To optimize temperature variables for modeling, we applied fuzzy clustering to the simulation data. Initially, seven temperature points were selected based on their influence on thermal error. We computed the similarity matrix using Pearson correlation coefficients: $$r_{xy} = \frac{\sum (x_i – \bar{x})(y_i – \bar{y})}{\sqrt{\sum (x_i – \bar{x})^2 \sum (y_i – \bar{y})^2}}$$ where \(x\) and \(y\) are temperature variables. The fuzzy equivalence matrix was obtained by iteratively平方 the similarity matrix until convergence, resulting in a传递闭包. By setting a threshold \(\lambda = 0.998\), we classified the temperature points into four clusters. This process reduced coupling among variables, simplifying the model. We then evaluated the correlation between each temperature variable and the hob spindle displacement, selecting the most influential points as thermal key points. Table 4 summarizes the classification and correlation results.
| Temperature Variable | Cluster | Correlation with Displacement |
|---|---|---|
| T1 / T2 | Cluster 1 | 0.943 / 0.941 |
| T3 / T4 | Cluster 2 | 0.982 / 0.990 |
| T5 / T6 | Cluster 3 | 0.995 / 0.989 |
| T7 | Cluster 4 | 0.924 |
Based on correlation strength, we identified the hob headstock, tailstock bearing, and sliding bearing II as thermal key points, reducing the number of sensors needed for experimental data collection. This optimization is vital for practical implementation in gear hobbing machines.
We constructed a Bayesian network model to predict thermal errors in the CNC gear hobbing machine. A Bayesian network represents probabilistic relationships among variables through a directed acyclic graph. For our study, the network nodes include the three thermal key points (temperature variables) and the hob spindle thermal error. Assuming independence among temperature nodes, the network structure links each temperature node to the error node. The joint probability distribution is given by: $$P(X_1, X_2, \dots, X_n) = \prod_{i=1}^n P(X_i | \text{Parents}(X_i))$$ where \(X_i\) are the nodes. Our modeling process involved three steps: prior network construction, network learning from sample data, and Bayesian inference for error prediction. We discretized the experimental data into state domains. For example, the temperature change \(\Delta T_1\) and error change \(\Delta E\) were divided into 10 intervals each, as shown in Table 5 for \(\Delta T_1\).
| State | Interval for \(\Delta T_1\) (°C) |
|---|---|
| 1 | [0, 0.04] |
| 2 | [0.04, 0.08] |
| 3 | [0.08, 0.12] |
| 4 | [0.12, 0.16] |
| 5 | [0.16, 0.20] |
| 6 | [0.20, 0.24] |
| 7 | [0.24, 0.28] |
| 8 | [0.28, 0.32] |
| 9 | [0.32, 0.36] |
| 10 | [0.36, 0.40] |
Similarly, Table 6 shows the state domains for \(\Delta E\).
| State | Interval for \(\Delta E\) (μm) |
|---|---|
| 1 | [-1.1, -0.79] |
| 2 | [-0.79, -0.48] |
| 3 | [-0.48, -0.17] |
| 4 | [-0.17, 0.14] |
| 5 | [0.14, 0.45] |
| 6 | [0.45, 0.76] |
| 7 | [0.76, 1.07] |
| 8 | [1.07, 1.38] |
| 9 | [1.38, 1.69] |
| 10 | [1.69, 2.0] |
We computed independent distribution probabilities and conditional probabilities from the data. For instance, the conditional probability \(P(\Delta T_1 | \Delta E)\) was derived, enabling inference. During prediction, for each data group \(k\), we determined the state of \(\Delta E_k\) that maximized the conditional probability given the states of \(\Delta T_1\), \(\Delta T_4\), and \(\Delta T_5\): $$\text{argmax}_j P_k(\Delta E_j | \Delta T_{1m}, \Delta T_{4n}, \Delta T_{5p})$$ where \(j, m, n, p\) are state indices. The predicted error change \(\Delta E_k\) was taken as the midpoint of the corresponding state interval, and the cumulative error was updated as: $$E_{k+1} = E_k + \Delta E_k$$ This approach allowed us to build a dynamic model for thermal error prediction in gear hobbing.
To validate the model, we conducted experiments on the CNC gear hobbing machine under no-load conditions. The hob spindle speed was set to 160 rpm, with an ambient temperature of 20°C. We used DS18B20 temperature sensors to monitor the thermal key points and a displacement sensor to measure the hob spindle error in the X-direction. The temperature data from the hob headstock, tailstock bearing, and sliding bearing II were recorded over time, as shown in the temperature curves. These data were input into the Bayesian network model to predict thermal errors. Comparing the predicted values with experimental measurements, we found that the model closely tracked the actual error趋势, with a maximum residual of 3.5 μm over a 7-hour period. This demonstrates the model’s accuracy in predicting thermal errors during gear hobbing operations.
The results indicate that our integrated approach effectively captures thermal behavior in CNC gear hobbing machines. The finite element simulation provided insights into temperature distribution and displacement, while fuzzy clustering optimized temperature variables, reducing sensor count. The Bayesian network model offered a probabilistic framework for error prediction, accommodating uncertainties in gear hobbing processes. The small residual error confirms the model’s reliability, making it suitable for real-time compensation systems. Future work could involve applying the model to different gear hobbing scenarios or integrating it with machine control systems for adaptive compensation.
In conclusion, we developed a thermal error modeling methodology for CNC gear hobbing machines by combining finite element analysis and Bayesian networks. Our study highlights the importance of thermal management in gear hobbing accuracy and provides a practical solution for error prediction. The model reduces the need for extensive temperature monitoring and offers high prediction精度, contributing to improved gear manufacturing quality. As gear hobbing continues to evolve towards higher precision, such thermal error compensation strategies will become increasingly vital in industrial applications.
Throughout this research, we emphasized the role of gear hobbing in generating thermal loads and the need for accurate modeling. By leveraging simulation and data-driven techniques, we have advanced the understanding of thermal effects in gear hobbing machines, paving the way for enhanced performance and reliability in gear production.