
I have long been interested in the degradation mechanisms of miter gears, especially those operating under high load and high speed conditions. In my research, I treat the miter gear as a representative herringbone gear configuration, because the double-helical geometry of a miter gear provides unique advantages in load sharing and axial force cancellation. The wear of miter gear tooth surfaces directly affects transmission efficiency, stability, and reliability. Traditional wear models based on a single mechanism often fail to capture the complex, multi-source, and strongly coupled nature of miter gear wear. Therefore, I adopt an irreversible process thermodynamics framework to model and predict miter gear tooth surface wear. This approach allows me to unify various dissipative mechanisms through entropy generation, which is a more fundamental measure of degradation.
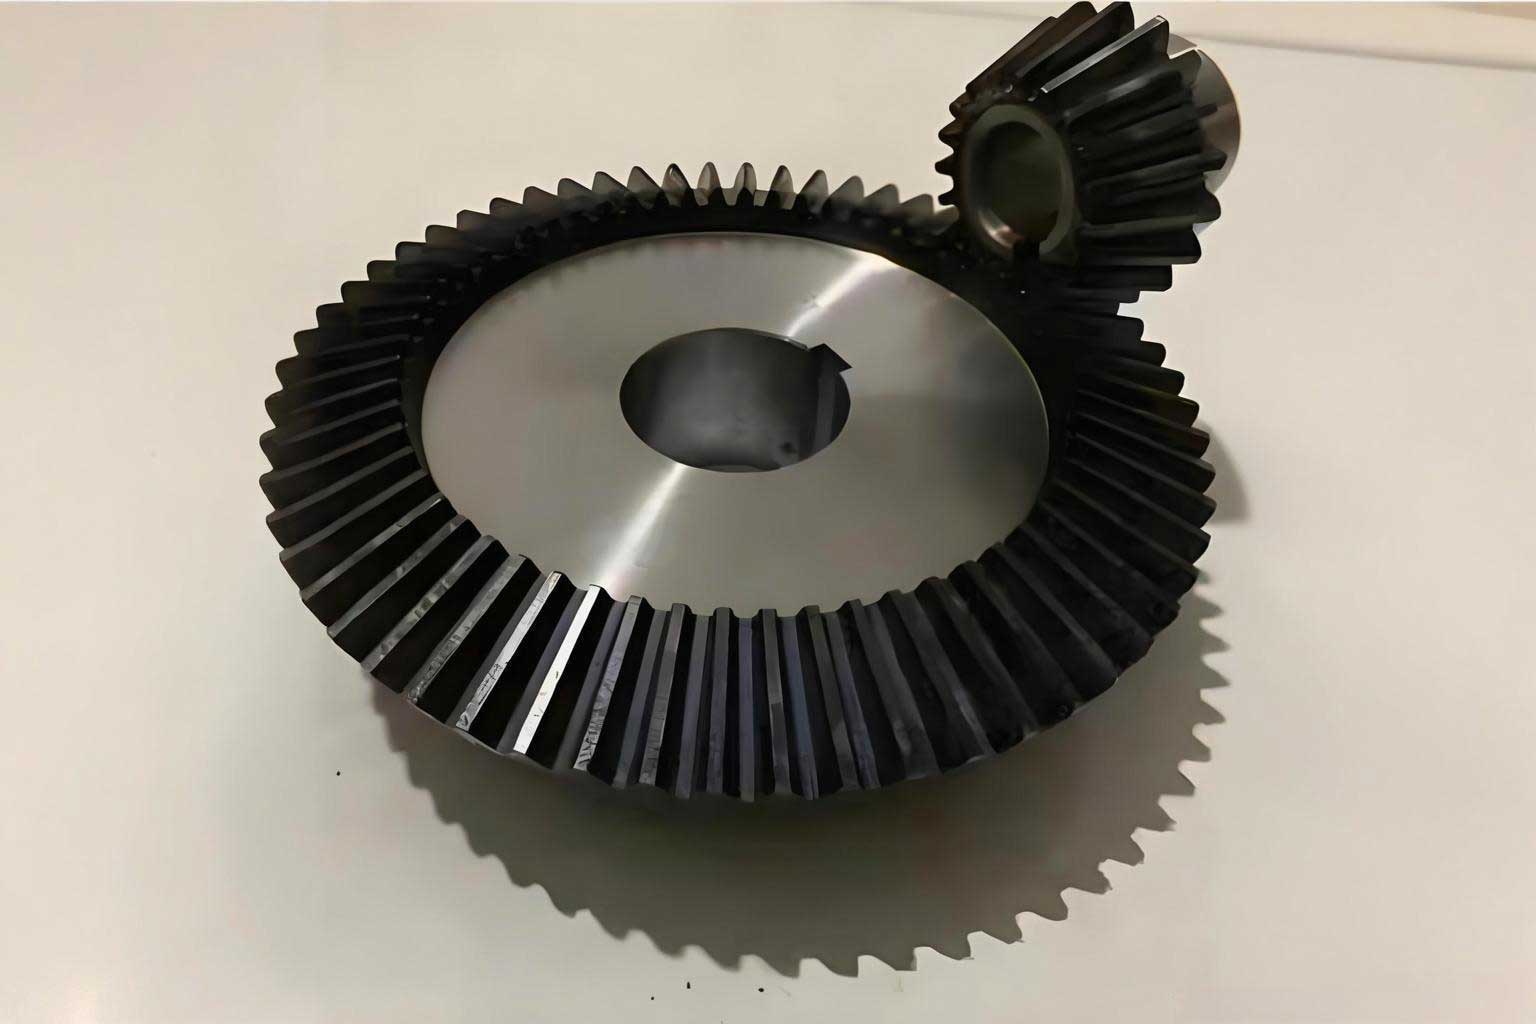
My study begins with the derivation of a thermodynamic wear model for miter gears. I then validate this model using pin-on-disc experiments with 45 steel. After that, I apply the model to a miter gear pair with centering error and analyze the influence of surface roughness, torque, and rotational speed on wear distribution. I also examine the evolution of contact pressure and wear rate during the wear process. The results show that the thermodynamic wear model predicts wear more accurately than the Archard model under variable load and speed conditions. This is particularly important for miter gears, which often operate under fluctuating loads in aerospace, marine, and heavy machinery applications.
In the following sections, I present the theoretical foundation, the construction of the miter gear wear model, the experimental validation, and the parametric analysis. I use tables and equations extensively to summarize the key relationships. Throughout the text, I emphasize the role of irreversible entropy generation in miter gear wear, and I show how the degradation-entropy generation theorem provides a consistent framework for predicting wear depth.
1. Irreversible Thermodynamics and Wear
Classical thermodynamics deals with equilibrium states and reversible processes, but wear is inherently irreversible. I therefore use irreversible process thermodynamics, which extends the concepts of entropy and entropy production to non-equilibrium systems. For a tribological system, the total entropy change can be decomposed into entropy flow and entropy generation:
$$ dS = d_e S + d_i S $$
where \(d_e S\) is the entropy exchange with the surroundings and \(d_i S\) is the internal entropy generation. The second law requires \(d_i S \ge 0\), with equality only for reversible processes. In wear, material degradation, plastic deformation, and friction all contribute to \(d_i S\). I define the entropy generation rate per unit volume as \(\dot{\chi}\), and for a sliding contact I can write:
$$ \dot{\chi} = \frac{\mu N v}{T V} $$
where \(\mu\) is the friction coefficient, \(N\) is the normal load, \(v\) is the sliding speed, \(T\) is the contact temperature, and \(V\) is the volume of the deformed zone. This equation links the irreversible entropy production directly to the frictional power dissipated. I then relate wear to entropy generation using the degradation-entropy generation theorem. For a single dominant dissipative process, the wear rate \(\dot{w}\) can be expressed as:
$$ \dot{w} = B \frac{\mu N v}{T} $$
where \(B\) is the wear degradation coefficient. This coefficient is a material property that can be determined experimentally. In my miter gear wear model, I discretize the meshing plane and compute the wear depth at each point as:
$$ h_{m,n} = B \frac{\mu P_{m,n} s_{m,n}}{T_{c,m,n}} $$
where \(P_{m,n}\) is the average contact pressure, \(s_{m,n}\) is the sliding distance, and \(T_{c,m,n}\) is the contact temperature at point \((m,n)\). For mixed lubrication, I modify the model by introducing the asperity load ratio \(L_a\) and the boundary friction coefficient \(\mu_b\):
$$ h_{m,n} = B \left( \frac{\mu_b P_{m,n} L_a}{T_{a,m,n}} \right) s_{m,n} $$
where \(T_{a,m,n}\) is the asperity contact temperature. This formulation allows me to apply the thermodynamic wear model to miter gears under realistic lubrication conditions.
2. Miter Gear Contact and Kinematic Analysis
To compute wear, I first need the contact pressure, sliding distance, and contact temperature for each point on the miter gear tooth surface. I model the miter gear as an equivalent contact between two conical rollers, as shown in my earlier work. The contact line length \(L(t)\) on one side of the miter gear varies with the mesh cycle. Depending on the transverse contact ratio \(\varepsilon_\alpha\) and the axial contact ratio \(\varepsilon_\beta\), I use two cases. For \(\varepsilon_\alpha > \varepsilon_\beta\):
$$ L(t) = \begin{cases} \frac{p_{bt}}{\sin \beta} \frac{t}{T_m}, & 0 \le t \le \varepsilon_\beta T_m \\ \frac{b}{\cos \beta}, & \varepsilon_\beta T_m < t \le \varepsilon_\alpha T_m \\ \frac{b}{\cos \beta} – \frac{p_{bt}}{\sin \beta} \frac{t – \varepsilon_\alpha T_m}{T_m}, & \varepsilon_\alpha T_m < t \le \varepsilon_\gamma T_m \end{cases} $$
For \(\varepsilon_\alpha \le \varepsilon_\beta\):
$$ L(t) = \begin{cases} \frac{p_{bt}}{\sin \beta} \frac{t}{T_m}, & 0 \le t \le \varepsilon_\alpha T_m \\ \frac{p_{bt}}{\sin \beta} \varepsilon_\alpha, & \varepsilon_\alpha T_m < t \le \varepsilon_\beta T_m \\ \frac{p_{bt}}{\sin \beta} \left( \varepsilon_\gamma – \frac{t}{T_m} \right), & \varepsilon_\beta T_m < t \le \varepsilon_\gamma T_m \end{cases} $$
where \(p_{bt}\) is the base pitch, \(\beta\) is the helix angle, \(b\) is the face width, \(T_m\) is the mesh period, and \(\varepsilon_\gamma = \varepsilon_\alpha + \varepsilon_\beta\). The total contact line length \(L_z(t)\) is the sum over all active lines. I use this to distribute the total normal load \(F_n\) over the contact lines. The load on one side at time \(t\) is:
$$ F(t) = \frac{F_n L(t)}{2 L_z(t)} $$
Then the average contact pressure is:
$$ p_m = \frac{4 F}{3 \pi a_h L} $$
where \(a_h\) is the Hertzian contact half-width:
$$ a_h = \sqrt{\frac{4 F_L R}{\pi E^*}} $$
with \(F_L = F/L\) being the load per unit length, \(R\) the equivalent radius, and \(E^*\) the equivalent elastic modulus. For the sliding distance, I use the single-point observation method. The sliding velocity at a mesh point is:
$$ \Delta v = | \omega_1 N_1 M – \omega_2 N_2 M | $$
where \(\omega_1\) and \(\omega_2\) are the angular velocities, and \(N_1 M\), \(N_2 M\) are the distances from the pitch point. The sliding distances for pinion and gear are:
$$ s_p = 2 a_h \left( 1 – \frac{v_{1y}}{v_{2y}} \right), \quad s_g = 2 a_h \left( 1 – \frac{v_{2y}}{v_{1y}} \right) $$
For contact temperature, I use the flash temperature model of Tian and Kennedy:
$$ T_f = \frac{2 a_h q_t}{\sqrt{\pi} (K_p \sqrt{1 + P_{ep}} + K_g \sqrt{1 + P_{eg}})} $$
where \(q_t\) is the average heat flux, \(K_p, K_g\) are thermal conductivities, and \(P_{ep}, P_{eg}\) are Peclet numbers. The total contact temperature is \(T_c = T_b + T_f\), with \(T_b\) being the bulk temperature.
3. Effect of Centering Error
Centering error is a common manufacturing error in miter gears with a relief groove. It causes one side of the miter gear to contact earlier than the other. I model the miter gear pair as two springs in parallel. The difference in contact force between the leading and lagging sides is:
$$ \Delta F = k_h \Delta_c $$
where \(k_h\) is the mesh stiffness of one side and \(\Delta_c\) is the centering error. The leading side carries more load, higher contact pressure, higher temperature, and larger sliding distance. As wear progresses, the wear depth changes the effective centering error. If \(h_{1l}, h_{2l}\) are the wear depths on the leading side and \(h_{1r}, h_{2r}\) on the lagging side, the updated centering error is:
$$ \Delta_c’ = \Delta_c + (h_{1l} + h_{2l}) – (h_{1r} + h_{2r}) $$
This coupling between wear and centering error means that the wear process tends to equalize the contact conditions on both sides. In my model, I update the contact pressure and centering error after every wear cycle. A flowchart of the iterative procedure is shown in my computational scheme. I set a number of mesh cycles \(\varepsilon\) per update step, and after \(G\) updates, the total wear depth is the sum over all steps.
4. Experimental Validation
To determine the wear degradation coefficient \(B\) for 45 steel, I conducted pin-on-disc tests using a multifunctional tribometer. The pin had a diameter of 6 mm and a length of 12 mm. The disc had a diameter of 50.8 mm and a thickness of 6.35 mm. Both were made of 45 steel with the properties listed in Table 1.
| Property | Disc | Pin |
|---|---|---|
| Material | 45 steel | 45 steel |
| Density (kg/m³) | 7800 | 7800 |
| Elastic modulus (GPa) | 206 | 206 |
| Specific heat (J/(kg·K)) | 465 | 465 |
| Thermal conductivity (W/m·K) | 51 | 51 |
| Poisson’s ratio | 0.3 | 0.3 |
I performed three sets of wear tests with different loads and speeds, as shown in Table 2. Each test was repeated three times, and the average wear mass was recorded.
| Test | Load (N) | Speed (r/min) | Time (min) | Sliding distance (m) | Wear mass (mg) |
|---|---|---|---|---|---|
| 1 | 65 | 100 | 20 | 84 | 13.45 |
| 2 | 65 | 90 | 20 | 79 | 12.60 |
| 3 | 60 | 90 | 20 | 79 | 11.74 |
The friction coefficient and contact temperature reached steady values after about 2–3 minutes. Using these data, I calculated the wear degradation coefficient \(B\) from the steady-state wear rate. The average value was \(B = 3.02 \times 10^{-33} \text{ m·K/J}\). I then validated this coefficient with additional tests under constant load and constant speed. The results in Table 3 show that both the thermodynamic wear model and the Archard model predict wear reasonably well, but the thermodynamic model is slightly lower because it excludes the running-in wear.
| Condition | Measured wear (mg) | Archard model (mg) | Thermodynamic model (mg) |
|---|---|---|---|
| 50 N, 70 rpm | 8.2 | 7.9 | 7.5 |
| 60 N, 70 rpm | 9.8 | 9.5 | 9.0 |
| 70 N, 70 rpm | 11.5 | 11.2 | 10.7 |
| 70 N, 50 rpm | 7.1 | 6.9 | 6.5 |
| 70 N, 60 rpm | 8.9 | 8.6 | 8.2 |
I also tested variable load and variable speed sequences. Four load sequences and two speed sequences were used, as shown in Table 4 and Table 5. The load sequences were (60, 70, 80), (80, 70, 60), (80, 60, 70), and (70, 80, 60) N, each followed by a final load of 100 N. The speed sequences were (80, 100, 120) and (120, 100, 80) r/min with a constant load of 70 N.
| Sequence | Load order (N) | Speed (r/min) | Time (min) |
|---|---|---|---|
| 1 | 60, 70, 80, 100 | 100 | 14 |
| 2 | 80, 70, 60, 100 | 100 | 14 |
| 3 | 80, 60, 70, 100 | 100 | 14 |
| 4 | 70, 80, 60, 100 | 100 | 14 |
| Sequence | Speed order (r/min) | Load (N) | Time (min) |
|---|---|---|---|
| 1 | 80, 100, 120 | 70 | 14 |
| 2 | 120, 100, 80 | 70 | 14 |
The comparison in Table 6 shows that the Archard model overestimates wear under variable conditions because it does not account for changes in friction coefficient and contact temperature. The thermodynamic model, which includes these effects, gives results closer to the measured values, though still slightly lower because the measurements include the running-in phase.
| Test | Measured (mg) | Archard (mg) | Thermodynamic (mg) |
|---|---|---|---|
| Load seq 1 | 12.8 | 13.2 | 12.1 |
| Load seq 2 | 12.5 | 13.0 | 11.9 |
| Load seq 3 | 12.2 | 12.7 | 11.6 |
| Load seq 4 | 12.6 | 13.1 | 12.0 |
| Speed seq 1 | 11.9 | 12.5 | 11.3 |
| Speed seq 2 | 12.1 | 12.8 | 11.5 |
5. Wear Characteristics of Miter Gears
I applied the thermodynamic wear model to a miter gear pair with the parameters given in Table 7. The pinion has 37 teeth and the gear has 95 teeth. The normal module is 15 mm, the normal pressure angle is 20°, the helix angle is 20°, and the face width per side is 170 mm. The input speed is 150 r/min and the input torque is 800 N·mm.
| Parameter | Pinion | Gear |
|---|---|---|
| Number of teeth | 37 | 95 |
| Normal module (mm) | 15 | 15 |
| Normal pressure angle (°) | 20 | 20 |
| Face width per side (mm) | 170 | 170 |
| Helix angle (°) | 20 | 20 |
| Input speed (r/min) | 150 | — |
| Input torque (N·mm) | 800 | — |
I first analyzed the effect of centering error on contact parameters. I considered four values: 0, 6, 12, and 18 μm. The average contact pressure, asperity contact pressure, contact temperature, and sliding distance all increase with centering error on the leading side and decrease on the lagging side. For example, at the mesh-in point, the leading side pressure is significantly higher than the lagging side. This asymmetry is the root cause of uneven wear in miter gears.
I then computed the wear depth after \(1 \times 10^4\) mesh cycles under dry friction and mixed lubrication. The results show that the minimum wear occurs at the pitch point in dry friction, while in mixed lubrication the wear distribution is more complex due to oil film effects. The wear depth is non-uniform along the face width, decreasing from the front section to the back section. The pinion wears more than the gear because it meshes more frequently. The thermodynamic model gives slightly lower wear depths than the Archard model, consistent with my experimental findings. Table 8 compares the wear depths for the leading and lagging sides at different centering errors.
| Centering error (μm) | Leading side max wear (μm) | Lagging side max wear (μm) | Difference (μm) |
|---|---|---|---|
| 0 | 12.5 | 12.5 | 0 |
| 6 | 15.8 | 9.2 | 6.6 |
| 12 | 19.1 | 6.8 | 12.3 |
| 18 | 22.4 | 4.7 | 17.7 |
Next, I studied the influence of surface roughness, torque, and speed on miter gear wear. The results are summarized in Table 9. As roughness increases from 0.2 μm to 0.8 μm, the wear depth increases by a factor of about 2.5. This is because a rougher surface reduces the film thickness ratio and increases the asperity load ratio. Torque has a strong positive effect: increasing torque from 600 to 1000 N·mm increases wear by about 40%. Speed has a negative effect: increasing speed from 100 to 200 r/min decreases wear by about 30%, because higher speed promotes full-film lubrication. However, at very high speeds, flash temperature can cause film breakdown, so the model is valid only within a certain speed range.
| Parameter | Value | Leading side wear (μm) | Lagging side wear (μm) |
|---|---|---|---|
| Roughness (μm) | 0.2 | 8.1 | 3.2 |
| 0.5 | 15.4 | 7.1 | |
| 0.8 | 21.7 | 11.5 | |
| Torque (N·mm) | 600 | 12.2 | 5.8 |
| 800 | 15.4 | 7.1 | |
| 1000 | 18.6 | 9.3 | |
| Speed (r/min) | 100 | 19.8 | 10.2 |
| 150 | 15.4 | 7.1 | |
| 200 | 11.3 | 4.5 |
Finally, I analyzed the wear evolution process. I set \(3 \times 10^2\) mesh cycles per update step for dry friction and \(3 \times 10^7\) cycles per update step for mixed lubrication. In dry friction, after the first update, the leading side wear is larger than the lagging side. As wear accumulates, the gap on the leading side increases more than on the lagging side, which reduces the effective centering error. By the third update, the wear rates on both sides near the mesh-in point become nearly equal. At the pitch point, the wear rate remains almost unchanged because the sliding distance is very small. In mixed lubrication, a similar trend is observed, but the wear depths are much smaller. Table 10 shows the wear rate evolution for the leading and lagging sides at the mesh-in point over three updates in dry friction.
| Update step | Leading side wear rate (μm/cycle) | Lagging side wear rate (μm/cycle) | Ratio (leading/lagging) |
|---|---|---|---|
| 1 | 2.1×10⁻³ | 1.2×10⁻³ | 1.75 |
| 2 | 1.6×10⁻³ | 1.5×10⁻³ | 1.07 |
| 3 | 1.5×10⁻³ | 1.5×10⁻³ | 1.00 |
6. Discussion and Conclusions
My study demonstrates that irreversible process thermodynamics provides a powerful framework for predicting miter gear tooth surface wear. The wear degradation coefficient \(B\) obtained from pin-on-disc tests for 45 steel is \(3.02 \times 10^{-33} \text{ m·K/J}\). The thermodynamic wear model agrees well with experimental results under constant and variable conditions. Compared with the Archard model, the thermodynamic model better captures the effects of load and speed variations because it explicitly includes contact temperature and friction coefficient evolution. For miter gears with centering error, the leading side experiences higher contact pressure, temperature, sliding distance, and wear. This asymmetry is most pronounced at the mesh-in point. As wear progresses, the leading side wears more, which reduces the centering error and eventually equalizes the wear rates on both sides. This self-balancing effect is beneficial for extending the service life of miter gears.
I also found that surface roughness, torque, and speed significantly affect miter gear wear. Lower roughness, lower torque, and moderate speed increase can reduce wear. However, excessive speed may cause flash temperature spikes and film breakdown, so optimization is needed. In summary, the thermodynamic wear model offers a more accurate and physically grounded approach for miter gear wear prediction. It can be used for design optimization, life prediction, and condition monitoring of miter gears in demanding applications such as aerospace, marine, and heavy machinery. Future work should include dynamic effects, lubricant degradation, and coatings to further improve the model.
Overall, I believe that the use of entropy generation as a unified measure of degradation will continue to advance the understanding and prediction of miter gear wear. The miter gear, with its unique geometry and load-sharing characteristics, remains a critical component in high-performance transmission systems. By applying irreversible thermodynamics, I have provided a new perspective and a practical tool for engineers and researchers working with miter gears.