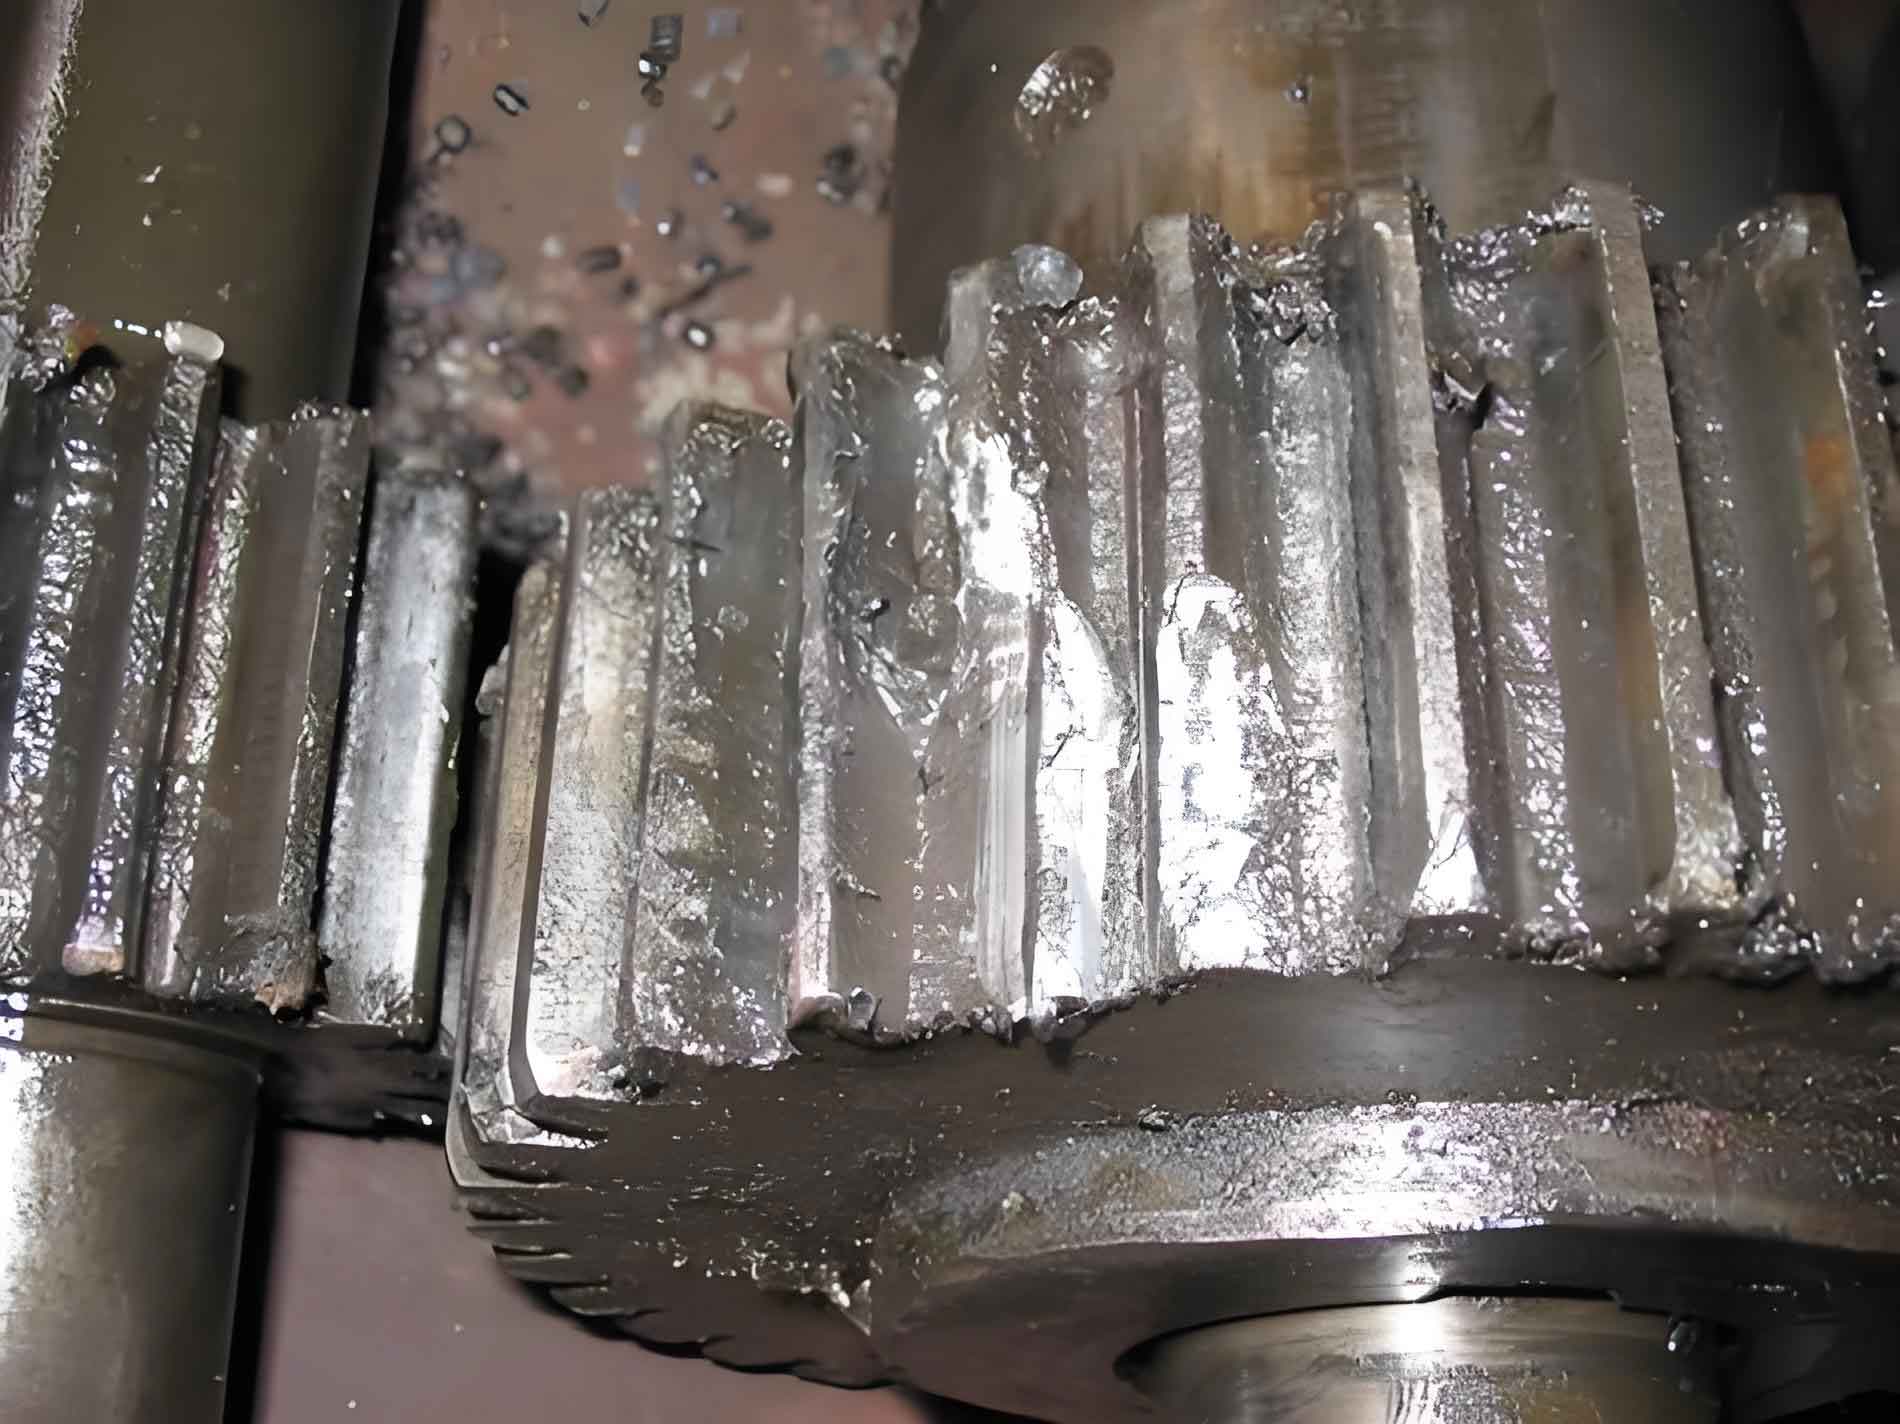
Gear transmission systems are critical components in wind power generation, aerospace applications, and industrial machinery. Their complex operational conditions make them susceptible to various failure modes, with tooth fracture accounting for 41% of all gear failure incidents according to industry statistics. Since tooth fractures often originate from root cracks, understanding the dynamics of cracked gear systems is essential for predictive maintenance and failure prevention. This study investigates the vibration characteristics of gear systems containing tooth root cracks through modified stiffness calculations and dynamic modeling.

Time-Varying Mesh Stiffness Calculation
The time-varying mesh stiffness (TVMS) serves as the primary internal excitation source in gear systems. We developed a modified potential energy method that accounts for deformation energy between the base circle and root circle, significantly improving accuracy compared to conventional approaches. The total deformation energy comprises bending, axial compression, and shear components:
$$U_b = \int_0^{b_r} \frac{[F(d – x) – Fh]^2}{2EI_x}dx + \int_{b_r}^{r_r} \frac{[F(d – x) – Fh]^2}{2EI_{x1}}dx$$
$$U_a = \int_0^{b_r} \frac{F^2 \sin^2 \alpha}{2EA_x}dx + \int_{b_r}^{r_r} \frac{F^2 \sin^2 \alpha}{2EA_{x1}}dx$$
$$U_s = \int_0^{b_r} \frac{1.2F^2 \cos^2 \alpha}{2GA_x}dx + \int_{b_r}^{r_r} \frac{1.2F^2 \cos^2 \alpha}{2GA_{x1}}dx$$
where \(F\) is the meshing force, \(E\) is Young’s modulus, \(G\) is shear modulus, \(\alpha\) is pressure angle, and \(I_x\), \(A_x\) represent the moment of inertia and cross-sectional area at distance \(x\). Hertzian contact stiffness \(k_h\) and gear body stiffness \(k_f\) are calculated as:
$$k_h = \frac{\pi EL}{4(1 – \nu^2)}$$
$$k_f = \frac{1}{EL} \left[ \cos^2 \alpha \left( L^* + M^* \left( \frac{u_f}{S_f} \right) + P^* + Q^* \left( \frac{u_f}{S_f} \right) \tan^2 \alpha \right) \right]$$
Single-tooth and double-tooth mesh stiffness are then derived as:
$$\frac{1}{k_{t1}} = \frac{1}{k_h} + \sum_{i=1}^2 \left( \frac{1}{k_{b,i}} + \frac{1}{k_{s,i}} + \frac{1}{k_{a,i}} + \frac{1}{k_{f,i}} \right)$$
$$\frac{1}{k_{t2}} = \sum_{i=1}^2 \frac{1}{k_{h,i} + \sum_{j=1}^2 \left( \frac{1}{k_{b,ij}} + \frac{1}{k_{s,ij}} + \frac{1}{k_{a,ij}} + \frac{1}{k_{f,ij}} \right)$$
Table 1 compares the accuracy improvement of our modified method against ISO 6336-1:2006 standards:
| Method | Single-Tooth Stiffness Max (×10⁸ N/m) | Error (%) | Average TVMS (×10⁸ N/m) | Error (%) |
|---|---|---|---|---|
| ISO Standard | 1.84 | 0 | 2.89 | 0 |
| Conventional Potential Energy | 2.34 | 27.17 | 3.73 | 29.07 |
| Modified Method | 1.98 | 7.61 | 3.10 | 7.27 |
Cracked Gear Modeling
Tooth root cracks significantly alter the effective cross-section and moment of inertia. We categorized crack propagation into four models based on crack depth (\(q\)) and angle (\(\psi\)):
$$q = q_1 + q_2 \quad \text{(Total crack length)}$$
$$\text{Model 1:} \quad I_x = \begin{cases}
\frac{1}{12}(h_a + h_x)^3 L & x \leq d_a \\
\frac{1}{12}h_x^3 L & x > d_a
\end{cases}$$
$$\text{Model 3:} \quad I_x = \frac{1}{12}(h_x – h_c)^3 L$$
$$\text{Model 4:} \quad A_x = h_x L – h_c L$$
Table 2 shows gear parameters used in our simulations:
| Parameter | Pinion | Gear |
|---|---|---|
| Module (mm) | 1.5 | 1.5 |
| Teeth | 36 | 90 |
| Pressure Angle (°) | 20 | 20 |
| Face Width (mm) | 12 | 12 |
| Young’s Modulus (GPa) | 206 | 206 |
Vibration Response Characteristics
A 6-DOF dynamic model was established to analyze vibration responses:
$$m_1\ddot{x}_1 + C_{1x}\dot{x}_1 + K_{1x}x_1 = -[C_m \dot{\delta} + k_m(t)\delta] \sin \alpha$$
$$I_1\ddot{\theta}_1 = T_1 – r_1[C_m \dot{\delta} + k_m(t)\delta]$$
$$\delta = x_1 \sin \alpha + y_1 \cos \alpha + r_1 \theta_1 – x_2 \sin \alpha – y_2 \cos \alpha – r_2 \theta_2 + e(t)$$
Meshing damping is calculated using:
$$C_m = 2\xi \sqrt{k_m(t) \frac{r_1^2 r_2^2}{r_1^2 I_2 + r_2^2 I_1}}$$
Steady-State Operation
Under constant load (100 N·m drive torque, 250 N·m load torque, 1500 RPM), crack progression causes distinct vibration patterns:
- 10-25% depth: Minor stiffness reduction, subtle 2nd mesh zone weakening
- 50-70% depth: 30-45% TVMS reduction, strong periodic impacts at rotation frequency (25 Hz)
- 100% depth: Complete tooth fracture with zero meshing stiffness
Variable Loading Conditions
Under fluctuating load \(T_2 = A \cos(20\pi t) + 250\) N·m:
| Fluctuation Amplitude (N·m) | Vibration Characteristics |
|---|---|
| 50 | Clear 25 Hz sidebands around mesh harmonics (900 Hz, 1800 Hz, etc.) |
| 120 | Dominant 10 Hz load frequency modulation obscuring crack signatures |
| 250 | Crack-induced features completely masked by load-induced vibrations |
Fault Detection Metrics
Statistical indicators effectively quantify gear failure progression:
$$Kurtosis = \frac{\mu_4}{\sigma^4}, \quad RMS = \sqrt{\frac{1}{N}\sum_{i=1}^N x_i^2}$$
$$Crest Factor = \frac{\text{Peak}}{\text{RMS}}, \quad Shape Factor = \frac{\text{RMS}}{|\bar{x}|}$$
Relative changes from healthy baseline:
$$R_{Xi} = \frac{X_i – X_0}{X_0} \times 100\%$$
Sensitivity analysis reveals kurtosis as the most effective gear failure indicator:
| Crack Depth | Kurtosis Increase | RMS Increase | Crest Factor Increase |
|---|---|---|---|
| 10% | 8.2% | 2.1% | 5.3% |
| 25% | 18.7% | 4.9% | 12.1% |
| 50% | 142.3% | 27.6% | 89.4% |
| 70% | 317.5% | 63.8% | 204.2% |
Conclusions
This investigation establishes that tooth root cracks significantly degrade gear performance through TVMS reduction proportional to crack depth and angle. Vibration analysis reveals periodic impacts at rotational frequency and mesh frequency sidebands as reliable gear failure indicators under steady loads. However, load fluctuations above 50% amplitude severely mask these diagnostic features. Among statistical metrics, kurtosis demonstrates superior sensitivity to early-stage gear failure detection. These findings advance predictive maintenance strategies for critical transmission systems operating under variable conditions.
