
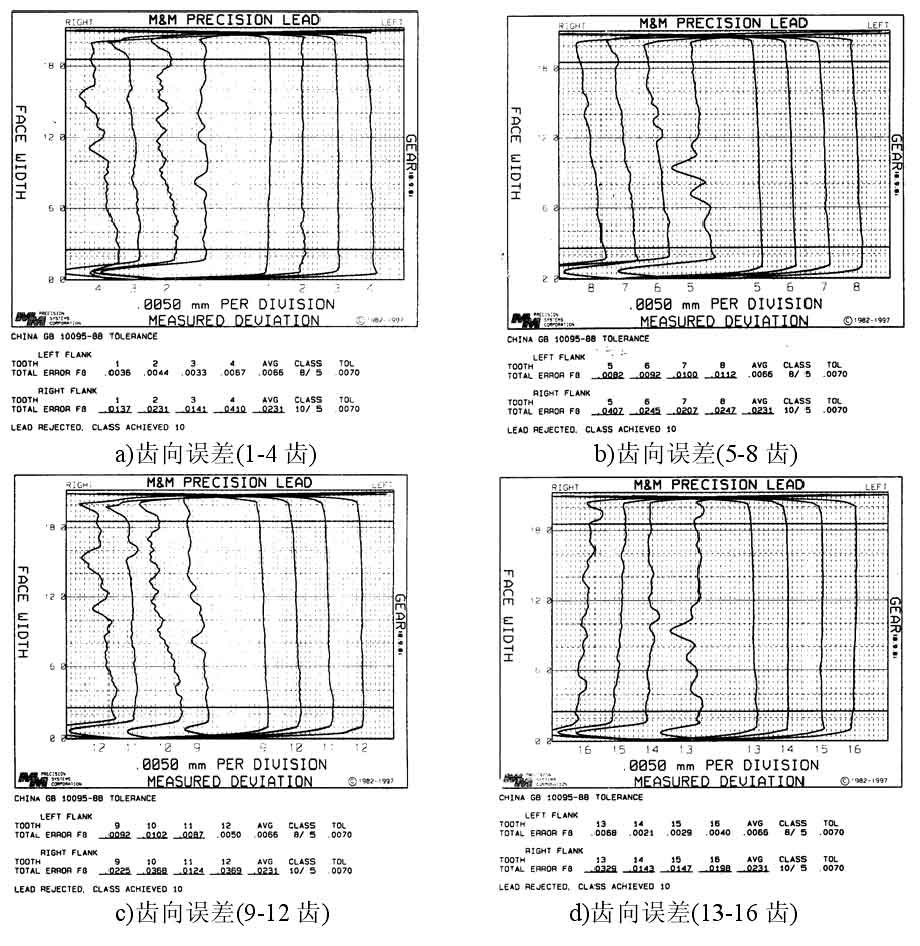
In order to facilitate the comparison with the parameters before the test, the smooth big gear after the test also adopts full tooth measurement. A-F in the figure is the tooth direction error diagram of the smooth big gear. Compared with that before the test, the tooth direction error line on the right tooth surface of the big gear changes greatly, and the tooth direction error line before the test is relatively smooth. After the test, it shows a corrugated distribution, indicating that the wear of the measured tooth surface area is uneven, and some depressions and bulges appear in the measured curve, and the tooth direction error increases significantly after the test; The tooth direction error line of the left tooth surface changes slightly, remains relatively flat, and the error change is relatively small.
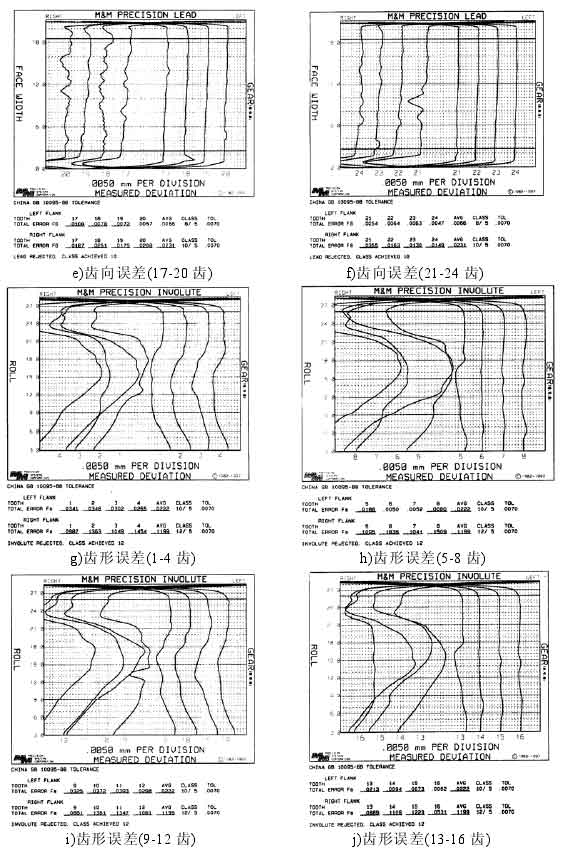
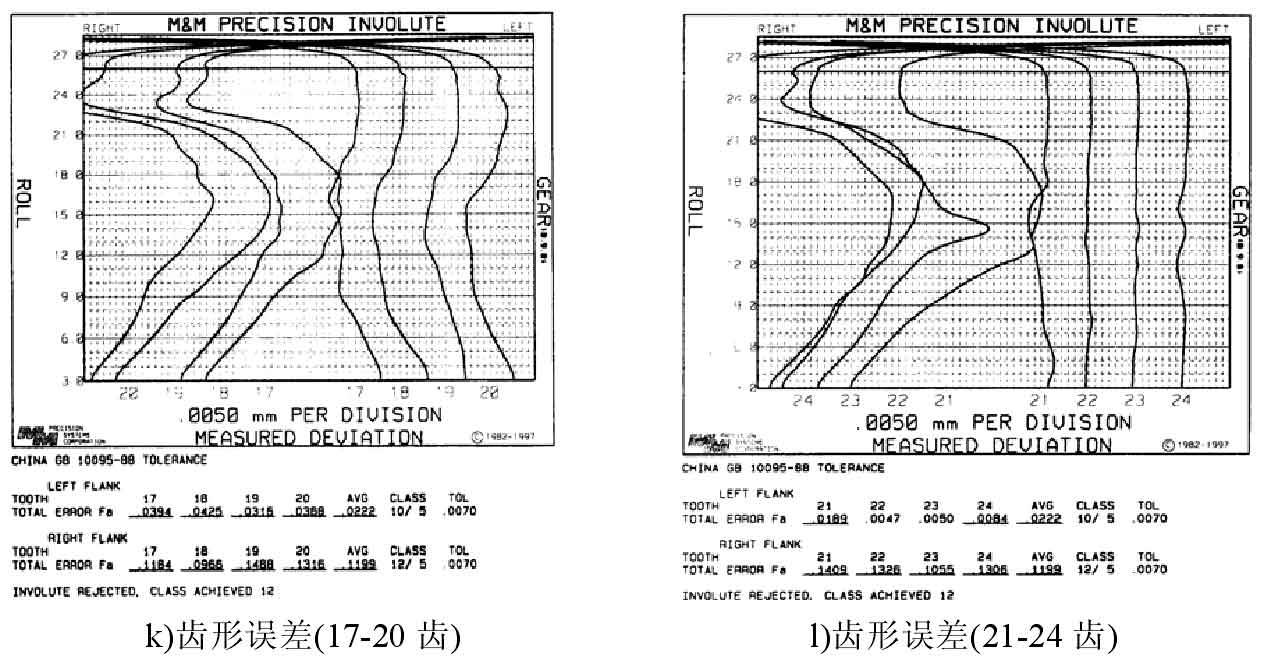
G-L in the figure is the tooth profile error diagram of the smooth big gear. Compared with that before the test, the tooth profile error line on the right tooth surface of the big gear also changes greatly. The middle position of the tooth profile error line of each tooth is concave inward, and the concave position is the contact area of the two gears, indicating that the wear at this position is serious, and the tooth profile error value after the test also increases significantly; The right tooth profile error line in the figure remains flat, and the right tooth profile error changes little.