
Spiral bevel gears transmit motion between intersecting shafts with gradual, curved-tooth contact. Their geometry distributes load across several teeth, but the tooth root remains a fatigue-critical region. In automotive, aerospace, mining, and industrial drives, a root crack can propagate to tooth fracture and stop the entire transmission. The governing failure mode is usually high-cycle bending fatigue, which means that a conventional constant-amplitude test may need millions of cycles before a fatigue limit can be estimated. Running such tests for every design is slow and expensive. A practical alternative is to use transient finite-element stress analysis and stress-life simulation to define a narrow stress window, then confirm the bending limit with a step-stress accelerated test.
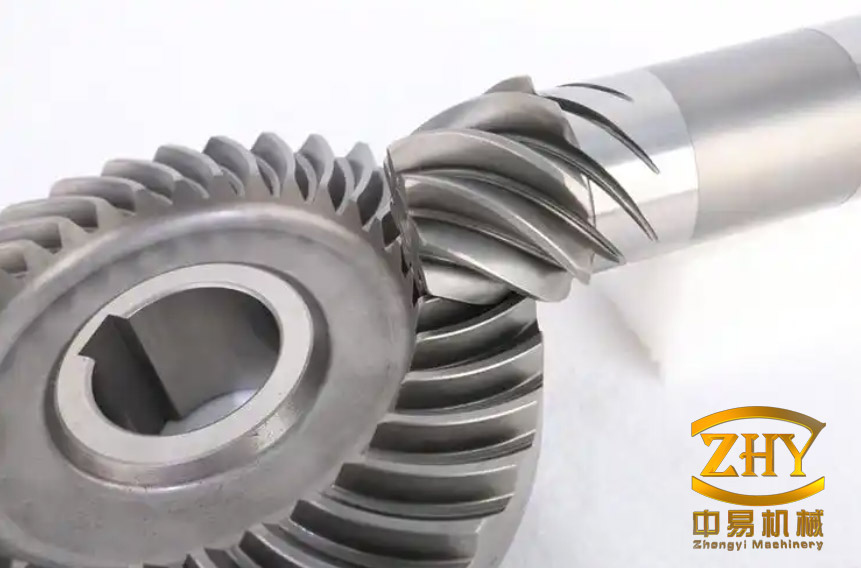
The case considered here used a single pair of 20CrNiMo spiral bevel gears, equivalent to SAE Steel Grade 8620. The design followed the GB/T 14230-93 gear bending fatigue test method. The teeth were generated from Gleason cutting parameters and ground; measured gear accuracy was grade 5 or better. The work combined three elements: a transient dynamic analysis in ANSYS Workbench, a stress-life simulation in nCode, and a Locati step-stress test on a closed-power-flow bevel gear rig. The objective was not to replace full statistical qualification, but to test whether simulation and accelerated testing could agree closely enough to support bending-strength evaluation.
Test gear pair and contact condition
The pinion had 16 teeth and the wheel 27 teeth. Both used a large-end module of 4.25 mm, a pressure angle of 20°, a midpoint spiral angle of 35°, and a face width of 17 mm. The outer cone distance was 66.6925 mm. The pitch cone angles were 30.65° for the pinion and 59.35° for the wheel. The remaining cone angles are listed in Table 1.
| Parameter | Pinion | Wheel |
|---|---|---|
| Number of teeth | 16 | 27 |
| Large-end module (mm) | 4.25 | 4.25 |
| Pressure angle (°) | 20 | 20 |
| Midpoint spiral angle (°) | 35 | 35 |
| Face width (mm) | 17 | 17 |
| Outer cone distance (mm) | 66.6925 | 66.6925 |
| Pitch cone angle (°) | 30.65 | 59.35 |
| Face cone angle (°) | 35.89 | 62.77 |
| Root cone angle (°) | 27.23 | 54.11 |
Tooth-surface points were generated in MATLAB from meshing geometry and used to build a precise Unigraphics NX solid model. The root transition surface was created with the actual root fillet radius of the manufactured gears, rather than a simplified sharp corner, because the fillet controls the local bending stress field. A simulated rolling check in the CAD environment produced a contact pattern that was then compared with the contact marking from the assembled pair. The two patterns were similar, which supported the use of the model for subsequent stress analysis.
Transient dynamic finite-element model
The assembled gear pair was imported into ANSYS Workbench for transient dynamic analysis. Both bodies were assigned SAE Steel Grade 8620 from the nCode material library so that the stress analysis and the later fatigue calculation used the same cyclic material data. Contact between the pinion and wheel flanks was defined as frictional contact with a friction coefficient of 0.03. Rotational joints were placed at the inner bores of the two gears, and the bodies were meshed with a multi-zone swept method.
The initial boundary conditions were a wheel torque of 400 N·m and a pinion speed of 600 r/min. This torque was an engineering estimate for a target life of about 3×10⁶ cycles. The transient run covered 0.025 s in 100 time steps, which resolved several tooth engagements and produced element-level stress histories rather than a single static stress field. After the first fatigue calculation, the wheel torque was adjusted by successive approximation until the simulated life approached the target. This iterative loop is important: the finite-element model supplies the stress history, but the fatigue solver determines the torque that corresponds to a chosen life and survival probability.
Stress-life simulation and P-S-N curves
The nCode stress-life solver read the stress history of each element over the transient event. The material definition used multi-ratio stress-life data, with mean-stress correction by interpolation and a specified survival probability. The critical location was the root of the concave flank of the third pinion tooth. For this gear set, the pinion working flank is concave, so the root on that side experiences tensile stress. Since the compressive strength of the material is higher than its tensile strength, the concave-flank root is the more likely fatigue origin, and the bending stress σF in the results refers to the maximum root stress at that location.
Two anchor lives were simulated for each survival level: about 1×10³ cycles and 3×10⁶ cycles. Two points are sufficient to define a straight line on log-log axes and therefore to establish the slope and intercept of a P-S-N curve. The stress at 3×10⁶ cycles was treated as the bending fatigue limit for this test programme. The simulated anchor points are given in Table 2.
| Target life | Survival probability (%) | Wheel torque (N·m) | Root bending stress σF (MPa) | Simulated life N (cycles) |
|---|---|---|---|---|
| ≈3×10⁶ | 95 | 418 | 452 | 2.96×10⁶ |
| ≈3×10⁶ | 97 | 379 | 412 | 3.06×10⁶ |
| ≈3×10⁶ | 99 | 315 | 349 | 2.99×10⁶ |
| ≈1×10³ | 95 | 1130 | 1138 | 1138 |
| ≈1×10³ | 97 | 1025 | 1038 | 1010 |
| ≈1×10³ | 99 | 850 | 870 | 1090 |
At the long-life anchor, the 95% survival stress was 452 MPa. Raising the survival requirement to 99% reduced the allowable stress to 349 MPa, about 23% lower at the same life. The short-life anchor shows the expected steep rise in stress: at 95% survival the simulated stress was 1138 MPa near 1×10³ cycles. The fitted P-S-N lines had a power-law exponent of 8.671, so the stress-life relation used in the damage calculation was
$$ \sigma^{8.671}N=C, $$
where σ is in MPa, N is in cycles, and C is a constant for a given survival curve. Using N0=3×10⁶ cycles, the three curves used in the accelerated-test interpretation had C1=3.1610×1029 for σlim=452 MPa, C2=2.0508×1029 for σlim=430 MPa, and C3=4.4349×1029 for σlim=470 MPa. The 452 MPa curve came from the 95% survival simulation; the 430 MPa and 470 MPa curves bracketed it for the Locati interpretation.
Accelerated step-stress test
The accelerated test used the Miner linear damage rule. If a specimen runs ni cycles at stress σi, and the constant-amplitude life at that stress is Ni, the fractional damage is ni/Ni. Failure is assumed when the sum reaches unity:
$$ D=\sum_{i=1}^{k}\frac{n_i}{N_i}=1. $$
The Locati method applies a stepped stress history with equal cycles at each level. The stress increment Δσ is kept constant, and the cycle ratio Δσ/n is chosen to be small enough that the damage per step is moderate. In this test the initial stress was σ0=400 MPa, each level used n=1.8×10⁵ cycles, the nominal increment was 40 MPa, and the resulting cycle ratio was Δσ/n=2.22×10-4 MPa per cycle. The test was run on a mechanical closed-power-flow bevel gear rig, in which most of the torque recirculates through the gear loop. Before loading, the pair ran under light load for 90 min. Oil temperature was held at 30–55 °C, and the oil was changed every two load levels.
Failure was defined as any one of three events: a fatigue crack at the tooth root, a 5–10% drop in load, or tooth fracture. The pinion speed was 600 r/min. The recorded stress levels in the damage calculation were 400, 432, 478, 534, and 579 MPa. At 579 MPa, after 1.26×10⁵ cycles at that level, the pinion tooth fractured. The final step therefore ended before the full 1.8×10⁵ cycles had been completed.
Damage accumulation and inferred fatigue limit
For each assumed fatigue limit, the corresponding S-N curve gave a life Ni at every test stress. The damage contributions are listed in Table 3. The damage sums were D=0.772 for the 452 MPa curve, D=1.188 for the 430 MPa curve, and D=0.551 for the 470 MPa curve. Plotting these sums against the assumed limit and interpolating to D=1 gave a bending fatigue limit of 439 MPa.
| Stress σF (MPa) | Cycles at level ni (105) | Ni at 452 MPa (cycles) | Di at 452 MPa | Ni at 430 MPa (cycles) | Di at 430 MPa | Ni at 470 MPa (cycles) | Di at 470 MPa |
|---|---|---|---|---|---|---|---|
| 400 | 1.80 | 8,656,898 | 0.020 | 5,616,987 | 0.032 | 12,145,948 | 0.015 |
| 432 | 1.80 | 4,441,656 | 0.040 | 2,881,947 | 0.062 | 6,231,807 | 0.029 |
| 478 | 1.80 | 1,847,162 | 0.097 | 1,198,523 | 0.150 | 2,591,637 | 0.069 |
| 534 | 1.80 | 706,828 | 0.255 | 458,622 | 0.390 | 991,707 | 0.182 |
| 579 | 1.26 | 350,460 | 0.360 | 227,394 | 0.554 | 491,708 | 0.256 |
| Sum | — | — | 0.772 | — | 1.188 | — | 0.551 |
The simulated 95% survival bending stress at 3×10⁶ cycles was 452 MPa. The accelerated test estimate was 439 MPa, a difference of 13 MPa, or about 3%. The direction of the difference is also consistent with the damage sums: assuming 452 MPa as the true limit leaves D<0.8 at failure, while assuming 430 MPa pushes D above 1. The interpolated 439 MPa lies between those bounds and is therefore a plausible experimental estimate for this pair.
Interpretation and limits
The agreement is useful because the two methods are independent in character. The finite-element model calculates a stress history from geometry, contact, and applied torque; the nCode calculation converts that history into life at a specified survival probability; the accelerated test applies a stepped load history to a real ground pair and interprets failure through cumulative damage. A 3% difference between the simulated long-life stress and the accelerated-test estimate supports the use of this workflow for preliminary bending-strength evaluation of spiral bevel gears. It also shows how a single specimen can provide a rapid experimental check instead of a long series of constant-amplitude tests at 3×10⁶ cycles.
The result should not be read as a statistical fatigue limit. Only one gear pair was tested, so scatter from material, heat treatment, grinding, contact alignment, and root fillet geometry is not represented. The Locati test estimates an equivalent limit under a stepped loading history, not a conventional constant-amplitude endurance limit. The value at 3×10⁶ cycles is a conditional long-life strength, and the P-S-N curves are simulation-based rather than experimentally replicated probability curves. Contact pattern, oil temperature, load drop detection, and the assumed S-N slope also affect the inferred limit. A larger sample, run-out tests, and comparison with constant-amplitude data would be needed before using the 439 MPa result as a design allowable.
For engineering use, the combination is best treated as a screening and design-support tool. Transient finite-element analysis and stress-life simulation define the stress window and the critical root location; the Locati test then provides a fast experimental check on the real tooth root. This can shorten bench-test time and reduce cost, particularly in the early stages of spiral bevel gear development, while full qualification still requires a statistically adequate test programme.