
When a helicopter main reducer loses oil pressure, the input-stage spiral bevel gear pair does not fail instantly. The lubricant film thins, asperities begin to carry load, friction heat rises, and the convection path that removes heat degrades at the same time. The resulting thermal transient can end in scuffing or seizure. Predicting tooth-surface temperature during this window is therefore a survival-time problem, not a steady-state lubrication problem.
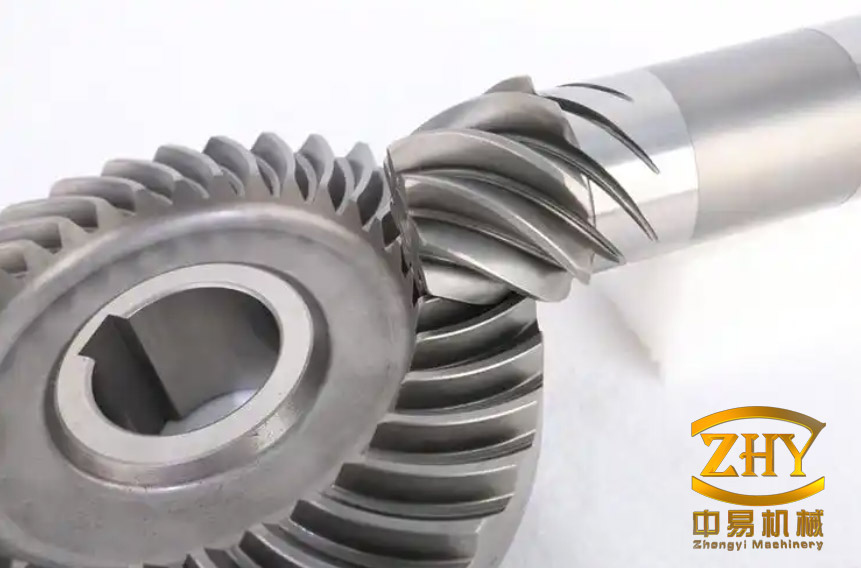
The case considered here is the input stage of a helicopter main reducer: a 27-tooth pinion driving an 81-tooth wheel, with a 49 mm face width, 3.85 mm module, 20° pressure angle, 35° spiral angle, 90° shaft angle, and 0.0005 mm surface roughness. The method treats the oil-air mixture as a time-varying working fluid, applies friction heat to the loaded contact ellipse, solves the gear-body temperature with a thermal network, and adds a flash-temperature correction for the contact instant.
The coupled failure mechanism
Sliding friction dominates heat generation in the mesh; rolling friction and windage are small enough to neglect. The friction heat flux is proportional to the local friction coefficient, contact pressure, and sliding speed. In a spiral bevel gear the contact ellipse moves across the curved tooth, and the sliding speed reverses at the pitch point, so the heat flux is spatially non-uniform even at constant load.
At the same time, the lubricant is no longer pure oil. As the oil fraction falls, the mixture viscosity, thermal conductivity, and Prandtl number move toward those of air. The convection coefficient on the mesh face falls, the convection thermal resistance rises, and the gear body retains more of the friction heat. The film also becomes thinner: the film ratio λ = h_min/σ_m drops from full-film to mixed and then to boundary lubrication. The friction coefficient rises as asperity contact increases, and once the film can no longer form it approaches the dry value. Heat generation and heat removal therefore move in opposite directions, which is why the temperature rise accelerates.
Lubricant state and friction heat
The mixture is described by a property $\tau_h$ that interpolates between oil and air:
$$\tau_h=b_t\tau_o+(1-b_t)\tau_a$$
where $b_t$ is the instantaneous oil fraction, $\tau_o$ is the oil property, and $\tau_a$ is the air property. The oil fraction is assumed to fall linearly from 1 to 0, so the calculation represents a gradual loss of oil rather than an instantaneous dry start. Oil properties are treated as temperature-independent; air properties are allowed to vary with time. The same interpolation is applied to viscosity, thermal conductivity, and the other properties that enter the convection and friction models.
The friction heat flux on the two surfaces is
$$q_1=\xi\gamma f p v_s,\qquad q_2=(1-\xi)\gamma f p v_s$$
where subscripts 1 and 2 denote pinion and wheel, $\xi$ is the heat partition coefficient, $\gamma$ is the mechanical-to-thermal energy conversion factor, $f$ is the local friction coefficient, $p$ is the contact pressure, and $v_s$ is the sliding speed. The conversion factor is 0.92, within the usual range of 0.9–0.95. The partition is not held constant: it is updated as the two tooth surfaces develop different bulk temperatures.
The lubrication state is tracked through the film ratio
$$\lambda=\frac{h_{\min}}{\sigma_m}$$
where $h_{\min}$ is the minimum film thickness and $\sigma_m$ is the composite surface roughness. A ratio above 2 is treated as full-film lubrication; between 0.2 and 2 the contact is mixed; below that it is boundary. In the mixed regime the local friction coefficient is obtained from a mixed-lubrication expression that blends full-film and boundary values. When the film collapses, the model moves to the dry friction level.
Pin-on-disc tests on 9310 steel, using an MMW-1 vertical universal friction and wear tester, characterized the limiting friction states. Three boundary-lubrication runs gave 0.12784, 0.10427, and 0.08821, with a mean of 0.10677. Three dry runs gave 0.41851, 0.43534, and 0.35873, with a mean of 0.40419. The dry level is nearly four times the boundary level, which explains why the final part of the starvation transient is thermally steep.
Thermal network for the gear body
Loaded tooth contact analysis supplies the transient contact ellipse and the load distribution. The friction heat flux is applied on the ellipse, and the contact line is discretized into 45 contact points for the starvation calculation. The gear body is represented as a thermal network of nodes with heat capacity, connected by conduction and convection resistances. For node $i$,
$$C_i\frac{dT_i}{dt}=Q_i+\sum_j\frac{T_j-T_i}{R_{icj}}+\sum_k\frac{T_k-T_i}{R_{ivk}}$$
where $C_i$ is the node heat capacity, $Q_i$ is the heat input, $T$ is nodal temperature, and $R_{icj}$ and $R_{ivk}$ are conduction and convection resistances. In normal lubrication the left-hand term is set to zero; in starvation it is retained because the system takes much longer to settle. Radiation is neglected. Conduction is simplified as plane-wall or cylindrical-wall resistance:
$$R_h=\frac{1}{h_cA},\qquad R_p=\frac{\delta_p}{K_pA_p},\qquad R_y=\frac{\ln(d_{y2}/d_{y1})}{2\pi K_yl_y}$$
where $h_c$ is the convection coefficient, $A$ is the wetted area, $\delta_p$ and $K_p$ are the wall thickness and conductivity, and $d_{y1}$, $d_{y2}$, $K_y$, and $l_y$ are the inner diameter, outer diameter, conductivity, and length of the cylindrical wall. The mesh-face convection coefficient is estimated from a Reynolds–Prandtl correlation with the tooth height as characteristic length. The end face is treated as a rotating disk with laminar or turbulent correlations, and the root, tip, and non-meshing faces take one-third of the end-face coefficient.
The boundary temperatures are 50°C for the oil and 40°C for the internal air at normal steady state, with the air temperature rising at 0.02°C/s during the starvation calculation. Bearings, shafts, and housing are outside the model because their influence on the mesh-face temperature is small in this case. The transient network starts from the normal-lubrication steady temperature and advances in 2,700 time steps.
Flash temperature and a time-varying heat partition
The total instantaneous tooth temperature is the sum of the bulk temperature and the flash temperature:
$$T_{ij}=T_{ib}+T_{is}$$
where $i$ denotes a time point during starvation, $T_{ib}$ is the bulk temperature, and $T_{is}$ is the flash temperature. The classical Block flash-temperature equations are
$$T_{s1}=1.11\beta\frac{q_l}{\sqrt{k_1\rho_1c_1v_1}},\qquad T_{s2}=1.11(1-\beta)\frac{q_l}{\sqrt{k_2\rho_2c_2v_2}}$$
where $\beta$ is the heat partition coefficient, $q_l$ is the heat flux entering the surface, $k$ is thermal conductivity, $\rho$ is density, $c$ is specific heat, and $v$ is tangential speed. Block’s original assumption is that the two flash temperatures are equal, which fixes $\beta$. That is reasonable for dry running but not for starvation, where the two bodies have different bulk temperatures and see a changing film.
The improved method uses a two-stage partition. First, a coefficient $\phi$ is computed from the instantaneous bulk-temperature difference and the thermal/contact parameters $A$, $B$, and $C$:
$$\phi=\frac{1}{A_1+B_1+A_2+B_2}\left(\frac{T_{b2}-T_{b1}}{q_l}+A_2+B_2\right)$$
Then the second-stage coefficients are
$$\xi_1=\phi\frac{A_1-C_1}{A_1},\qquad \xi_2=(1-\phi)\frac{A_2-C_2}{A_2}$$
and the flash temperatures are
$$T_{so1}=\xi_1q_lA_1,\qquad T_{so2}=\xi_2q_lA_2$$
The parameters $A$, $B$, and $C$ depend on material properties and contact geometry and are updated as the mixture properties change. This is the main difference from a fixed-partition Block calculation: the heat split responds to the instantaneous body temperatures and film state, not to a constant ratio.
Test gear and starvation procedure
The validation used a dedicated spiral bevel gear test box rather than the full helicopter reducer. The gear parameters are listed in Table 1.
| Parameter | Value |
|---|---|
| Teeth, pinion/wheel | 27/81 |
| Face width | 49 mm |
| Module | 3.85 mm |
| Pressure angle | 20° |
| Spiral angle | 35° |
| Shaft angle | 90° |
| Surface roughness | 0.0005 mm |
The rig comprised a drive motor, couplings, torque and speed transducers, the test gearbox, an eddy-current brake, a lubrication system, and a data-acquisition system. The gearbox was instrumented with Pt100 resistance temperature detectors, a slip ring for the rotating gear signals, a multi-channel temperature meter, and a thermal imager. Normal-lubrication tests ran at 20 kW and 6,000, 5,000, and 4,000 r/min until steady state. For the starvation test, the box was first stabilized at 20 kW and 6,000 r/min; the power was then reduced to 15 kW, the oil pump was switched off, and the run continued for 45 min. The oil temperature was 50°C. The infrared camera measured the tooth surface as it left mesh, because the true contact instant is not accessible; that measurement is treated as the instantaneous mesh temperature.
Normal-lubrication baseline
At 20 kW the measured temperatures are 45.1–48.1°C on the meshing surfaces and 44.3–46.0°C on the driven gear end face. The thermal network and FE results stay within 10% of the measurements, and the FE results are closer in all reported cases. The thermal network underpredicts the driving gear by 8.6–8.9%, which is the largest deviation in the normal-lubrication set.
| Location | Speed (r/min) | Test (°C) | Thermal network (°C) | Error (%) | FE (°C) | Error (%) |
|---|---|---|---|---|---|---|
| Driven gear mesh | 6,000 | 45.1 | 43.0 | 4.7 | 44.7 | 0.9 |
| Driven gear mesh | 5,000 | 45.7 | 43.2 | 5.5 | 44.9 | 1.8 |
| Driven gear mesh | 4,000 | 46.6 | 43.4 | 6.9 | 45.0 | 3.4 |
| Driving gear mesh | 6,000 | 47.4 | 43.3 | 8.6 | 45.4 | 4.2 |
| Driving gear mesh | 5,000 | 47.8 | 43.5 | 8.9 | 45.6 | 4.6 |
| Driving gear mesh | 4,000 | 48.1 | 43.8 | 8.9 | 45.9 | 4.5 |
| Driven gear end face | 6,000 | 44.3 | — | — | 44.1 | 0.4 |
| Driven gear end face | 5,000 | 45.1 | — | — | 44.5 | 1.3 |
| Driven gear end face | 4,000 | 46.0 | — | — | 44.7 | 2.8 |
At constant power, lowering speed from 6,000 to 4,000 r/min raises the temperature. The torque must rise to hold 20 kW, so friction heat increases; at the same time the lower speed reduces the convection coefficient. Both simulations and measurements show the same trend, which is the baseline needed before interpreting the starvation transient.
Starvation transient
During starvation the local friction coefficient rises along all 45 contact points. Within a given time slice, points near the pitch point can show a higher friction coefficient because the sliding speed approaches zero, the radius of curvature is small, and the contact stress is high. The average friction coefficient rises continuously; once boundary lubrication is reached, the friction heat climbs steeply; when the dry friction level is approached, the heat generation levels off. The convection resistance follows the opposite course: as the oil fraction falls, the mixture becomes air-dominated and the resistance rises until it stabilizes at the air value.
The bulk temperature first drops because the input power is reduced from 20 to 15 kW at the start of the starvation test. It then rises as friction heat increases and convection degrades. The flash temperature rises more sharply near the boundary-lubrication limit and then levels off as the dry friction coefficient is reached. The driving gear runs hotter than the driven gear even though the driven gear receives the larger heat share, because the driving gear has the larger convection resistance and the two flash temperatures are similar.
At the end of the 45 min test, the measured temperatures are 49.2°C on the driven gear end face, 51.1°C on the driven gear meshing surface, and 55.4°C on the pinion meshing surface. The comparison with the two calculation paths is given in Table 3.
| Location | Test (°C) | Thermal network (°C) | Error (%) | FE (°C) | Error (%) |
|---|---|---|---|---|---|
| Driven gear end face | 49.2 | — | — | 51.3 | 4.2 |
| Driven gear meshing surface | 51.1 | 56.4 | 10.3 | 51.5 | 0.8 |
| Pinion meshing surface | 55.4 | 60.1 | 8.5 | 59.1 | 6.7 |
The thermal network gives 56.4°C and 60.1°C on the two meshing surfaces; the FE model gives 51.3°C, 51.5°C, and 59.1°C for the three locations. The largest relative error is 10.3%, on the driven gear meshing surface with the thermal network. The comparison supports the method within the tested conditions. After the starvation run the tooth surfaces showed black marks and wear in the contact zone, consistent with asperity contact and loss of film; this reduces contact-pattern robustness and is the practical reason for predicting the thermal transient.
Implications and limits
Three points are useful for transmission design. First, the thermal runaway is governed by the oil-air ratio and film collapse, not by the initial power alone; a modest power reduction can still be followed by a large temperature rise once the film is gone. Second, at constant power a lower speed is not thermally safer: torque rises, friction heat rises, and convection falls. Third, a thermal-network calculation with an improved flash-temperature partition can screen starvation survival without a full FE run or a dedicated starvation test; FE and instrumented tests remain the validation path.
The limits are equally important. The oil fraction is assumed to decrease linearly; oil properties are treated as temperature-independent; radiation is neglected; bearings, shafts, and housing are excluded; the friction tests used 9310 steel on a pin-on-disc machine, not the actual gear contact; and the infrared measurement is taken at mesh exit rather than at the contact instant. The quantitative errors are therefore tied to this gear pair and this test box, not a universal error bound.