
Two Quantities That Decide Whether a Bevel Pair Is Acceptable
Spiral bevel gears connect intersecting shafts through a curved tooth flank that engages gradually along the face width. The geometry delivers high load capacity, low noise and a compact envelope, which is why the type dominates final drives in vehicles, aircraft and marine transmissions, as well as spindle drives in machine tools. The same curvature that smooths the mesh also makes it difficult to control: contact is a three-dimensional, elastically deforming engagement between slightly misaligned bodies, and its quality depends jointly on tooth-surface design, cutting and grinding settings, heat-treatment distortion, housing stiffness and assembly shimming.
Practice judges the result mainly by the contact pattern — its position, orientation and size on the flank — because marking compound makes the pattern directly visible and comparatively easy to inspect on a rolling test. Transmission error (TE), the difference between the actual and the ideal rotation of the driven gear, is the second indicator and the mechanically more fundamental one. TE is the principal internal excitation of a geared system, it is directly tied to mesh stiffness, and it sets the level of gear whine and of the dynamic bearing and shaft loads that follow. For spiral bevel and hypoid pairs, however, most published TE results are computational: loaded tooth contact analysis and finite element models of varying fidelity. Bench data taken over a controlled grid of torque and speed are much rarer, largely because instrumenting a rotating bevel gear for root strain and reading its angular position to a few hundredths of a degree is awkward.
Test Article and Power-Closed Bench
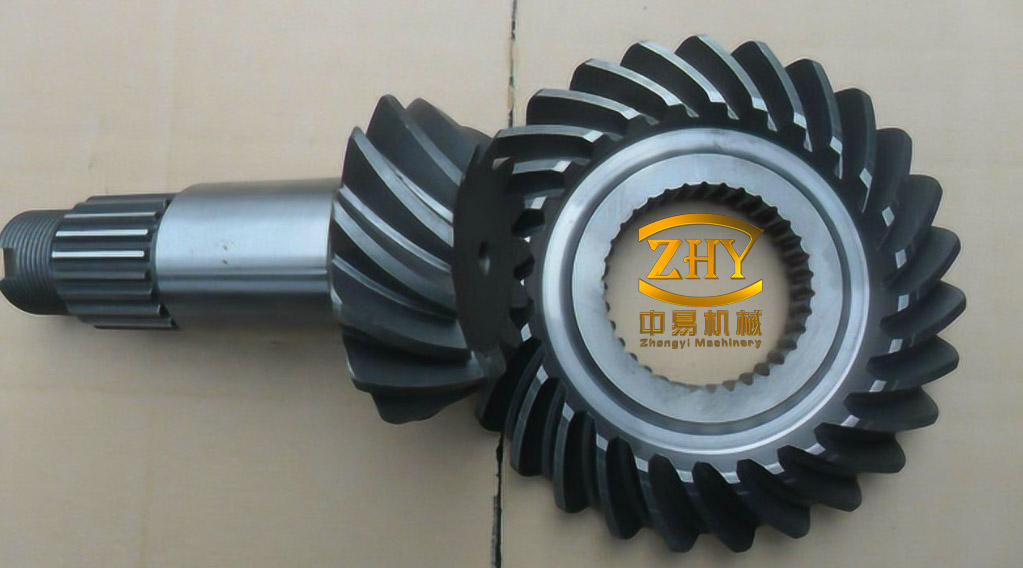
The measurements discussed here were made on a 30/40-tooth spiral bevel pair of grade 6 accuracy, running with the 30-tooth pinion as driver and its concave flank as the working surface; the 40-tooth wheel works on its convex flank. Nominal data are given in Table 1. The reduction ratio of 0.75 means that at a pinion speed of 60 r/min the wheel turns at 45 r/min, corresponding to 1 Hz and 0.75 Hz shaft orders respectively — a detail that matters when reading the spectra below.
| Parameter | Symbol | Wheel (40 teeth) | Pinion (30 teeth) |
|---|---|---|---|
| Number of teeth | z | 40 | 30 |
| Transverse module at large end (mm) | mn | 10 | 10 |
| Pressure angle (°) | α | 20 | 20 |
| Spiral angle (°) | β | 35 | 35 |
| Face width (mm) | df | 60 | 60 |
| Addendum (mm) | ha | 8.5 | 8.5 |
| Whole tooth depth (mm) | h | 18.88 | 18.88 |
| Accuracy grade | — | 6 | 6 |
| Hand of spiral | — | Right | Left |
The rig is a closed-loop arrangement: the test gearbox and a matching slave gearbox are mounted back to back and connected through a closing gearbox, so that the power circulates and the servo drive only has to supply the losses. A 16.4 kW servo motor rated at 3 000 r/min drives through a 50:1 reducer, limiting the test gearbox to 60 r/min; a separate loading unit applies torque up to 11 000 N·m independently of speed. Torque and speed are therefore two independent control parameters, which is what makes a systematic torque–speed grid practical on a bench of modest installed power. The full envelope of 0–60 r/min and 0–11 000 N·m is treated as quasi-static: inertial effects are negligible and the lubricant film is not in a dynamically loaded regime, so the measured quantities reflect compliance of teeth, shafts and bearings rather than rotor dynamics.
| Device | Key specification |
|---|---|
| Servo motor and reducer | 16.4 kW, 3 000 r/min, reduction 50:1 (60 r/min at the test gearbox) |
| Torque loading unit | 0–11 000 N·m, ±0.1% FS, max. 5 000 r/min |
| Torque/speed transducer | 0–15 000 N·m, ±0.5% FS; 0–6 000 r/min, 1 r/min resolution |
| Rotary encoders | 23 600 lines/rev with 400-fold subdivision |
| Telemetry system | 8 channels, sampling up to 5 kHz, 0.01% accuracy, max. 5 000 r/min |
| Strain gauges | 1 000 MPa range, ±0.5% FS, 1 ms response |
Measurement Principles
High-resolution rotary encoders are mounted at the pinion input and at the free end of the wheel, and the two angular signals are combined into a single kinematic error:
$$\mathrm{TE}=\theta_{2}-\theta_{1}\frac{z_{1}}{z_{2}}$$
where θ1 and θ2 are the measured rotations of pinion and wheel and z1, z2 their tooth counts. With 23 600 lines and 400-fold subdivision the angular resolution is about 3.8 × 10⁻⁵ degrees, roughly three orders of magnitude finer than the peak-to-peak errors reported below, so the encoder is not the limiting factor. The measured TE aggregates three physically distinct contributions: deviations built in by tooth-form and pitch manufacturing errors, deviations from elastic deflection of the teeth under load, and deviations from shaft and bearing compliance that displace the gears from their ideal relative position. Only the second and third are load-dependent, which is why the torque trend is the informative part of the data.
Root strain is picked up by a half-bridge circuit and transmitted from the rotating wheel by the telemetry unit mounted at its free end. Along the face width the tooth is divided into nine equal stations from small to large end; working gauges were cemented at the first six stations, each on a different tooth, on the root of the concave side. A temperature-compensation gauge is placed on the end face near the small end, away from the root, so that the mechanical strain follows from
$$\varepsilon_{F}=\varepsilon_{w}-\varepsilon_{t}$$
with εw the working-gauge reading and εt the compensator. Root stress then follows from a linear elastic relation,
$$\sigma_{F}=E\,\varepsilon_{F}$$
with E = 2.09 × 10⁵ MPa for steel; tensile stress is taken as positive, compressive as negative. Strain histories were recorded at 100 Hz, ample for the sub-1 Hz shaft orders of interest.
Transmission Error: Waveform and Peak-to-Peak Values
At constant speed and torque the TE signal oscillates in an approximately sinusoidal form about its mean, with the mean removed for presentation. Records taken at different torques do not share a starting phase, because acquisition began at different points of the meshing cycle, so only amplitudes and spectral content are compared across conditions. Peak-to-peak values over the full grid — pinion speed 10–60 r/min in 10 r/min steps, torque 0–7 500 N·m in 1 500 N·m steps — are collected in Table 3.
| Torque (N·m) | 10 r/min | 20 r/min | 30 r/min | 40 r/min | 50 r/min | 60 r/min |
|---|---|---|---|---|---|---|
| 0 | 0.126 6 | 0.125 2 | 0.136 3 | 0.137 9 | 0.139 0 | 0.147 3 |
| 1 500 | 0.139 1 | 0.161 2 | 0.147 5 | 0.146 5 | 0.150 5 | 0.154 7 |
| 3 000 | 0.163 5 | 0.186 1 | 0.180 4 | 0.171 5 | 0.181 1 | 0.164 7 |
| 4 500 | 0.194 2 | 0.206 2 | 0.197 5 | 0.184 7 | 0.178 9 | 0.175 7 |
| 6 000 | 0.214 3 | 0.219 2 | 0.216 6 | 0.206 1 | 0.202 2 | 0.196 0 |
| 7 500 | 0.232 2 | 0.225 4 | 0.212 4 | 0.217 5 | 0.229 2 | 0.229 2 |
Loading the mesh roughly doubles the error: the smallest peak-to-peak value, 0.125 2° at 20 r/min and zero torque, rises to 0.232 2° at 10 r/min and 7 500 N·m. The trend across torque is monotonic at every speed tested, and it is consistent with the mechanism sketched above — as tooth, shaft and bearing deflections grow, the wheel lags or leads its ideal position by a larger amount within each mesh cycle. Speed, by contrast, has a weak and non-monotonic influence on the peak-to-peak value, which is what a quasi-static regime should produce: at these speeds the load path is set by torque, not by centrifugal or squeeze-film effects.
Spectral Content: Once-Per-Revolution Dominance
Fourier analysis of the same records shows that the error is dominated by the pinion rotation order — 1 Hz at 60 r/min — with progressively smaller contributions at higher multiples of shaft speed. Loaded tooth contact and finite element studies of spiral bevel pairs attribute this once-per-revolution content to the cyclic migration of the contact line across the face width together with the runout and misalignment of the two axes, so it is an order that reflects the assembly as much as the tooth flanks themselves.
Torque and speed affect the spectrum very differently from the way they affect the peak-to-peak value. In a torque sweep from 0 to 7 500 N·m in 500 N·m steps at 60 r/min, the amplitude at the 1 Hz order grows in an approximately linear proportion to torque, whereas the peak-to-peak value grows more slowly at high load. In a speed sweep at 2 500 N·m from 10 to 60 r/min in 5 r/min steps, the same order varies substantially but without a clear trend, reaching a minimum of 0.044 9° at 15 r/min and a maximum of 0.067 2° at 20 r/min. A single nominal TE curve therefore cannot represent the excitation: the harmonic amplitude that drives a dynamic model must be selected for the operating torque and, to a lesser but still significant degree, for the operating speed.
Tooth Root Stress Along the Face Width
Stress peak-to-peak values were recorded over the same speed grid at torques from 1 500 to 7 500 N·m in 1 500 N·m steps. Because the load is not distributed uniformly along the face width, the six instrumented stations differ widely: the largest peak-to-peak value is roughly ten times the smallest, for example 145.65 MPa against 13.89 MPa at 1 500 N·m and 60 r/min (Table 4).
| Torque (N·m) | Minimum over stations, at 10–60 r/min | Maximum over stations, at 10–60 r/min | ||||||||||
|---|---|---|---|---|---|---|---|---|---|---|---|---|
| 10 | 20 | 30 | 40 | 50 | 60 | 10 | 20 | 30 | 40 | 50 | 60 | |
| 1 500 | 12.89 | 12.83 | 12.85 | 13.18 | 13.91 | 13.89 | 128.93 | 131.58 | 136.26 | 132.69 | 141.59 | 145.65 |
| 3 000 | 21.58 | 22.69 | 23.34 | 23.82 | 24.70 | 24.30 | 243.81 | 246.43 | 253.18 | 251.65 | 260.83 | 260.58 |
| 4 500 | 30.97 | 32.43 | 33.12 | 33.85 | 34.92 | 35.27 | 350.20 | 350.36 | 352.54 | 362.07 | 355.50 | 360.90 |
| 6 000 | 40.08 | 42.44 | 44.03 | 44.57 | 45.29 | 45.72 | 445.73 | 450.70 | 450.58 | 447.46 | 469.26 | 474.15 |
| 7 500 | 48.67 | 52.29 | 53.75 | 55.30 | 56.03 | 55.80 | 535.39 | 538.40 | 540.55 | 550.56 | 548.87 | 581.89 |
Two features govern the interpretation. First, both the smallest and the largest station values scale linearly with torque: from 1 500 to 7 500 N·m the maximum rises from about 146 MPa to about 582 MPa, very nearly a factor of four for a factor of five in load, and the minimum rises from 13.9 MPa to 55.8 MPa over the same interval. Second, speed barely matters at any station, again confirming that the quasi-static envelope isolates load-driven compliance.
The distribution along the face width is strongly non-uniform (Table 5). The two stations nearest the small end carry very little bending stress, below 30 MPa peak-to-peak at 1 500 N·m and about 117 MPa at 7 500 N·m. Stress jumps sharply at the third station and remains high over the outer half of the face, reaching 581.89 MPa at the station closest to the large end under the heaviest load. The progression is not strictly monotonic — the fifth station reads below the fourth and sixth at every torque — which indicates that the contact pressure itself is concentrated in a band rather than simply increasing outward.
| Torque (N·m) | 1 | 2 | 3 | 4 | 5 | 6 |
|---|---|---|---|---|---|---|
| 1 500 | 13.89 | 27.96 | 114.01 | 142.70 | 97.03 | 145.65 |
| 3 000 | 24.30 | 50.30 | 197.83 | 243.96 | 187.82 | 260.58 |
| 4 500 | 35.27 | 72.41 | 274.01 | 346.35 | 298.51 | 360.90 |
| 6 000 | 45.72 | 95.61 | 356.03 | 444.48 | 415.07 | 474.15 |
| 7 500 | 55.80 | 117.49 | 428.95 | 537.10 | 512.00 | 581.89 |
Stress History Within One Mesh Cycle
Time histories recorded at 60 r/min and at 4 500, 6 000 and 7 500 N·m show the sequence that a spiral bevel tooth actually experiences. Stress is near zero while the tooth is out of mesh; as the flank comes into contact the root goes into tension and the tensile stress climbs to a peak; as the tooth rolls out of contact the stress falls through zero, reverses, and reaches its compressive minimum before the cycle repeats. At the station closest to the large end the maximum tensile stress is 261.1 MPa, 331.7 MPa and 401.4 MPa at the three torques, and the maximum compressive stress is 100.4 MPa, 142.3 MPa and 179.8 MPa (Table 6). The peak-to-peak amplitudes in Table 5 are simply the sum of these two magnitudes, which confirms that the range is set by the tension-to-compression swing rather than by a superimposed mean.
| Torque (N·m) | Max. tensile (MPa) | Max. compressive (MPa) | Sum of magnitudes (MPa) | Measured peak-to-peak (MPa) |
|---|---|---|---|---|
| 4 500 | 261.1 | −100.4 | 361.5 | 360.90 |
| 6 000 | 331.7 | −142.3 | 474.0 | 474.15 |
| 7 500 | 401.4 | −179.8 | 581.2 | 581.89 |
In the frequency domain the stress signal is dominated by the wheel rotation order — 0.75 Hz at 60 r/min — together with its low harmonics, and the amplitude at each of these orders grows with torque. That the dominant order is the once-per-revolution one rather than the tooth-mesh order is characteristic of bevel and hypoid pairs: every tooth passes through a different region of the contact pattern, so the loading seen at a fixed root location varies with wheel position rather than with tooth count alone.
What the Measurements Imply for Design and Modelling
Three consequences follow for practice. First, a transmission-error excitation used in a dynamic model of a spiral bevel stage should be specified together with the torque at which it was obtained. Because the once-per-revolution amplitude rises almost proportionally with torque while the peak-to-peak value does not, a single broadband TE figure cannot simultaneously reproduce the excitation at low and high load. Second, speed cannot be ignored even though the peak-to-peak value is nearly speed-independent: the harmonic amplitude varies by roughly 50% between 15 and 20 r/min at constant torque, so a model calibrated at one speed may misplace the resonance response at another. Third, root-stress assessment should not rely on a single gauge location. With a tenfold spread between the small-end and large-end stations, and with the maximum appearing on the outer half of the face width, bending-fatigue checks for this contact pattern must use the large-end root, and the mean stress of the tension–compression cycle must enter any fatigue criterion rather than the alternating range alone.
The limits of the data should be stated as plainly as the trends. All results are quasi-static, below 60 r/min, and therefore exclude lubricant-film dynamics, centrifugal stiffening and the thermal state of a gear running at service speed. Loading was capped at 7 500 N·m although the bench can apply 11 000 N·m, only one gear pair of grade 6 accuracy was tested, and root strain was sampled at six of nine face-width stations on the working flank only. Within that envelope, the measurements provide a consistent, torque-resolved baseline for validating loaded tooth contact and dynamic models of spiral bevel drives, and they show that transmission error and root stress respond to torque and speed through different mechanisms — compliance for the former, contact-pattern position for the latter.