
1. Introduction
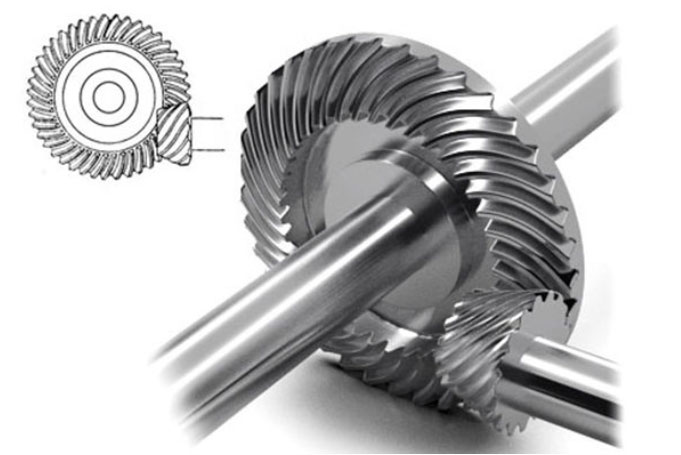
Hypoid gear is widely used in rear axle differentials due to their ability to transmit power between non-intersecting shafts. However, transmission error (TE), defined as the deviation between the actual and theoretical angular positions of the driven gear, significantly impacts vibration, noise, and overall durability. Traditional studies often rely on idealized theoretical tooth surfaces, neglecting manufacturing imperfections. This discrepancy leads to inconsistent evaluation standards between simulations and real-world applications.
This study addresses this gap by reconstructing hypoid gear tooth surfaces using NURBS (Non-Uniform Rational B-Spline) fitting based on 3D coordinate measurements. Finite element analysis (FEA) in Abaqus and experimental validation on a Gleason 600HTT rolling tester were conducted to compare TE between real and theoretical tooth surfaces. Additionally, the sensitivity of TE to installation errors—axial, offset, and shaft angle errors—was systematically analyzed.
2. Construction of Real Tooth Surface Model
2.1 3D Coordinate Measurement
The Gleason 350GMM gear measurement system was employed to capture 45 discrete points on each tooth surface (9 columns along the tooth length × 5 rows along the tooth height). Table 1 summarizes the measured coordinates for the pinion.
Table 1: 3D Coordinates of Pinion Tooth Surface Points
| Point | X (mm) | Y (mm) | Z (mm) |
|---|---|---|---|
| P11P11 | 20.0185 | 0.6118 | -35.0599 |
| P12P12 | 20.5333 | 0.4281 | -34.7572 |
| … | … | … | … |
| P95P95 | 27.8953 | -1.0300 | -41.5420 |
2.2 NURBS Surface Fitting
NURBS curves and surfaces were generated using the measured coordinates. A 3rd-degree NURBS surface was constructed using the formula:p(u,v)=∑i=0m∑j=0nwijNi,3(u)Nj,3(v)dij∑i=0m∑j=0nwijNi,3(u)Nj,3(v)p(u,v)=∑i=0m∑j=0nwijNi,3(u)Nj,3(v)∑i=0m∑j=0nwijNi,3(u)Nj,3(v)dij
where Ni,3(u)Ni,3(u) and Nj,3(v)Nj,3(v) are B-spline basis functions, wijwij are weights, and dijdij are control points. The reconstructed pinion and gear surfaces were imported into CATIA for 3D modeling.
3. Finite Element Model of Hypoid Gear
3.1 Meshing and Boundary Conditions
Hypermesh was used to generate a high-quality mesh, with refined elements near contact zones. Material properties for 20CrMnTi steel were assigned:
- Elastic modulus: 212,000 MPa
- Poisson’s ratio: 0.3
- Density: 7.8×10⁻⁵ kg/mm37.8×10−5kg/mm3
Boundary conditions included:
- Coupling constraints between gears and reference points.
- Fixed degrees of freedom except rotation about the axis.
- Contact settings: Surface-to-surface interaction with a friction coefficient of 0.1.
3.2 Load Application
A three-step loading process was implemented:
- Eliminate backlash: Apply a small rotation to the driving gear.
- Apply braking torque: 50 N·m on the driven gear.
- Constant speed: 100 rad/s on the driving gear.
4. Transmission Error Analysis
4.1 Definition of Transmission Error
TE was calculated as:TE=(φ2−φ2(0))−z1z2(φ1−φ1(0))TE=(φ2−φ2(0))−z2z1(φ1−φ1(0))
where φ1φ1 and φ2φ2 are actual rotations, φ1(0)φ1(0) and φ2(0)φ2(0) are initial rotations, and z1z1, z2z2 are tooth counts.
4.2 Comparison of Real vs. Theoretical Tooth Surfaces
- Theoretical surfaces: TE fluctuated around 0 with a smooth parabolic curve.
- Real surfaces: TE exhibited an average offset of 2.5×10−32.5×10−3 rad and锯齿状 fluctuations due to manufacturing imperfections.
Table 2: TE Amplitude Comparison
| Tooth Surface | TE Amplitude (μrad) |
|---|---|
| Theoretical | 3.68 |
| Real | 6.42 |
| Experimental | 6.63 |
5. Impact of Installation Errors
Four installation errors were analyzed:
- Pinion axial error (ΔHΔH): Displacement along the pinion axis.
- Gear axial error (ΔEΔE): Displacement along the gear axis.
- Offset error (ΔVΔV): Vertical misalignment.
- Shaft angle error (ΔΣΔΣ): Deviation from nominal shaft angle.
5.1 Sensitivity Ranking
Table 3: Sensitivity of TE to Installation Errors
| Error Type | Sensitivity Ranking |
|---|---|
| ΔΣΔΣ | 1st |
| ΔHΔH | 2nd |
| ΔVΔV | 3rd |
| ΔEΔE | 4th |
5.2 Key Observations
- ΔΣΔΣ: A 0.06° error increased TE amplitude by 28%.
- ΔHΔH: Positive errors reduced TE fluctuations, while negative errors exacerbated them.
- ΔVΔV: TE shifted linearly with offset, but fluctuations remained stable.
- ΔEΔE: Minimal impact due to negligible changes in meshing geometry.
6. Experimental Validation
The Gleason 600HTT rolling tester validated simulation results under controlled installation errors:
Table 4: TE Amplitude Under ΔV=±0.06 mmΔV=±0.06mm
| Tooth Surface | TE Amplitude (μrad) |
|---|---|
| Theoretical | 8.36 |
| Real | 10.95 |
| Experimental | 11.42 |
Table 5: TE Amplitude Under ΔH=±0.06 mmΔH=±0.06mm
| ΔHΔH | TE Amplitude (μrad) |
|---|---|
| +0.06 mm | 16.48 |
| -0.06 mm | 21.26 |
7. Conclusion
- Real tooth surfaces introduce higher TE amplitudes compared to theoretical models, validated by experimental data.
- Installation errors alter TE magnitude and fluctuation patterns. Shaft angle (ΔΣΔΣ) and pinion axial (ΔHΔH) errors are critical for NVH performance.
- Compensation strategies: Positive ΔHΔH and negative ΔΣΔΣ mitigate TE by counteracting surface imperfections.
This study provides actionable insights for optimizing hypoid gear design and assembly, enhancing durability and reducing noise in automotive applications. Future work will explore dynamic TE under varying loads and thermal effects.