
Herringbone gears are widely employed in heavy-duty transmission systems such as aero-engines, marine propulsors, and high-performance vehicles because of their high load-carrying capacity, smooth meshing action, and the ability to eliminate the axial force inherent in single helical gears. The continuous advancement of modern industrial systems demands higher reliability and lower noise from gear transmissions. To meet these requirements, it is essential to build a scientific vibration model of the herringbone gear transmission system, which allows the prediction of dynamic performance and the reduction of transmission noise at the design stage. In this thesis, I focus on the dynamic behavior of a herringbone gear pair and its gearbox, combining finite element simulations, lumped-parameter dynamic modeling, and experimental validation. The axial vibration characteristics of herringbone gears under different working conditions are investigated systematically.
1. Introduction
Gear transmission is one of the most common forms of mechanical power transmission due to its high efficiency, long service life, and compact structure. Among various gear types, herringbone gears—also called double-helical gears—consist of two helical gear sections with opposite helix angles on a single gear blank. This unique configuration cancels the net axial thrust, making herringbone gears particularly suitable for high-power and high-speed applications where bearing loads and noise must be minimized.
Compared with spur gears, herringbone gears have a larger contact ratio and smoother engagement, which reduces vibration and noise. However, due to manufacturing errors and misalignment, the left and right helical sections may not be perfectly symmetric, resulting in an unbalanced load distribution. This asymmetry, known as symmetry deviation, significantly affects the mesh stiffness and consequently the vibration response of the gear system. Therefore, understanding how symmetry deviation, tooth profile modification, torque, and speed affect the dynamic behavior of herringbone gears is of critical importance.
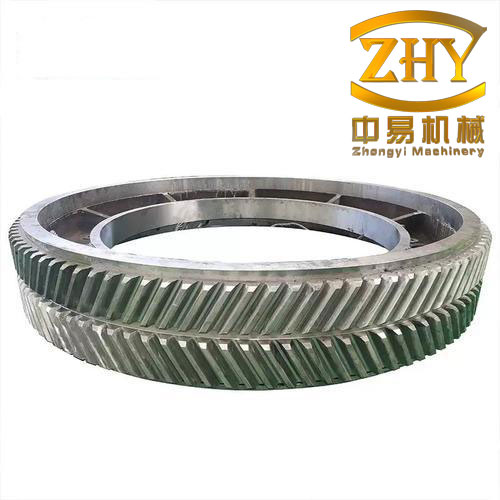
In this work, I first compute the time-varying mesh stiffness of herringbone gears using the finite element method. Then I establish a twelve-degree-of-freedom bending-torsion-axial coupled dynamic model that incorporates mesh stiffness, meshing impact, backlash, and mesh damping. The model is used to study the vibration responses in the radial and axial directions under various operating conditions. Subsequently, the gearbox finite element model is built, and its constrained modes are extracted. The bearing reaction forces obtained from the dynamic model are applied to the gearbox housing as excitation, and the modal superposition method is employed to compute the vibration response of the gearbox surface. Finally, a closed-power-flow test rig is designed and built to measure the axial vibrations of the gearbox under different speeds and torques. The experimental results are compared with theoretical predictions, showing good agreement and confirming the validity of the proposed analytical procedure.
2. Finite Element Calculation of Mesh Stiffness for Herringbone Gears
2.1 Definition of Mesh Stiffness
Mesh stiffness is defined as the ability of a pair of mating gear teeth to resist elastic deformation under a given normal load. It is one of the most important parameters in gear dynamics because the periodic variation of mesh stiffness acts as a parametric excitation that causes vibration and noise. The mesh stiffness of a gear pair can be expressed as
$$k_m(t) = \frac{F_n(t)}{\delta_n(t)}$$
where \(F_n(t)\) is the instantaneous normal contact force on the tooth flank, and \(\delta_n(t)\) is the total elastic deformation along the line of action. The total deformation includes bending deformation, shear deformation, Hertzian contact deformation, and the deformation of the gear body. For a herringbone gear pair, the total mesh stiffness is the sum of the stiffness contributions from the left and right helical gear sections:
$$k_m(t) = k_{m,L}(t) + k_{m,R}(t)$$
where \(k_{m,L}(t)\) and \(k_{m,R}(t)\) are the mesh stiffness of the left and right helical gear pairs, respectively.
2.2 Gear Parameters and Geometric Model
I used Pro/E (Creo) to build the three-dimensional solid model of a herringbone gear pair. The basic parameters are listed in Table 2.1.
| Parameter | Pinion | Wheel |
|---|---|---|
| Number of teeth | 27 | 81 |
| Normal module (mm) | 3.5 | 3.5 |
| Normal pressure angle (°) | 20 | 20 |
| Center distance (mm) | 218.2 | |
| Helix angle (°) | 30 | |
Because herringbone gears have complex involute helical tooth surfaces, high-quality finite element meshing is required to obtain accurate mesh stiffness results. The gear model was imported into HyperMesh for hexahedral mesh generation. The gear tooth region was partitioned carefully to obtain fully mapped hexahedral elements. The final meshed model of the herringbone gear pair is shown in the finite element analysis setup.
2.3 Effect of Symmetry Deviation on Mesh Stiffness
Symmetry deviation in herringbone gears refers to the axial displacement of the actual intersection point of the tooth trace on the pitch cylinder from the ideal central plane. This deviation causes an uneven load distribution between the left and right helical gear sections, commonly referred to as partial load. I evaluated three levels of symmetry deviation: \(f_A = 0\), \(10\,\mu\text{m}\), and \(20\,\mu\text{m}\). The finite element simulations were performed in Abaqus with surface-to-surface contact between the engaging teeth. The resulting mesh stiffness curves for the left and right sides are presented in Figures 2.1 and 2.2 (conceptual representation).
$$k_{m,L}(t) \text{ and } k_{m,R}(t) \text{ for different } f_A$$
It can be observed that the mesh stiffness of herringbone gears decreases as the symmetry deviation increases. This is because the partial load causes one side to carry more load while the other side is less engaged, leading to a higher local deformation and a reduction in the overall stiffness. Furthermore, the stiffness amplitudes of the left and right sides become increasingly different, with the more heavily loaded side exhibiting a larger stiffness. Figure 2.3 and Figure 2.4 illustrate the contact stress contour plots under partial load conditions, where the asymmetry of the contact stress distribution is clearly visible.
2.4 Effect of Tooth Profile Modification on Mesh Stiffness
Tooth profile modification is often applied to reduce the mesh stiffness fluctuation and dynamic load. I selected a parabolic profile modification (Walker curve) with the maximum modification amount \(\Delta_{max}\) and modification height \(h = 3\,\text{mm}\). The modification equation is
$$\Delta(x) = \Delta_{max}\left(\frac{x}{h}\right)^2$$
where \(x\) is the coordinate along the line of action measured from the modification start point. Three cases were studied: \(\Delta_{max} = 0\), \(5\,\mu\text{m}\), and \(10\,\mu\text{m}\). The computed mesh stiffness curves are shown in Figure 2.5. When \(\Delta_{max} = 5\,\mu\text{m}\), the mesh stiffness is slightly higher than that of the unmodified gear, which may be attributed to a more favorable contact pattern. When \(\Delta_{max} = 10\,\mu\text{m}\), the mesh stiffness amplitude decreases by about 0.95% compared with the unmodified case (from 2.011×10⁹ N/m to 1.992×10⁹ N/m). This indicates that profile modification can reduce mesh stiffness and potentially alleviate the dynamic excitation of herringbone gears.
3. Dynamic Model of the Herringbone Gear Transmission System
3.1 Modeling Methodology
The gear transmission system is a complex multi-body system. In this study, I employed the lumped-parameter method, ignoring the detailed connection between the shaft and the gear hub, and considered the gears as rigid bodies connected by springs and dampers at the meshing points and supports. The herringbone gear pair is modeled as two identical but opposite-hand helical gear pairs joined by an elastic shaft segment representing the central gap. The system is assumed to have twelve degrees of freedom: translational and rotational displacements of the four gear bodies (the left and right sections of the pinion and the wheel).
3.2 Twelve-DOF Dynamic Equations
Figure 3.1 shows the bending-torsion-axial coupled vibration model. The generalized displacement vector is defined as
$$\{\delta\} = \{y_1, z_1, \theta_1, y_2, z_2, \theta_2, y_3, z_3, \theta_3, y_4, z_4, \theta_4\}^\mathrm{T}$$
where \(y_i\) and \(z_i\) are the translational displacements of the center \(O_i\) in the \(y\)- and \(z\)-directions, respectively, and \(\theta_i\) is the torsional angular displacement. The subscripts 1 and 2 denote the left and right sections of the pinion, while 3 and 4 denote the left and right sections of the wheel. The dynamic equations are derived from Newton’s second law:
$$m_1 \ddot{y}_1 + c_{y1}\dot{y}_1 + k_{y1} y_1 = -F_{y1}$$
$$m_1 \ddot{z}_1 + c_{z13}(\dot{z}_1 – \dot{z}_3) + k_{z13}(z_1 – z_3) = -F_{z1}$$
$$I_1 \ddot{\theta}_1 = -F_{y1} R_{b1} + T_1 – F_{s1} R_{b1}$$
Similar equations are written for the other three gear bodies. The normal, tangential, and axial dynamic meshing forces for the left gear pair are
$$
\begin{aligned}
F_{n1} &= c_{m1}\left[\cos\beta_1(\dot{y}_1-\dot{y}_2+R_{b1}\dot{\theta}_1-R_{b2}\dot{\theta}_2) + \sin\beta_2(\dot{z}_1-\dot{z}_2)\right] \\
&\quad + k_{m1}\, f\left[\cos\beta_2(y_1-y_2+R_{b1}\theta_1-R_{b2}\theta_2) + \sin\beta_2(z_1-z_2+\varepsilon_z)\right] \\
F_{y1} &= \cos\beta_2\, F_{n1} \\
F_{z1} &= \sin\beta_2\, F_{n1}
\end{aligned}
$$
where \(\beta_1 = \beta\) and \(\beta_2 = -\beta\) are the helix angles of the left and right gear sections, \(R_{b1}\) and \(R_{b2}\) are the base circle radii of the pinion and wheel, \(c_{m1}\) and \(k_{m1}\) are the mesh damping and stiffness, \(f(\cdot)\) is the backlash function, and \(\varepsilon_z\) is the axial transmission error.
3.3 Key Parameters in the Dynamic Model
3.3.1 Mesh Damping
The time-varying mesh damping is given by
$$C_m(t) = 2\zeta\sqrt{\frac{k_m(t) I_p I_g}{r_{pb}^2 I_p + r_{gb}^2 I_g}}$$
where \(\zeta\) is the mesh damping ratio, \(I_p\) and \(I_g\) are the rotational inertias of the pinion and wheel, and \(r_{pb}\) and \(r_{gb}\) are their base circle radii.
3.3.2 Backlash Function
The backlash function \(f(x)\) is defined as
$$
f(x) =
\begin{cases}
x – \delta, & x > \delta \\
0, & |x| \leq \delta \\
x + \delta, & x < -\delta
\end{cases}
$$
where \(2\delta\) is the total backlash measured along the line of action. For the heavy-load conditions considered in this work, the influence of backlash is relatively small, but it was retained for generality.
3.3.3 Meshing Impact Force
The impact generated at the beginning of tooth engagement was calculated using the line-of-action impact theory. The impact velocity \(v_s\) at the initial contact point is derived from the geometric relationships:
$$v_s = \omega_1 r_{b1}\left(1+\frac{1}{i}\right)\left[1 – \frac{\cos(\lambda_1+\gamma_1′)}{\cos\alpha}\right]$$
where \(\omega_1\) is the input angular velocity, \(i\) is the gear ratio, and \(\lambda_1\), \(\gamma_1’\) are geometric angles related to the initial contact point. The maximum impact force is then
$$F_s = v_s \sqrt{\frac{J_1 J_2}{(J_1 r_{b2}’^2 + J_2 r_{b1}^2)(q_s + \cos^2\theta\, q_P)}}$$
where \(J_1\), \(J_2\) are the instantaneous moments of inertia of the two gears, \(q_s\) is the single-tooth pair compliance at the initial contact point, and \(q_P\) is the compliance of other tooth pairs in mesh.
3.4 Vibration Results from the Dynamic Model
The dynamic equations were solved numerically using the Runge-Kutta method. The system parameters are summarized in Table 3.1.
| Parameter | Pinion | Wheel |
|---|---|---|
| Mesh damping ratio \(\zeta\) | 0.1 | |
| Normal backlash \(2\delta\) (μm) | 180 | |
| Center distance mounting error (μm) | 8 | |
| Radial bearing stiffness (×10⁸ N/m) | 6.34 | 6.34 |
| Axial bearing stiffness (×10⁸ N/m) | — | 2.03 |
Figures 3.5–3.20 (not reproduced here) show the axial and radial displacement and velocity curves of the pinion and wheel under different symmetry deviations. Because the input speed and load torque are applied gradually, the transient responses in the first 0.02 s are discarded. The steady-state period from 0.02 s to 0.04 s is used for analysis.
It is observed that as the symmetry deviation increases, both the axial and radial vibration amplitudes increase. The pinion (active gear) exhibits larger vibration amplitudes than the wheel in both directions. The radial vibration shows the same trend as the axial vibration, confirming that the symmetry deviation affects the overall dynamic behavior of herringbone gears.
3.5 Influence of Operating Conditions
- Effect of meshing impact: The axial vibration velocity of the pinion was computed for load torques of 200, 250, and 300 N·m, considering only the meshing impact. The results show that higher torque leads to larger velocity fluctuations.
- Effect of load torque: With the speed held constant, increasing the load torque from 200 to 300 N·m causes a noticeable increase in the axial vibration velocity and its fluctuation amplitude.
- Effect of input speed: With a constant torque, increasing the input speed from 800 to 1500 r/min increases the axial vibration velocity. The fluctuation amplitude also grows with speed, indicating a stronger dynamic excitation at higher speeds.
4. Modal and Vibration Response Analysis of the Gearbox
4.1 Theoretical Background of Modal Superposition
For a multi-degree-of-freedom system with viscous damping, the equation of motion is
$$[M]\{\ddot{\delta}\} + [C]\{\dot{\delta}\} + [K]\{\delta\} = \{P(t)\}$$
After solving the eigenvalue problem \(([K]-\omega^2[M])\{X\}=\{0\}\), the modal matrix \([X]\) is used to decouple the equations. Using the modal transformation \(\{\delta\} = [X]\{q\}\), we obtain \(n\) independent single-degree-of-freedom equations:
$$\ddot{q}_i(t) + 2\zeta_i\omega_i\dot{q}_i(t) + \omega_i^2 q_i(t) = Q_i(t), \quad i=1,2,\ldots,n$$
where \(Q_i(t)\) is the modal force and \(\zeta_i\) is the modal damping ratio. The total response is then obtained by modal superposition.
4.2 Finite Element Model and Modal Analysis of the Gearbox
The gearbox housing is made of Q235A steel welded plates. Its three-dimensional model was created in Pro/E and meshed in HyperMesh. The material properties are listed in Table 4.1.
| Material | Density (kg/m³) | Elastic modulus (GPa) | Poisson’s ratio |
|---|---|---|---|
| Q235A | 7.85×10³ | 210 | 0.3 |
The mesh model is shown in Figure 4.2. The contact surfaces between the upper and lower housing were bonded to simulate bolted connections, and the bolt holes at the base were fully constrained. The first four constrained modes were extracted. Table 4.2 summarizes the natural frequencies and mode shape descriptions.
| Mode | Frequency (Hz) | Mode shape description |
|---|---|---|
| 1 | 248.24 | Axial sway |
| 2 | 447.29 | Box twisting |
| 3 | 608.32 | Base plate deformation |
| 4 | 620.89 | Twisting and axial sway |
4.3 Bearing Reaction Forces and Gearbox Vibration Response
Using the dynamic model developed in Chapter 3, the bearing reaction forces on the input and output shafts were obtained for the operating condition of 1000 r/min and 200 N·m. Only the steady-state data from 0.02 s to 0.04 s were used. The radial and axial reaction forces are shown as periodic curves, as expected from the periodic tooth meshing. Due to the symmetry deviation and the different dimensions of the pinion and wheel, the reaction forces on the active shaft are larger than those on the driven shaft.
These bearing reaction forces were applied as excitation loads at the bearing seat reference points on the gearbox housing. Two reference points were chosen—one on the active shaft bearing seat and one on the driven shaft bearing seat—as illustrated conceptually in Figure 4.8. The vibration displacement and velocity responses along the radial and axial directions at these points were computed using modal superposition.
Figures 4.9–4.16 display the radial and axial vibration displacement and velocity curves. The key observations are:
- The active shaft bearing seat exhibits larger vibration amplitudes than the driven shaft seat, consistent with the larger bearing reaction forces.
- The radial vibration amplitudes at the bearing seats are generally larger than the axial ones, which is related to the gear mesh force direction and the local stiffness of the housing ribs.
- The axial vibration of the gearbox surface is also significant due to the axial excitation introduced by the helix angle and the symmetry deviation.
5. Experimental Study on Vibration Characteristics of Herringbone Gears
5.1 Test Rig Design
To verify the theoretical models, I designed and built a closed-power-flow test rig for herringbone gear transmissions. The closed-loop configuration allows energy recycling and provides a continuous and controllable load without consuming excessive power. The main components of the test rig are:
- TCT1000 control system: Executes test cycles, collects torque and speed signals, and controls the motors in closed-loop mode.
- Drive motor: A variable-frequency motor provides the input power to the tested gearbox.
- Load motor: Another motor applies the load torque; it can also be used as an auxiliary drive.
- Torque/speed transducers: Measure the input and output torques and speeds to compute efficiency and dynamic performance.
- Vibration sensors: Velocity sensors (CYT9200) with a measurement range of 0–50 mm/s and a sampling frequency of 2000 Hz were mounted on the gearbox housing close to the bearings.
The test rig is shown schematically in Figure 5.1. The measurement points were located at three positions on the input shaft bearing housing: 90°, 180°, and 270° around the shaft axis (designated A, B, and C).
5.2 Test Procedures
The experiments were performed in the following sequence:
- At a constant torque, the input speed was varied from 800 to 1200 and then 1500 r/min. At each speed, 50 samples of vibration data were recorded.
- The vibration sensor was moved to the next measurement point, and the speed sweep was repeated.
- At a constant speed of 1000 r/min, the load torque was increased stepwise from 100 to 200, 270, 300, 350, and 400 N·m. Vibration data were saved at each steady torque level.
- To study the effect of symmetry deviation, a herringbone gear pair with known symmetry error was installed in the gearbox, and the same speed and torque sweeps were repeated.
5.3 Experimental Results and Comparison
5.3.1 Effect of Symmetry Deviation on Axial Vibration
Figure 5.3 shows the axial vibration velocity measured at the three different sensor positions for speeds of 800, 1200, and 1500 r/min. At lower speeds, the vibration velocity does not change significantly with the sensor position. However, at 1500 r/min, the vibration velocity increases noticeably as the sensor moves from position A to C. This indicates that under partial load caused by symmetry deviation, the axial vibration of the gearbox becomes more sensitive to the measurement position at higher speeds.
5.3.2 Effect of Rotational Speed
Figure 5.4 compares the axial vibration velocity for three speeds at a constant torque. As the speed increases from 800 to 1500 r/min, the vibration velocity increases. At 1500 r/min, the fluctuation amplitude is largest, indicating a stronger dynamic excitation and possibly a resonance near one of the system natural frequencies.
5.3.3 Effect of Torque
Figure 5.5 shows the axial vibration velocity at a constant speed of 1000 r/min for different torque levels. The vibration velocity grows monotonically with torque, and the fluctuation amplitude also increases, which is consistent with the theoretical prediction that higher load leads to larger dynamic meshing forces.
5.3.4 Model Validation
For the operating condition of 1000 r/min and 200 N·m, the predicted axial vibration velocity was compared with the measured data. Figure 5.6 shows the measured and predicted response curves. Although there is a small discrepancy in amplitude, the overall shapes and the dominant frequency components agree very well. The minor differences may be attributed to the simplified treatment of the bearing supports and the neglect of the gearbox flexibility in the dynamic model. Nevertheless, the reasonable agreement confirms the validity of the proposed analytical approach for analyzing the vibration characteristics of herringbone gears.
6. Conclusions and Outlook
In this thesis, I have presented a comprehensive investigation of the vibration characteristics of herringbone gears under variable operating conditions. The main conclusions are as follows:
- The finite element analysis revealed that the mesh stiffness of herringbone gears decreases with increasing symmetry deviation, leading to a more uneven load distribution between the left and right helical gear sections. A parabolic tooth profile modification can reduce the mesh stiffness amplitude and help stabilize the dynamic response.
- A twelve-degree-of-freedom bending-torsion-axial dynamic model was established to predict the vibration responses of herringbone gears. The simulation results show that both radial and axial vibrations increase with symmetry deviation, torque, and speed. The pinion generally vibrates more than the wheel.
- The gearbox modal analysis showed that the first four natural frequencies range from 248.24 Hz to 620.89 Hz. The vibration response calculation using the bearing reaction forces as excitation indicated that the active shaft bearing seat has larger vibration amplitudes than the driven shaft seat, and the radial vibrations are more prominent at the rib-reinforced bearing locations.
- A closed-power-flow test rig was built and used to measure the axial vibrations of the gearbox under various speeds and torques. The experimental results confirm the theoretical trends: vibration velocity increases with speed and torque, and the presence of symmetry deviation amplifies the axial vibration, especially at high speeds. The measured and predicted responses show reasonable agreement, thus validating the dynamic model.
During this work, I also identified several potential improvements for future research:
- The mesh stiffness calculation can be made more efficient by developing a parametric finite element model with a dedicated subroutine for automatic mesh generation and stiffness extraction.
- Acoustic analysis using the boundary element method could be integrated to predict the noise radiation from the gearbox surface, providing a more complete vibro-acoustic assessment.
- The current dynamic model assumes the pinion is axially floating and the wheel is axially constrained. This configuration is suitable for low- and medium-speed applications. For high-speed aerospace transmissions, additional effects such as gyroscopic moments and flexible shaft dynamics should be incorporated.
In summary, this study offers a systematic framework for analyzing and experimentally validating the vibration characteristics of herringbone gears, which can be applied in the design and optimization of low-noise, high-reliability gear transmission systems.