
In the field of industrial robotics, the RV reducer plays a critical role due to its high transmission ratio, compact structure, and efficiency. As a core component in precision motion control, understanding the vibration characteristics of the RV reducer is essential for improving reliability and performance. This article delves into the vibration behavior of the RV reducer through a combination of simulation and experimental studies, focusing on modal analysis, rigid-flexible coupled dynamics, and the effects of operational parameters like speed and load.
The RV reducer, short for Rotary Vector reducer, consists of a two-stage transmission system: a primary gear stage (involute gear pair) and a secondary cycloidal-pin wheel stage. This design enables high torque transmission with minimal backlash, making it ideal for robotic joints. However, the complex interaction of multiple components, such as gears, cycloidal discs, eccentric shafts, and pins, can lead to vibrational issues that affect longevity and accuracy. Thus, analyzing the vibration characteristics of the RV reducer is paramount for predictive maintenance and design optimization.
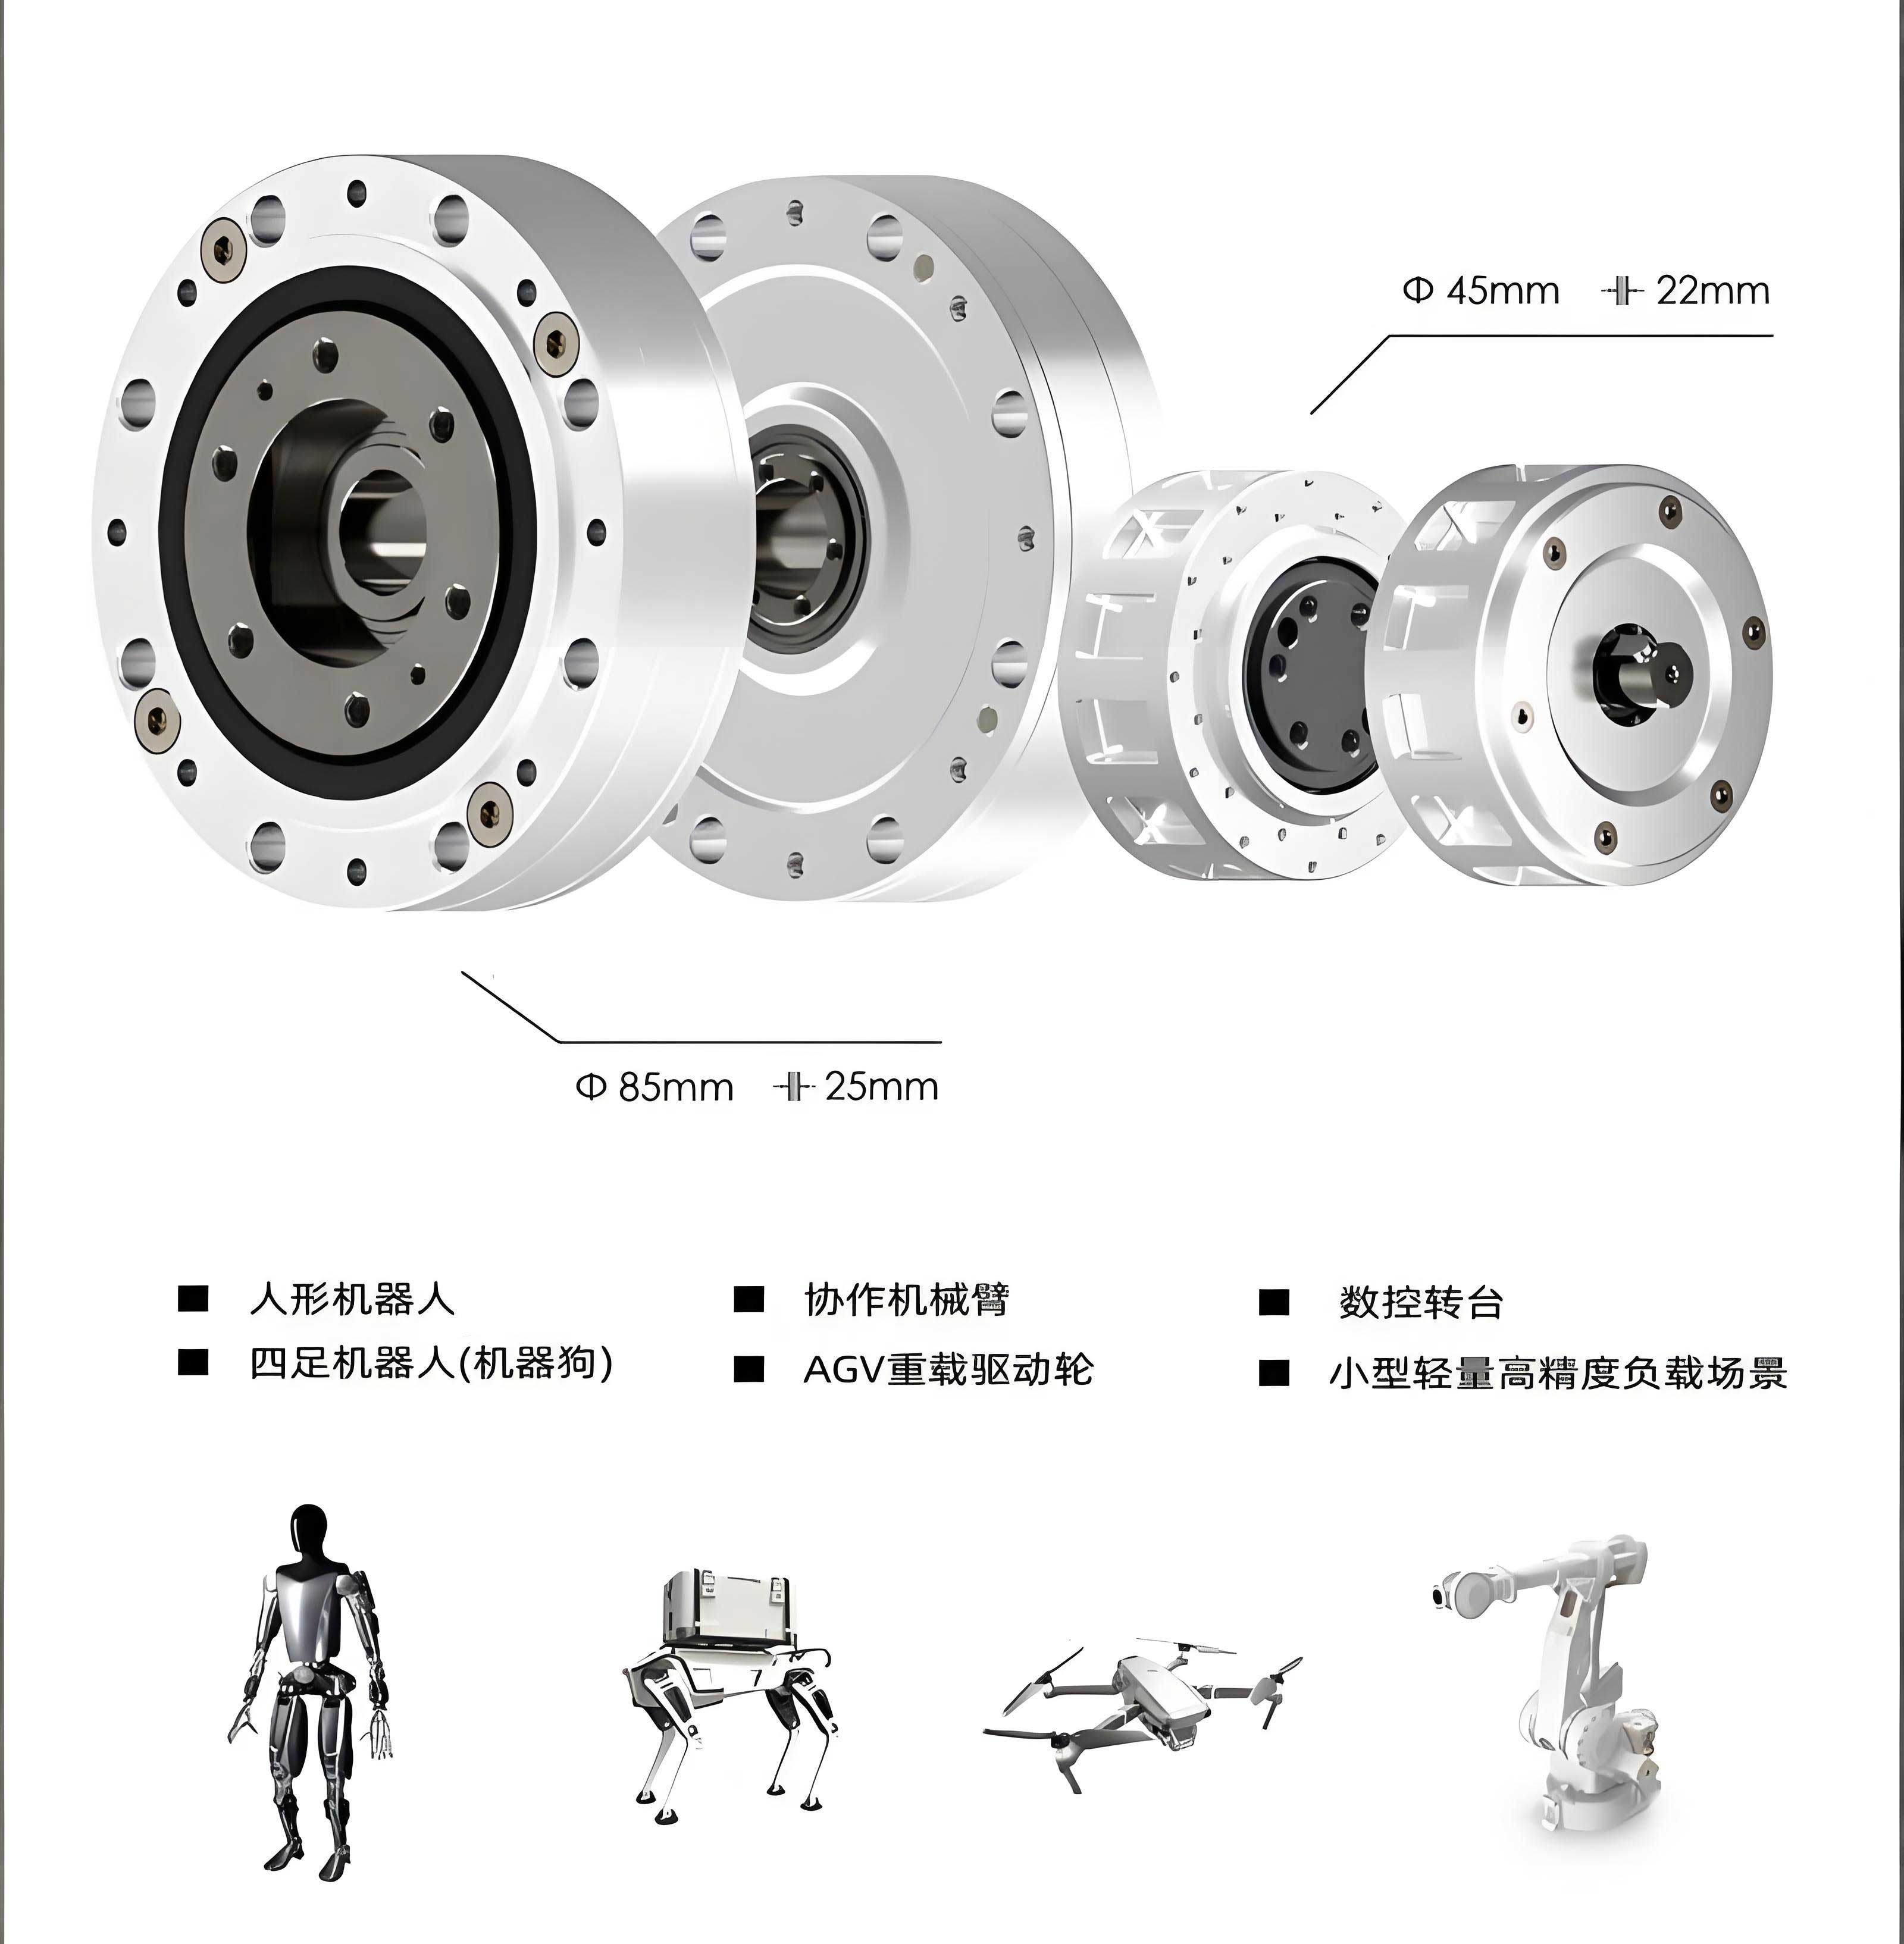
To investigate these characteristics, a comprehensive approach is adopted, involving finite element analysis (FEA), multi-body dynamics, and experimental validation. The study begins with modal analysis to identify natural frequencies and mode shapes, followed by transient dynamics simulations using a rigid-flexible coupled model. This model accounts for nonlinear factors like contact deformation, friction, and flexibility of key parts, providing a realistic representation of the RV reducer’s behavior under various conditions. Experimental tests are conducted on a dedicated vibration test stand to corroborate simulation results, ensuring accuracy and applicability.
The primary objectives of this work are to: (1) establish a validated virtual prototype of the RV reducer using advanced modeling techniques, (2) analyze its modal properties and transient vibration responses, and (3) evaluate the influence of rotational speed and load on vibration amplitudes and frequency spectra. By achieving these goals, insights are gained into the dynamic performance of the RV reducer, aiding in the development of more robust and quieter systems for industrial applications.
Theoretical Background
The vibration analysis of the RV reducer relies on fundamental principles of structural dynamics and multi-body systems. Key theories include modal analysis for determining inherent vibrational modes and rigid-flexible coupled dynamics for simulating transient responses under operational loads.
Modal Analysis
Modal analysis is a technique used to characterize the dynamic properties of a structure by identifying its natural frequencies, damping ratios, and mode shapes. For a linear system, the equation of motion can be expressed as:
$$ M \ddot{u} + C \dot{u} + K u = F $$
where \( M \) is the mass matrix, \( C \) is the damping matrix, \( K \) is the stiffness matrix, \( u \) is the displacement vector, and \( F \) is the external force vector. In free vibration analysis, where \( F = 0 \), and neglecting damping for simplicity, the equation reduces to:
$$ M \ddot{u} + K u = 0 $$
Assuming harmonic motion \( u = \phi e^{i \omega t} \), where \( \phi \) is the mode shape and \( \omega \) is the angular frequency, the eigenvalue problem is formulated as:
$$ (K – \omega^2 M) \phi = 0 $$
Solving this yields eigenvalues \( \omega_i^2 \) and eigenvectors \( \phi_i \), corresponding to the natural frequencies and mode shapes of the RV reducer. These parameters are crucial for understanding resonant conditions and structural weaknesses.
Rigid-Flexible Coupled Dynamics
For transient vibration analysis, a rigid-flexible coupled approach is employed to model the RV reducer. This method combines rigid bodies (e.g., housing, planetary carrier) with flexible bodies (e.g., cycloidal discs, gears, eccentric shafts) to capture nonlinear interactions like contact and friction. The dynamics of such a system are described by coupled equations that are solved using numerical integration techniques like the Craig-Bampton method.
The Craig-Bampton transformation decouples the system by partitioning degrees of freedom into boundary and internal modes. The displacement vector \( u \) is expressed as:
$$ u = \Phi_{cb} \begin{bmatrix} x \\ q \end{bmatrix} = \begin{bmatrix} I & 0 \\ \Phi_R & \Phi_L \end{bmatrix} \begin{bmatrix} x \\ q \end{bmatrix} $$
where \( \Phi_{cb} \) is the Craig-Bampton transformation matrix, \( x \) represents boundary displacements, \( q \) are modal coordinates, \( \Phi_R \) is the rigid-body mode matrix, and \( \Phi_L \) is the constrained mode matrix. Applying this transformation, the mass and stiffness matrices become:
$$ M_{cb} = \Phi_{cb}^T M \Phi_{cb} = \begin{bmatrix} M_{bb} & M_{bq} \\ M_{qb} & M_{qq} \end{bmatrix} $$
$$ K_{cb} = \Phi_{cb}^T K \Phi_{cb} = \begin{bmatrix} K_{bb} & 0 \\ 0 & K_{qq} \end{bmatrix} $$
The equation of motion is then:
$$ M_{cb} \begin{bmatrix} \ddot{x} \\ \ddot{q} \end{bmatrix} + K_{cb} \begin{bmatrix} x \\ q \end{bmatrix} = \Phi_{cb}^T F $$
This formulation allows efficient simulation of the RV reducer’s dynamic response, including vibration accelerations, under varying operational conditions.
Virtual Prototype Modeling and Simulation
To analyze the vibration characteristics of the RV reducer, a detailed virtual prototype is developed using CAD software and finite element analysis tools. The model is based on an RV-20E type reducer with specifications: cycloidal disc teeth = 39, pin wheel teeth = 40, sun gear teeth = 12, planetary gear teeth = 42, pressure angle = 20°, module = 1 mm, and eccentricity = 1 mm.
Model Assembly and Simplification
The RV reducer assembly includes components such as the sun gear, planetary gears, planetary carrier, eccentric shafts, cycloidal discs, and pin wheels. For computational efficiency, minor features like fillets and threads are omitted, as they have negligible impact on global vibration behavior. Key assumptions include:
- The planetary carrier is treated as a rigid body due to its high stiffness.
- Flexible bodies are assigned to the cycloidal discs, gears, eccentric shafts, and pins to account for deformations.
- Contact pairs are defined between mating surfaces, with friction coefficients set to 0.1 for gear contacts and 0.08 for cycloidal-pin contacts.
- Bearings are simulated using bushing elements with stiffness values derived from FEA (e.g., planetary carrier bearing stiffness = 9.64 × 10^8 N/m).
The mesh is generated using tetrahedral elements, with refinement at contact zones to ensure accuracy. The final model comprises 147,368 elements and 317,875 nodes, balancing detail and computational cost.
Model Validation via Grey Correlation Analysis
Prior to dynamic simulations, the virtual prototype is validated by comparing its kinematic output with theoretical values. Grey correlation analysis is used to quantify the similarity between simulated and expected results. For an input speed of 200 rpm and load of 60 N·m, the output speed stabilizes around 1.41 rpm, matching the theoretical reduction ratio of 141. The grey correlation coefficient \( r \) is calculated as:
$$ r = \frac{1}{N} \sum_{i=1}^{N} \rho_i $$
where \( \rho_i \) is the grey relational coefficient for data points, given by:
$$ \rho_i = \frac{\min |x_i – y_i| + \xi \max |x_i – y_i|}{|x_i – y_i| + \xi \max |x_i – y_i|} $$
with \( \xi = 0.5 \) as the distinguishing coefficient. For speeds of 200, 400, and 600 rpm, correlation values of 0.800, 0.822, and 0.887 are obtained, all exceeding 0.5, confirming model accuracy.
Modal Analysis of the RV Reducer
Constrained modal analysis is performed on the RV reducer assembly to determine natural frequencies and mode shapes. The model is fixed at mounting points to mimic real installation. Material properties are assigned as per Table 1.
| Component | Material | Young’s Modulus (GPa) | Density (kg/m³) | Poisson’s Ratio |
|---|---|---|---|---|
| Cycloidal Disc | 20CrMo | 219 | 7830 | 0.3 |
| Pin | GCr15 | 206 | 7900 | 0.3 |
| Pin Wheel | QT450 | 169 | 7050 | 0.257 |
| Gears | Alloy Steel | 210 | 7850 | 0.3 |
| Eccentric Shaft | Carbon Steel | 200 | 7800 | 0.3 |
The first six natural frequencies and corresponding mode shapes are listed in Table 2. Results indicate that the eccentric shaft and cycloidal discs are prone to torsional and bending vibrations, which can influence the overall vibration signature of the RV reducer.
| Mode | Frequency (Hz) | Mode Shape Description |
|---|---|---|
| 1 | 697.25 | Torsional vibration of eccentric shaft about central axis |
| 2 | 1772.6 | Torsional vibration of planetary carrier |
| 3 | 4707.2 | Radial vibration of planetary carrier and cycloidal disc in vertical direction |
| 4 | 5006.0 | Radial vibration of planetary carrier and cycloidal disc in horizontal direction |
| 5 | 5924.7 | Bending vibration of eccentric shaft in horizontal direction |
| 6 | 6254.4 | Bending vibration of planetary carrier in horizontal direction |
Transient Dynamics Simulation
Transient dynamic simulations are conducted to obtain vibration acceleration signals under different operational conditions. Input speeds of 200, 400, and 600 rpm are applied to the sun gear, with loads of 0, 60, and 120 N·m on the planetary carrier. Simulation time is set to 0.2 s with a step size of 0.0002 s, capturing steady-state responses after initial transients. Acceleration data is extracted from a node (ID: 102898) on the housing, representing typical measurement points.
The governing equation for transient response is:
$$ M \ddot{u} + C \dot{u} + K u = F(t) $$
where \( F(t) \) includes time-varying forces from gear meshing and contact interactions. Results are processed to generate time-domain waveforms and frequency spectra via Fast Fourier Transform (FFT). Sample plots for 400 rpm and 60 N·m are shown in subsequent sections, highlighting key vibrational features of the RV reducer.
Experimental Validation
To validate simulation findings, experimental tests are performed on a dedicated vibration test stand. The setup includes a servo motor driving the RV reducer, a torque sensor, an encoder, and a magnetic powder brake for loading. Acceleration sensors are mounted on the reducer housing to measure vibrations in horizontal and vertical directions.
Test Equipment and Methodology
The test stand components are summarized in Table 3. A capacitive accelerometer (model 1C102) with sensitivity 20 mV/(m/s²) and frequency range 0–1000 Hz is used. Sensors are attached via adhesive at positions corresponding to simulation nodes, as illustrated in Figure 1 (inserted earlier). Data acquisition is at 2000 Hz sampling rate, ensuring capture of relevant frequency components.
| Component | Model | Function |
|---|---|---|
| Servo Motor | SGM7A-15AFA61 | Drive input |
| RV Reducer | SHPR-20E | Test specimen |
| Torque Sensor | JN338-AE | Load measurement |
| Encoder | BCE94BK30 | Speed feedback |
| Magnetic Brake | CZ-50 | Applied load |
Tests cover input speeds of 200, 300, 400, 500, and 600 rpm, each under loads of 0, 30, 60, 90, and 120 N·m. Three independent runs per condition ensure statistical reliability. Acceleration signals are recorded and averaged for comparison with simulation results.
Results and Discussion
The vibration characteristics of the RV reducer are analyzed through comparative studies of simulation and experimental data. Focus areas include root mean square (RMS) values, frequency spectra, and the effects of speed and load.
Feature Analysis: RMS Values
RMS acceleration is computed as a measure of overall vibration intensity. For both simulated and experimental signals, RMS values increase with speed and load, as shown in Table 4. The maximum relative error between simulation and experiment is 12.9% at 200 rpm and 0 N·m, indicating good agreement. This validates the rigid-flexible coupled model of the RV reducer.
| Load (N·m) | Speed (rpm) | Simulation RMS (m/s²) | Experiment RMS (m/s²) | Relative Error (%) |
|---|---|---|---|---|
| 0 | 200 | 0.035 | 0.031 | 12.9 |
| 400 | 0.096 | 0.104 | 8.7 | |
| 600 | 0.193 | 0.209 | 7.7 | |
| 60 | 200 | 0.086 | 0.079 | 8.8 |
| 400 | 0.129 | 0.140 | 8.9 | |
| 600 | 0.265 | 0.273 | 3.0 | |
| 120 | 200 | 0.087 | 0.092 | 5.6 |
| 400 | 0.186 | 0.174 | 6.8 | |
| 600 | 0.343 | 0.323 | 6.2 |
The RMS trend can be modeled empirically. For instance, at constant load, RMS approximates a quadratic function of speed, reflecting increased dynamic forces. Similarly, at constant speed, RMS rises linearly with load due to heightened contact stresses in the RV reducer.
Frequency Spectrum Analysis
Frequency spectra reveal dominant peaks associated with meshing frequencies and structural resonances. The gear meshing frequency \( f_m \) is given by:
$$ f_m = \frac{N \times \text{input speed (rps)}}{60} $$
where \( N \) is the number of teeth on the driving gear. For the primary stage (sun gear with 12 teeth), \( f_m \) ranges from 40 Hz at 200 rpm to 120 Hz at 600 rpm. However, major peaks in experimental spectra occur around 236.4 Hz, 317.8 Hz, and 427.5 Hz, corresponding to modes of the cycloidal stage and eccentric shaft vibrations. Simulation peaks at 239.9 Hz, 317.3 Hz, and 411.7 Hz show close alignment, as detailed in Table 5.
| Condition (Speed, Load) | Experimental Peaks (Hz) | Simulation Peaks (Hz) | Remarks |
|---|---|---|---|
| 200 rpm, 60 N·m | 236.4, 317.8, 427.5 | 239.9, 317.3, 411.7 | Good match; minor shifts due to modeling assumptions |
| 400 rpm, 60 N·m | 236.4, 317.8, 427.5 | 239.9, 317.3, 411.7 | Peaks consistent across speeds, indicating structural origins |
| 600 rpm, 60 N·m | 236.4, 317.8, 427.5 | 239.9, 317.3, 411.7 | Amplitudes increase with speed, but frequencies remain stable |
The consistency of peak frequencies across speeds suggests they are linked to modal properties of the RV reducer, such as eccentric shaft torsion (∼697 Hz) and carrier bending (∼1773 Hz), rather than excitation frequencies. This underscores the importance of modal analysis in vibration control for the RV reducer.
Influence of Operational Parameters
Effect of Load on RV Reducer Vibration
Load variations primarily affect vibration amplitudes rather than frequency content. As load increases from 0 to 120 N·m at 400 rpm, the peak amplitude near 320 Hz grows linearly, as quantified in Table 6. This is attributed to increased contact forces between cycloidal discs and pins, enhancing harmonic excitation. However, the fundamental spectrum shape remains unchanged, implying that load-induced vibrations are subcritical to structural resonances in the RV reducer.
| Load (N·m) | Peak Amplitude (m/s²) – Experiment | Peak Amplitude (m/s²) – Simulation |
|---|---|---|
| 0 | 0.15 | 0.14 |
| 30 | 0.18 | 0.17 |
| 60 | 0.22 | 0.21 |
| 90 | 0.25 | 0.24 |
| 120 | 0.28 | 0.27 |
The linear relationship can be expressed as:
$$ A = k L + A_0 $$
where \( A \) is amplitude, \( L \) is load, \( k \) is a proportionality constant, and \( A_0 \) is amplitude at no load. For the RV reducer, \( k \approx 0.0011 \, \text{m/s}^2 per N·m} \) based on experimental data.
Effect of Speed on RV Reducer Vibration
Speed has a pronounced impact on both amplitude and frequency distribution. As speed rises from 200 to 600 rpm, RMS values increase exponentially, and higher harmonics become more prominent in spectra. This is due to increased inertial forces and meshing impacts, which excite broader frequency ranges. The vibration energy \( E \) can be approximated as:
$$ E \propto \omega^2 $$
where \( \omega \) is angular speed. Thus, doubling speed quadruples vibration energy, explaining the significant RMS growth. Additionally, speed-related excitations may approach natural frequencies, potentially causing resonance in the RV reducer, though this was not observed within the tested range.
Comparative plots show that at 600 rpm, vibration amplitudes are substantially higher than at 200 rpm, with more complex spectral content. This highlights speed as a critical factor in vibration management for the RV reducer, necessitating careful design to avoid resonant conditions during operation.
Conclusions
This study comprehensively analyzes the vibration characteristics of the RV reducer through integrated simulation and experimental approaches. Key findings are summarized as follows:
- Model Validation: A rigid-flexible coupled dynamic model of the RV reducer is developed and validated using grey correlation analysis, showing high accuracy with correlation coefficients above 0.8. This model effectively captures nonlinear interactions like contact and friction, making it suitable for vibration prediction.
- Modal Insights: Constrained modal analysis identifies natural frequencies and mode shapes of the RV reducer, with the first six modes ranging from 697 Hz to 6254 Hz. Torsional vibrations of the eccentric shaft and bending of the planetary carrier are dominant, informing design improvements for vibration suppression.
- Vibration Responses: Transient dynamics simulations yield acceleration signals that align well with experimental measurements. RMS values increase with both speed and load, but speed has a more substantial effect, causing exponential growth in vibration intensity.
- Spectral Features: Frequency spectra reveal persistent peaks around 236 Hz, 318 Hz, and 428 Hz, associated with structural modes rather than meshing frequencies. These peaks are consistent across speeds and loads, emphasizing the role of inherent dynamics in the RV reducer’s vibration signature.
- Parameter Effects: Load primarily influences vibration amplitudes linearly, without altering frequency content. In contrast, speed significantly affects both amplitude and spectral complexity, highlighting the need for speed-dependent vibration control strategies in RV reducer applications.
Future work could explore advanced materials, damping techniques, or real-time monitoring systems to mitigate vibrations in the RV reducer. The methodologies established here provide a foundation for further research into fault diagnosis, condition monitoring, and optimization of RV reducers in robotic and industrial settings.