
In our study, we focused on the dynamic behavior of herringbone gear transmission systems, aiming to effectively analyze vibration transmission characteristics and reasonably predict gearbox structural vibration and noise. We established a finite element model of the gearbox that accounts for fluid–solid coupling of the lubricating oil inside the housing. Time-varying dynamic loads, computed from our previous work and distributed to each supporting bearing, were applied at the coupling reference points at the centers of the bearing holes on the housing. Using the transient dynamic analysis module in ANSYS, we performed dynamic response analysis of the gearbox and predicted the structural vibration accelerations at selected nodes. An improved adaptive genetic algorithm was employed for three-dimensional tooth surface optimization of the pinion, targeting multiple dynamic objectives. The optimization results demonstrated significant reductions in both the relative vibration acceleration along the tooth meshing line direction and the structural vibration acceleration at the gearbox foot reference point under the specified load condition. We constructed a closed-power-flow test rig for the herringbone gear transmission system. High-precision Heidenhain angle encoders were used to measure the relative vibration along the tooth meshing line direction, while accelerometers measured vibration accelerations at the bearing seats and gearbox feet. These experiments validated the vibration transmission theory and the effectiveness of three-dimensional tooth surface modification in reducing vibrations.
Introduction
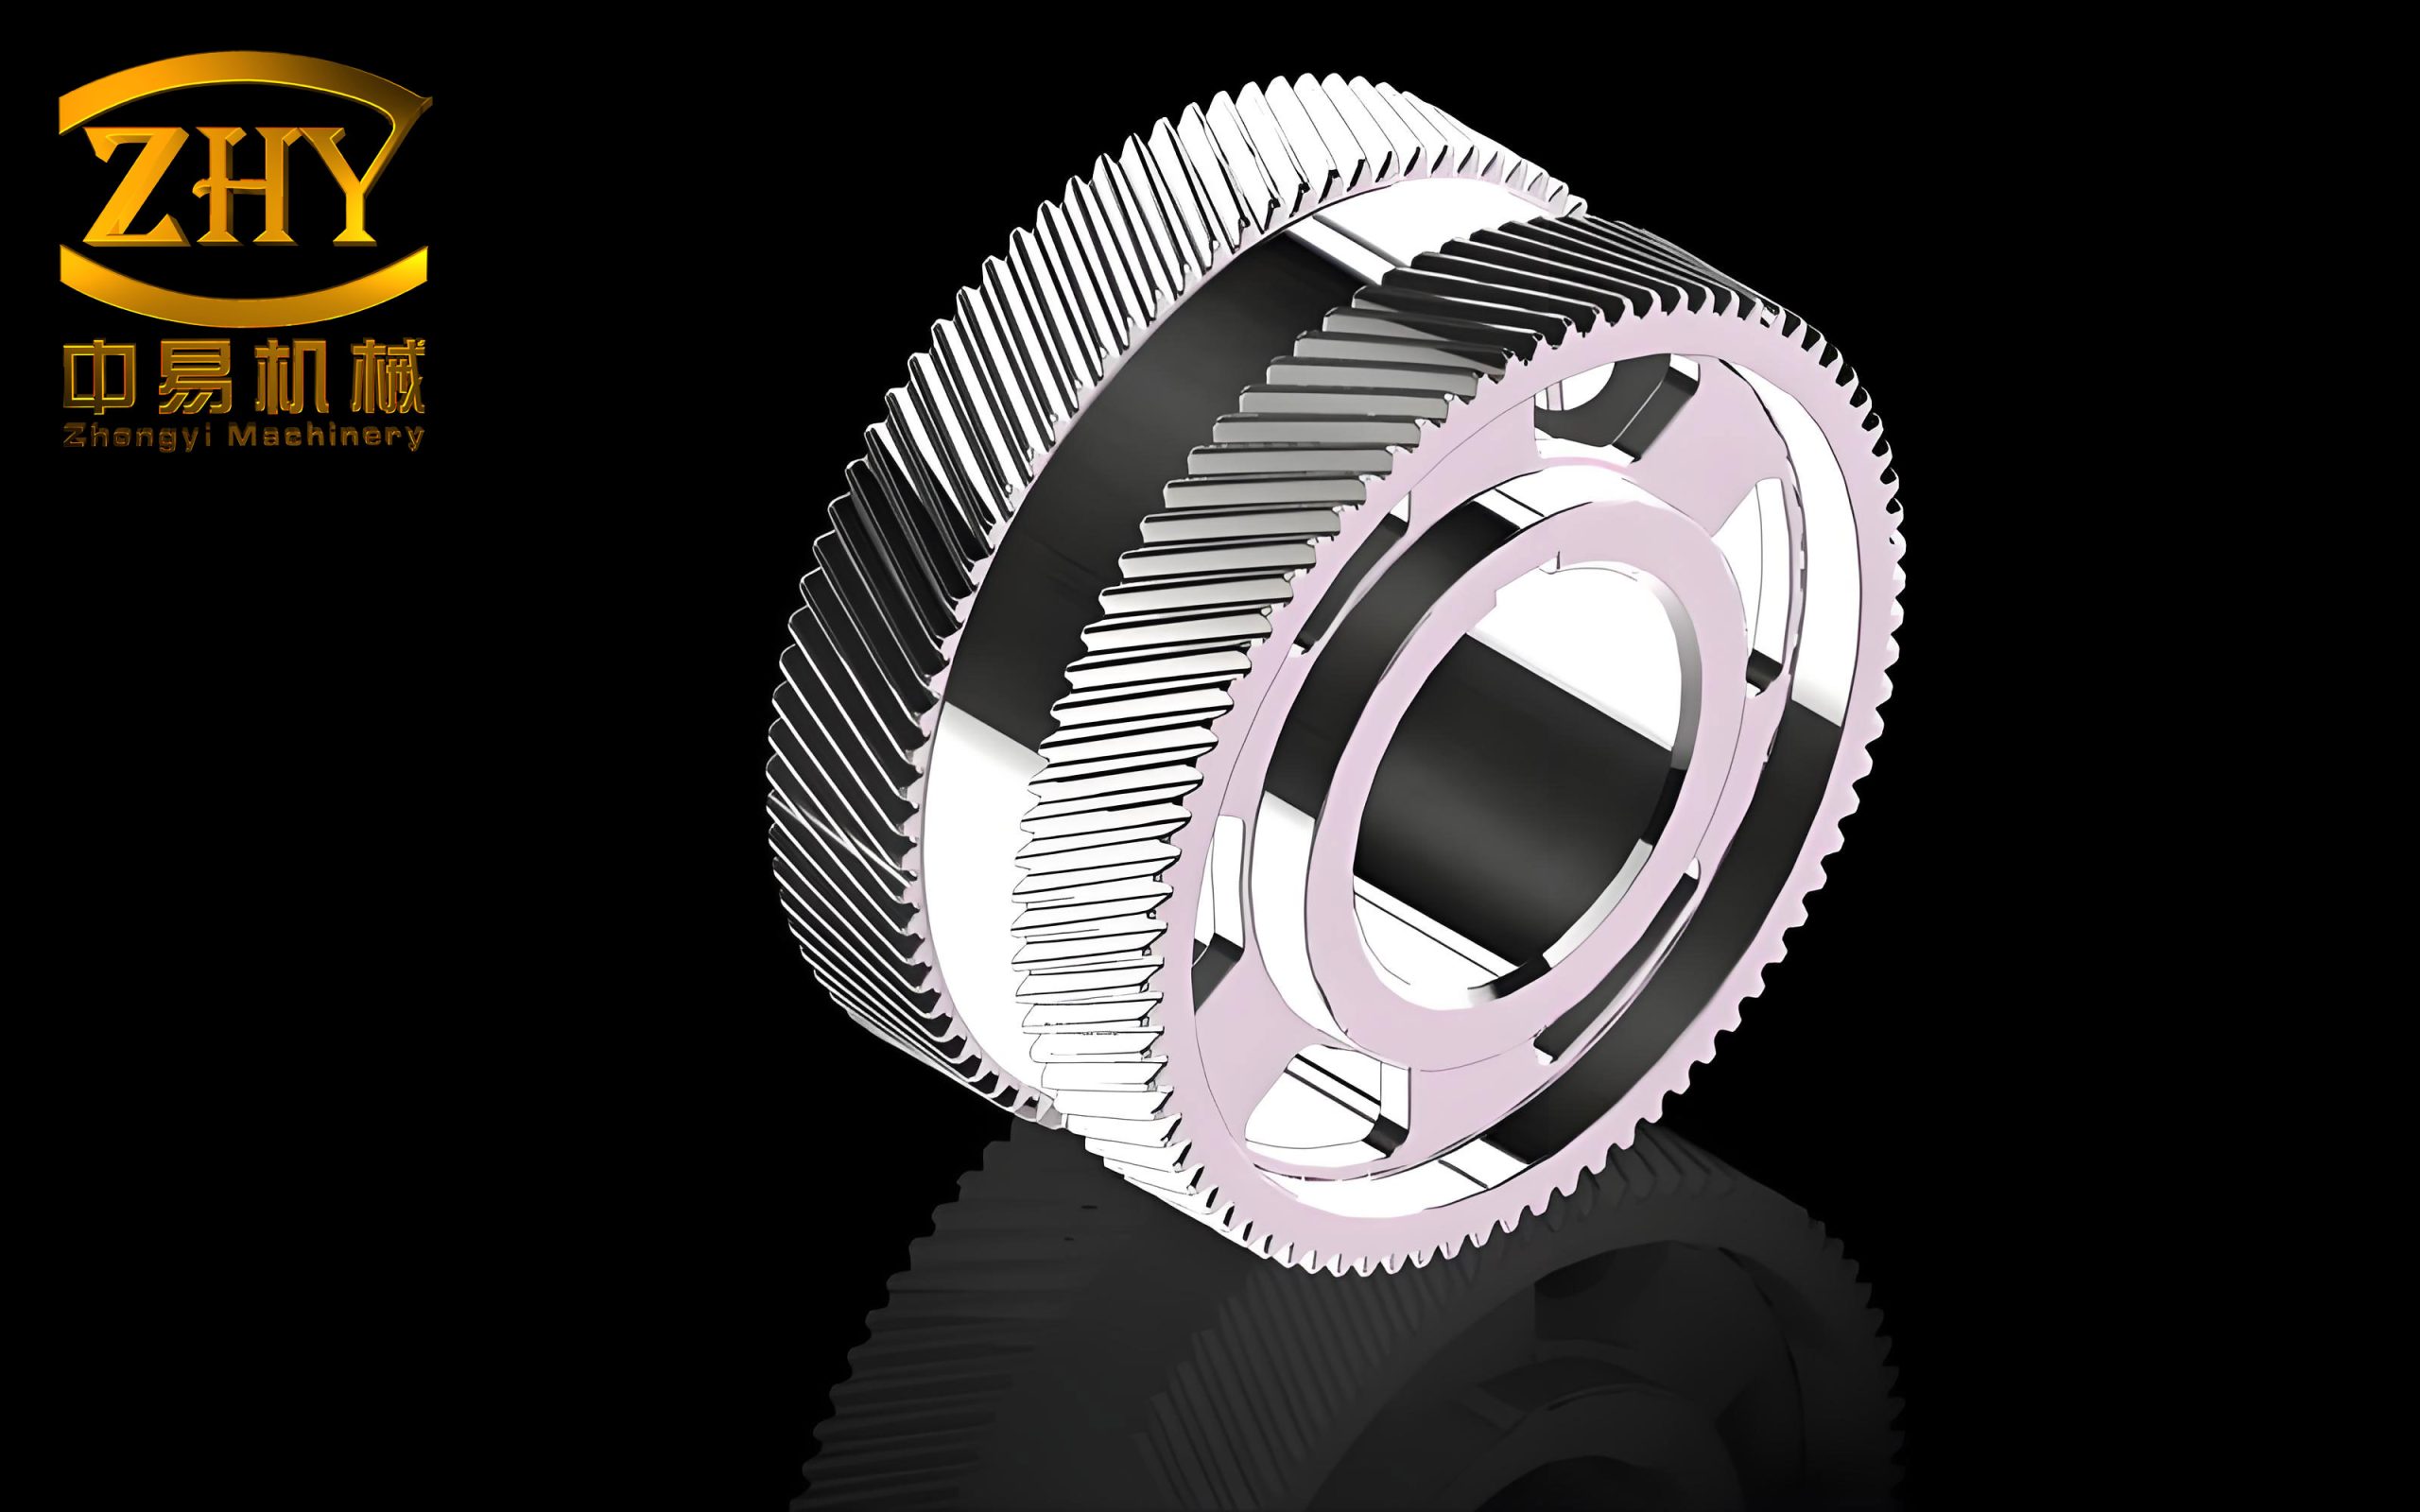
Herringbone gears (double helical gears) are widely used in large marine vessels, heavy machinery, and other demanding applications due to their high load-carrying capacity, smooth transmission, and ability to cancel axial thrust forces. Despite their higher manufacturing cost compared with spur or single helical gears, their superior performance justifies their use in critical drivetrains. Understanding the vibration transmission path—from the gear meshing excitation through the shafts, bearings, and finally to the gearbox housing—is essential for controlling noise and vibration. In this paper, we present a comprehensive study that encompasses theoretical modeling, numerical simulation, tooth surface optimization, and experimental validation, all centered on herringbone gears.
Internal Excitation Factors in Herringbone Gear Meshing
Multiple excitation sources contribute to the vibration of herringbone gear systems. The primary factors include time-varying mesh stiffness excitation, out-of-line meshing impact excitation, and tooth surface friction excitation. Among these, mesh stiffness fluctuation is dominant, followed by meshing impact, while friction excitation plays a relatively minor role. We developed a detailed model for the tooth surface friction coefficient under mixed elastohydrodynamic lubrication (EHL) conditions.
The instantaneous composite friction coefficient at a contact point on the tooth surface under mixed lubrication is expressed as:
$$
\mu_{ML} = f_{\alpha} \mu_{BL} + (1 – f_{\alpha}) \mu_{EL}
$$
where \(\mu_{ML}\) is the mixed lubrication friction coefficient, \(\mu_{EL}\) is the full-film EHL coefficient, \(\mu_{BL}\) is the boundary lubrication coefficient, and \(f_{\alpha}\) is the load distribution factor determined from point-contact mixed lubrication theory.
To compute the equivalent friction torque coefficients for the pinion and gear, we discretized the meshing contact footprints. The contact lines on one side of a herringbone gear are shown schematically as a series of elliptical contact areas. The instantaneous contact conditions during one mesh cycle are summarized in Table 1, where \(\Delta\phi\) is the rotation angle of the pinion over one tooth pitch.
| Pinion rotation increment | Active contact line numbers |
|---|---|
| 0 | 1, 6, 11 |
| (1/5)×Δφ | 2, 7, 12 |
| (2/5)×Δφ | 3, 8, 13 |
| (3/5)×Δφ | 4, 9, 14 |
| (4/5)×Δφ | 5, 10 |
| Δφ | 1, 6, 11 |
Using tooth contact analysis (TCA) and loaded tooth contact analysis (LTCA), we obtained for each grid point the load distribution coefficient, relative curvature, sliding velocity, rolling velocity, and friction arm. The friction coefficient at each point was computed from the mixed EHL model. The equivalent friction torque coefficients for the pinion and gear are given by:
$$
\chi_{pk}^{(\tau)} = \sum_{i=1}^{n} \sum_{j=1}^{\tau_{k+5(i-1)}} \lambda_{k+5(i-1),j} \mu_{k+5(i-1),j} \frac{X_{k+5(i-1),j}}{r_p} \cdot \text{sgn}\left(r_p – r_{k+5(i-1),j}\right), \quad k=1,2,3,4,5
$$
$$
\chi_{gk}^{(\tau)} = \sum_{i=1}^{n} \sum_{j=1}^{\tau_{k+5(i-1)}} \lambda_{k+5(i-1),j} \mu_{k+5(i-1),j} \frac{a_{22}}{r_p r_g} \left( r’_{p} – r’_{g} \right) \cdot \text{sgn}\left( X_{k+5(i-1),j} – r_p \right), \quad k=1,2,3,4,5
$$
where \(n\) is the total number of discretized contact lines on one tooth flank, \(\tau_{k+5(i-1)}\) is the number of discrete contact points on the \((k+5(i-1))\)-th contact line, \(\lambda\) is the load sharing coefficient, \(\mu\) is the friction coefficient, \(X\) is the friction arm about the pinion center, \(r\) is the distance from the point to the pinion center in the transverse plane, \(r_p\) and \(r_g\) are the pitch radii, and \(r’_p\) and \(r’_g\) are the base circle radii. The functions ceil and sgn are used for integer rounding and sign determination.
These coefficients allow us to incorporate friction torque into the dynamic model. A parametric study of the herringbone gear pair (Table 2) was conducted to evaluate the contribution of each excitation source to the vibration response under varying rotational speeds.
| Parameter | Pinion | Gear |
|---|---|---|
| Normal module (mm) | 6 | 6 |
| Transverse pressure angle (°) | 20 | 20 |
| Helix angle (°) | 24.43 | –24.43 |
| Load torque (N·m) | — | 828 |
| Number of teeth | 17 | 44 |
| Tooth direction (left/right) | Left & Right | Right & Left |
| Face width (mm) | 55 | 55 |
| Pinion speed (r/min) | 2500 | — |
From the results, at the rated speed of 2500 r/min, the root-mean-square (RMS) values of the relative vibration acceleration along the meshing line when considering only mesh stiffness excitation, meshing impact excitation, and friction excitation were 16.51 m/s², 10.05 m/s², and 4.63 m/s², respectively. This confirms that mesh stiffness fluctuation is the dominant vibration source, followed by meshing impact, while friction excitation plays a minor role.
Vibration Transmission to the Gearbox Housing
To evaluate the structural vibration transmitted from the gear meshing to the gearbox, we built a three-dimensional model of the gearbox housing using Pro/E and employed a pre-check plugin to eliminate small features that could cause mesh distortion. The model was imported into ANSYS and meshed with SOLID45 elements (78,378 elements, 21,599 nodes). The lubricating oil inside the gearbox was represented using FLUID30 elements (9,770 elements, 2,506 nodes). Fluid–structure interaction (FSI) between the oil and the inner walls of the housing was defined. The gearbox feet were fully constrained to simulate bolted connections to the foundation. The mass of the gears and shafts was lumped at coupling reference points at the centers of the bearing holes, with constraints that transfer forces to the bearing inner race.
We applied the time-varying dynamic loads computed from the dynamic model (including mesh stiffness, impact, and friction effects) to these coupling reference points. The transient dynamic response of the gearbox was solved in ANSYS APDL, repeating cycles until steady-state was reached, defined by the condition:
$$
\left| \frac{S_{iE} – S_{iS}}{S_{iE}} \right| \le \varepsilon
$$
where \(S_{iE}\) and \(S_{iS}\) are the displacement values at the end and start of the \(i\)-th cycle, and \(\varepsilon\) is a tolerance. We focused on the vertical vibration at the left gearbox foot (point M in the model) because it is a key indicator of overall structural vibration.
Multi-Dynamic-Objective Three-Dimensional Tooth Surface Optimization
Tooth surface modification is an effective way to reduce vibration by improving load distribution, compensating for base pitch deviations, reducing meshing impact, and smoothing mesh stiffness variations. Since herringbone gears have inclined contact lines, neither profile modification nor lead modification alone is sufficient. Therefore, we adopted a three-dimensional (3D) modification approach. For high-precision applications (gear accuracy grade 3), we used cubic B-spline surfaces to represent the modified tooth flanks, which can fit data points with errors below 1 μm.
The optimization objective included four dynamic criteria: (1) fluctuation amplitude of the loaded transmission error (equivalent to mesh stiffness fluctuation), (2) amplitude of the out-of-line meshing impact force, (3) fluctuation amplitude of the equivalent friction coefficient, and (4) RMS value of the relative vibration acceleration along the meshing line direction. Using an improved adaptive genetic algorithm, we searched for the optimal modification parameters defined as:
- \(y_1, y_3\): tip/root modification amounts (profile direction)
- \(y_2, y_4\): tip/root modification lengths (profile direction)
- \(y_5, y_7\): lead modification amounts at ends
- \(y_6, y_8\): lead modification lengths at ends
The optimization problem was formulated as:
$$
\min f = w_1 \frac{F_e}{F_{e0}} + w_2 \frac{F_f}{F_{f0}} + w_3 \frac{F_I}{F_{I0}} + w_4 \frac{F_a}{F_{a0}}
$$
subject to:
$$
\begin{aligned}
& y_1 – y_3 \le Q_{y0}, \quad y_2 – y_4 \le l_{y0} \\
& Q_{y\min} \le y_1, y_3 \le Q_{y\max}, \quad l_{y\min} \le y_2, y_4 \le l_{y\max} \\
& y_5 – y_7 \le Q_{z0}, \quad y_6 – y_8 \le l_{z0} \\
& Q_{z\min} \le y_5, y_7 \le Q_{z\max}, \quad l_{z\min} \le y_6, y_8 \le l_{z\max}
\end{aligned}
$$
where \(F_e\), \(F_f\), \(F_I\), \(F_a\) are the objective functions for transmission error fluctuation, friction torque fluctuation, meshing impact force, and meshing line acceleration RMS, respectively; the subscript ‘0’ denotes values for the unmodified gear; and weights \(w_1=0.3\), \(w_2=0.1\), \(w_3=0.2\), \(w_4=0.4\) were chosen based on the relative importance of each excitation source (as determined earlier). The individual objective functions are:
$$
\begin{aligned}
F_e(\mathbf{y}) &= \max(\delta_e) – \min(\delta_e) \\
F_f(\mathbf{y}) &= \max(\chi_{pk}) – \min(\chi_{pk}) + \max(\chi_{gk}) – \min(\chi_{gk}) \\
F_I(\mathbf{y}) &= F_{s0} \\
F_a(\mathbf{y}) &= \text{RMS}(a_k)
\end{aligned}
$$
where \(\delta_e\) is the transmission error at discrete points, \(F_{s0}\) is the initial meshing impact force, and \(a_k\) is the relative vibration acceleration.
Under the rated load of 828 N·m and pinion speed of 2500 r/min, the optimized modification parameters are shown in Table 3.
| Parameter | Value |
|---|---|
| Profile tip modification amount (μm) | 16 |
| Profile tip modification length (mm) | 1.6 |
| Profile root modification amount (μm) | 18 |
| Profile root modification length (mm) | 3.2 |
| Parabola order (profile) | 4 |
| Lead modification amount at both ends (μm) | 14 |
| Lead modification length at both ends (mm) | 11.2 |
| Parabola order (lead) | 4 |
After applying the optimized modification, the RMS of the relative vibration acceleration along the meshing line decreased from 40.51 m/s² to 32.40 m/s², and the fundamental mesh frequency component (708 Hz) dropped from 27.06 m/s² to 22.62 m/s². The second harmonic amplitude reduced from 5.9 m/s² to 2.6 m/s². For the gearbox foot vibration (point M), the RMS value decreased from 3.94 m/s² to 3.08 m/s², with the fundamental mesh frequency component reducing from 2.66 m/s² to 2.36 m/s², and the second harmonic from 0.30 m/s² to 0.21 m/s².
Experimental Validation
To verify the theoretical analysis and the effectiveness of the 3D tooth surface modification, we manufactured test herringbone gears with grade 5 accuracy. The gears were run-in with grinding paste to achieve a good meshing condition. The experiments were conducted on a closed-power-flow test rig, which recirculates power and is energy efficient. The test rig consisted of a DC motor, a slave gearbox, a torque meter, a torsion shaft, a loading device, the test gearbox, and two Heidenhain angle encoders (model ROD280, 18,000 lines, resolution ±5″, max speed 10,000 r/min). Acceleration signals were acquired using Dytran-3035B1 accelerometers (mass 2.5 g, frequency range 0.5–10 kHz, accuracy 1%).
For meshing line vibration measurement, the two encoders were mounted on the ends of the pinion and gear shafts. The sine-wave signals from the encoders were sampled by an Art PCI8502 acquisition card. Using the zero-crossing detection method, we extracted the angular positions of each shaft and computed the dynamic transmission error in the transverse plane. The relative vibration acceleration along the meshing line was obtained by differentiating the transmission error twice:
$$
a(t) = \frac{\pi}{180} \left[ (\varphi_1(t) – \varphi_{10}) r_{b1} – (\varphi_2(t) – \varphi_{20}) r_{b2} \right]”
$$
where \(\varphi_1\) and \(\varphi_2\) are the actual rotation angles, \(\varphi_{10}\) and \(\varphi_{20}\) are the initial angles, and \(r_{b1}\), \(r_{b2}\) are the base circle radii.
For housing vibration, accelerometers were placed at six locations: two on the gearbox feet (left and right), and four on the bearing end caps (radial direction). The signals were processed by an M+P data acquisition system and analyzed in the frequency domain.
Before the measurement, we verified the actual tooth surface geometry of the modified pinion using a Klingelnberg P100 gear checker. The maximum profile deviation was 4.1 μm and the maximum lead deviation was 3.6 μm, both within the grade 5 tolerance (profile <7 μm, lead <10 μm). The actual modified surface was fitted with cubic B-splines and superimposed on the theoretical modification model to predict the vibration response more accurately. The predicted RMS meshing line acceleration for the actual modified gear was 35.21 m/s², within 8% of the theoretical value of 32.40 m/s².
Experimental results are summarized in Table 4.
| Measurement position | Theoretical (before) | Theoretical (after) | Experimental (before) | Experimental (after) |
|---|---|---|---|---|
| Meshing line relative acceleration | 40.51 | 32.40 | 44.30 | 34.83 |
| Left bearing (pinion side) | 5.40 | 4.22 | 6.21 | 4.81 |
| Left bearing (gear side) | 4.27 | 3.39 | 4.94 | 3.91 |
| Left gearbox foot | 3.94 | 3.08 | 4.35 | 3.37 |
| Right bearing (pinion side) | 5.47 | 4.35 | 6.25 | 4.95 |
| Right bearing (gear side) | 4.40 | 2.55 | 5.14 | 4.04 |
| Right gearbox foot | 4.01 | 3.22 | 4.63 | 3.58 |
The experimental data confirmed that the vibration level decreased after modification. The meshing line acceleration RMS reduced from 44.30 m/s² to 34.83 m/s², and the gearbox foot vibration RMS reduced from 4.35 m/s² to 3.37 m/s². To comprehensively evaluate the modification effect, we averaged the RMS values over all measurement positions. The theoretical average reduction was 25.1% (from 9.71 m/s² to 7.29 m/s²), while the experimental average reduction was 21.2% (from 10.83 m/s² to 8.49 m/s²). The slight difference is attributed to unmodeled assembly errors and other system imperfections, but the consistency between theory and experiment is satisfactory.
Conclusion
In this work, we systematically analyzed the vibration transmission process of herringbone gear systems, from the tooth meshing excitation to the gearbox housing. By establishing a fluid–structure coupled finite element model and applying time-varying bearing forces, we predicted the structural vibration response. We developed a multi-objective three-dimensional tooth surface optimization using an improved adaptive genetic algorithm that considered mesh stiffness fluctuation, meshing impact, friction, and relative acceleration. The optimized modification significantly reduced both the tooth meshing line vibration and the gearbox foot vibration. Experimental validation on a closed-power-flow test rig using high-precision Heidenhain encoders and accelerometers confirmed the theoretical predictions. The average vibration reduction measured was 21.2%, closely matching the theoretical value of 25.1%. These results demonstrate the effectiveness of our integrated approach for reducing vibration and noise in herringbone gear transmission systems.