
1 Internal excitation of the main reducer system
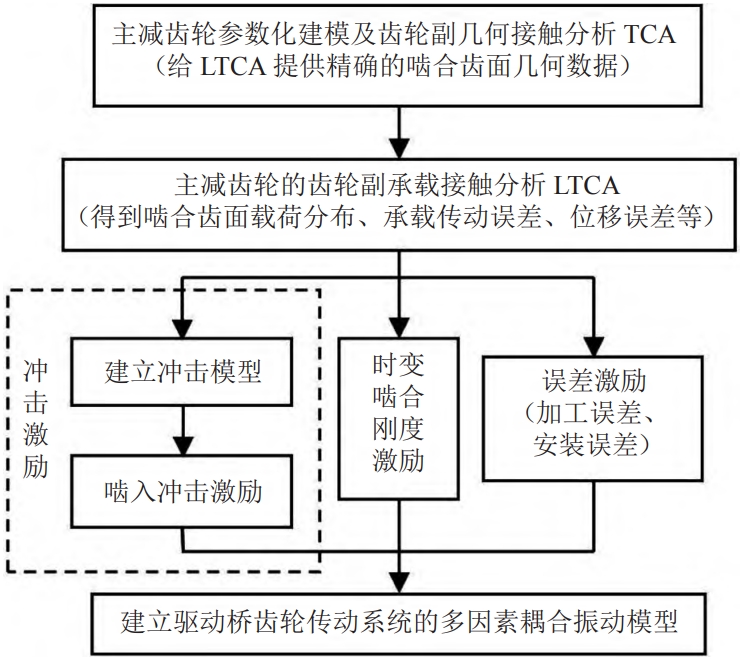
Dynamic excitation is the root cause of vibration and noise in drive axle systemsThe main reason, especially the internal dynamic excitation during gear meshing, isThere are three aspects: impact caused by tooth profile error or uneven wear of the tooth surface;The deformation of the gear after being loaded causes pulsation along the normal line of the meshing lineforce;the eccentric mass of each rotating part in the internal system.Follow-up construction drivesWhen modeling the multi-factor coupled vibration of the moving bridge gear transmission system, theThe internal incentives mainly include the time-varying stiffness and damping of the main reduction gear during meshing.The error excitation caused by manufacturing and installation errors, as well as the impact of gear meshing.The internal excitation calculation flowchart during gear meshing is shown in Figure 1.ThroughThe meshing contact analysis of the main and driven gears of the main reducer can be accurately carried outCalculation of internal excitation, related gear geometry contact analysis and load carryingSee the description for contact analysis and gear pair meshing contact analysisMethod.
1.1 Time-varying stiffness excitation
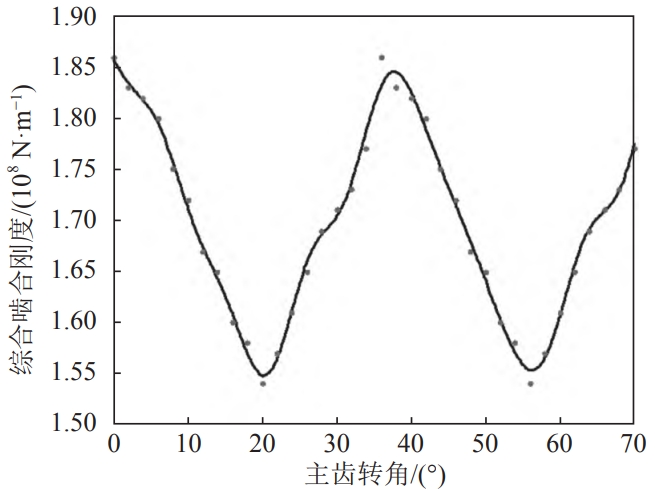
The meshing stiffness of the main reducer gear is the dynamic of the drive axle systemThe determination of gear dynamic load, load capacity, and the importance of vibration and noise reduction in the main reducerOne of the parameters.Due to the non-superposition of the meshing of the main reducer gear,The integer, with repeated changes in the meshing process, exhibits periodic cycles, accompanied byWith the elastic deformation of gears and the periodic change of meshing position,The meshing stiffness of the gear varies with time period.Utilizing theThe contact force and contact area at different meshing positions on the meshing line are obtained through contact analysis.The contact deformation is obtained, resulting in a series of meshing stiffness differences at different positions.and then calculate the equivalent meshing stiffness value at that time.Because the meshing stiffness of the main reducer gear obtained is a series ofFor discrete values, the step length between the time points corresponding to two adjacent data is constant, whileThe engagement stiffness values of other points within the time period are unknown, and the vibration differentialThe solution of the system of equations requires stiffness values at continuous time points.Therefore, it is necessary toThis series of discrete stiffness values are fitted into a continuous curve of timeLine to solve the subsequent vibration differential equation set.The use of 8th order Fourier series to fit the discrete stiffness values can effectively meet the fitting curveAccuracy requirements.The comprehensive meshing stiffness curve of the fitted main reducer gearThe line is shown in the figure.
1.2 Transmission error excitation
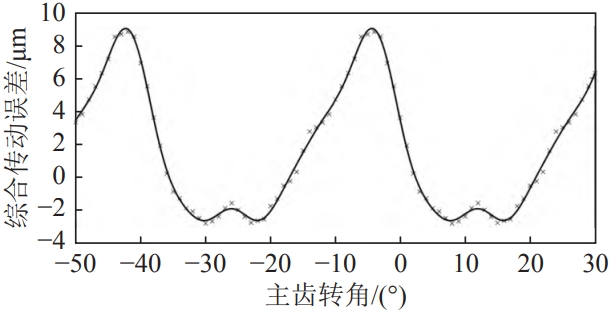
During the meshing process of the main reducer gear, its transmission error stimulates the mainIt is caused by manufacturing and installation errors, gear thermal deformation, and the alignment of the main and driven gear axes.The deviation of the angle from 90°, etc., and it presents a periodic alternating change.Main reducerDuring the manufacturing process of the transmission gear, each process step may causeThe accumulation of errors eventually leads to the change of the base pitch, tooth pitch, pressure angle, tooth profile,There are some deviations in tooth direction and other aspects.Therefore, the meshing tooth profile and theoretical meshing shapeThe state deviates, causing the instantaneous transmission ratio of the gear to change, which affects the normal operation of the system.The vibration and noise of the gear will have a significant impact。
Check the gear according to the processing accuracy requirements of the main reducer gear level 7The manual has a limit deviation of 20 µm for tooth pitch and a tooth profile error of 11 µm.According to theDetermine the gear working circle frequency with the input speed condition, and calculate the tooth profile errorWrite the above harmonic function as a continuous function of time.ByFourier series expansion, which can be used to analyze the errors and tooth profiles caused by manufacturing and installationThe error is synthesized, and the main reducer gear system is equivalent to a comprehensive transmissionThe error fitting curve is shown in the figure.
1.3 Calculating the impact excitation
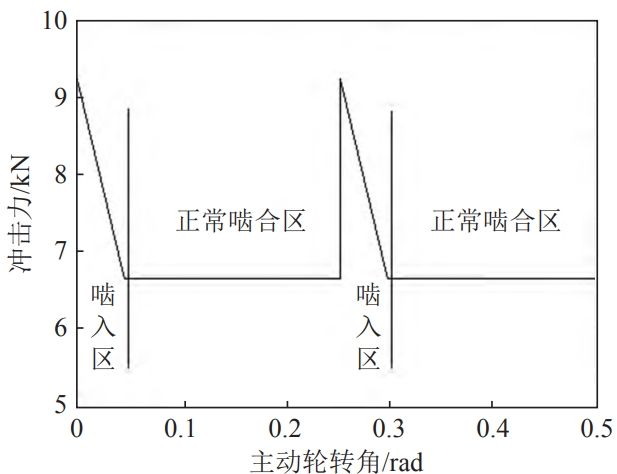
During the meshing process of the main reducer gear, due to gear errors, load changes,and other factors, there is a meshing pitch error,This will lead to a discrepancy between the theoretical and actual meshing points, resulting in meshingWhen the gears exit the engagement, the theoretical and actual engagement pointsDifferent positions result in different meshing impacts.The above mentioned meshing processesThe impact is the meshing impact, which forms a vibration with the reciprocating meshing process.There are periodic impacts, mainly including meshing, unmeshing, and node impacts3 situations.
Meshing impact between a pair of gears when the main gear speed is 1,500 r/minThe force change curve is shown in the figure.
2. Spatial dynamic model of gear transmission system
The actual operating conditions of the drive axle are very complex. To simplify the calculation,Model, treat the gear, differential housing and other parts as rigid bodies, support positionThe stiffness of the placement is a constant value, regardless of the friction between the meshes;at the same time,The equivalent spring stiffness is used to replace the gear meshing pair in the vibration system,Elastic deformation of slewing pair and support bearings, etc.The coupled vibration model of the drive axle is shown in Figure 5.In Figure 5:The wheel structure is symmetrical, and its work involves meshing at points A, B, C, and D.The parameters of the combined model are consistent, and only the vibration represented by point A is drawn in the figure.Dynamic model;the moving parts in the system include the driving gear, the driven gear,2 planetary gears, 2 side gears, 2 half shafts and differential housing;aboutThe torsional stiffness and torsional damping of the main and driven gears, half shafts, and bendsThe stiffness and damping of the curve are not separately marked, and the differential equation group of vibration is establishedtime to explain.
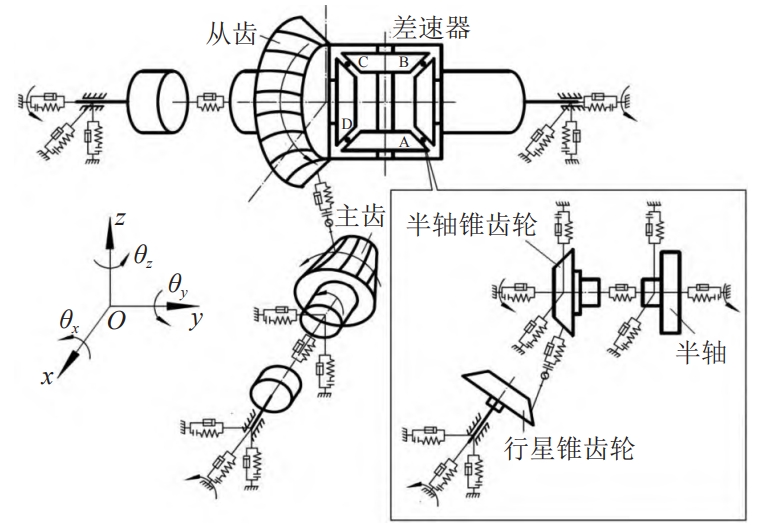
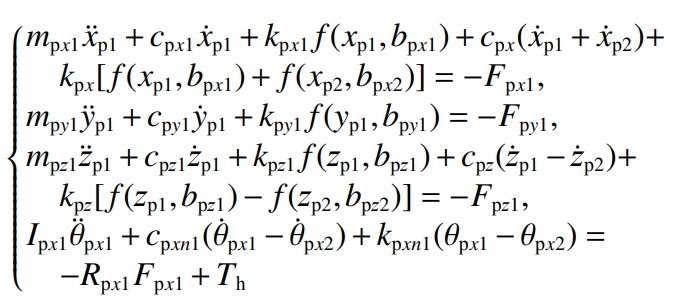
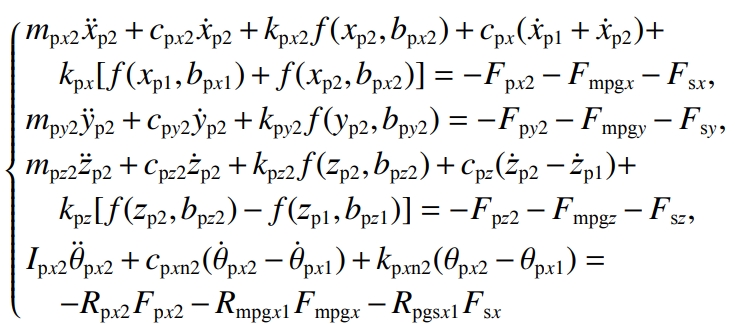
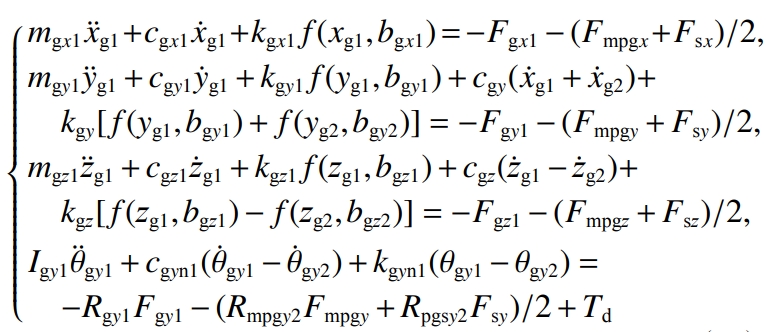
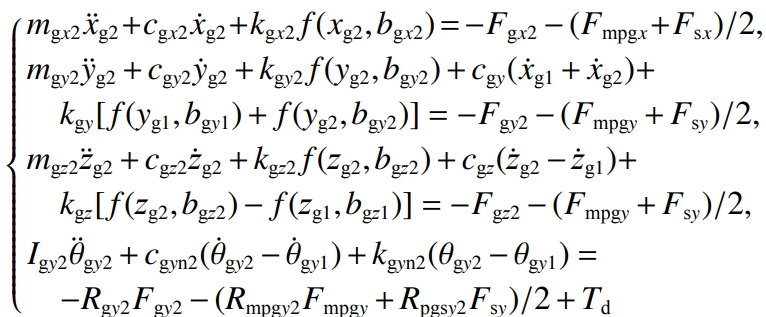
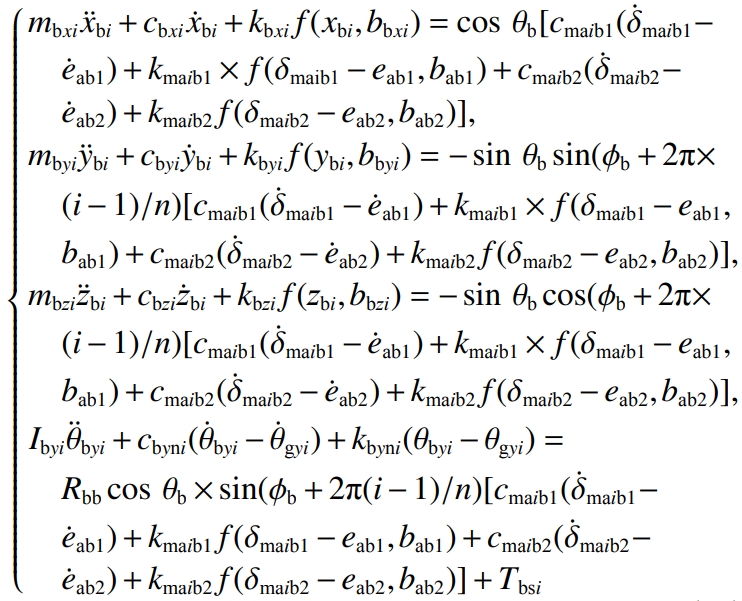
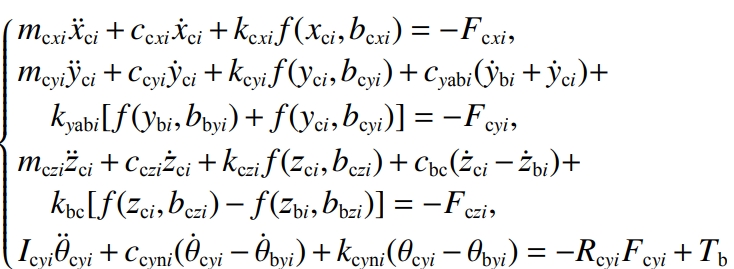
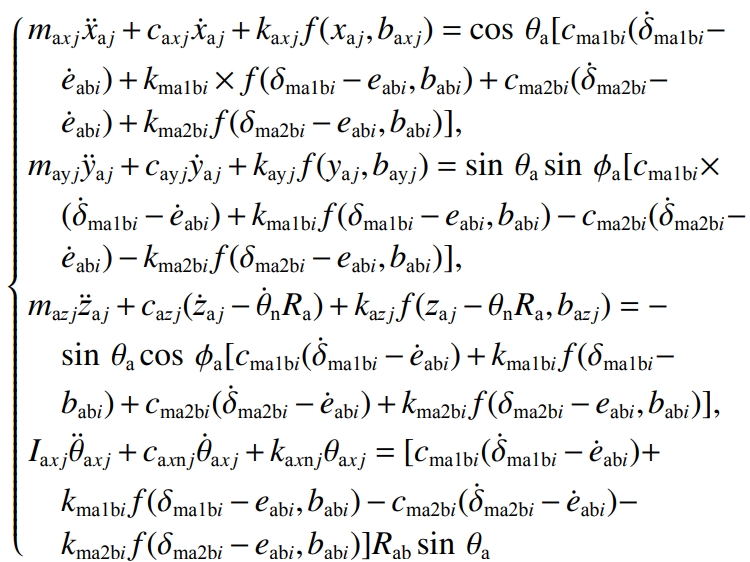
The translation vibration displacement of the rear and front bearing support center points of the driving gear along the x, y, and z directions is denoted asSupport the rotation vibration displacement around the x direction, where j=1,2; , ,For the left and right bearing support center points of the driven gear, the x and y axes are respectivelyTranslational vibration displacement in the y, z directions;is the displacement of the support point around the y directionThe vibration displacement at the corner; , ,are the center points of the planetary gear supportDo not translate the vibration displacement in the x, y, z directions;The angular vibration displacement in the x direction;the angular vibration of the planetary gear shaftDisplacement; , ,are the center points of the halfshaft gear support along x, y, and z, respectivelyTranslational vibration displacement in 3 directions;rotation of the support point around the y directionThe angular vibration displacement; , ,are the center points of the half-shaft bearing supports, respectivelyTranslational vibration displacement in the x, y, z directions;rotation of the support point around the y directionThe vibration displacement of the corner to the .Vibration equation of the bearing support center point at the rear end of the main gear:
3 Vibration characteristic analysis
The drive axle system includes the basic parameters of the transmission components.Time-varying meshing stiffness and meshing error introduced for the system of differential equationsand meshing impact, the data is fitted by Fourier seriesFor the curve of continuous changes in time, the variable step size 4th order Runge-Kutta method is used to solve the coupled vibration model.
3.1 Comparison before and after optimization
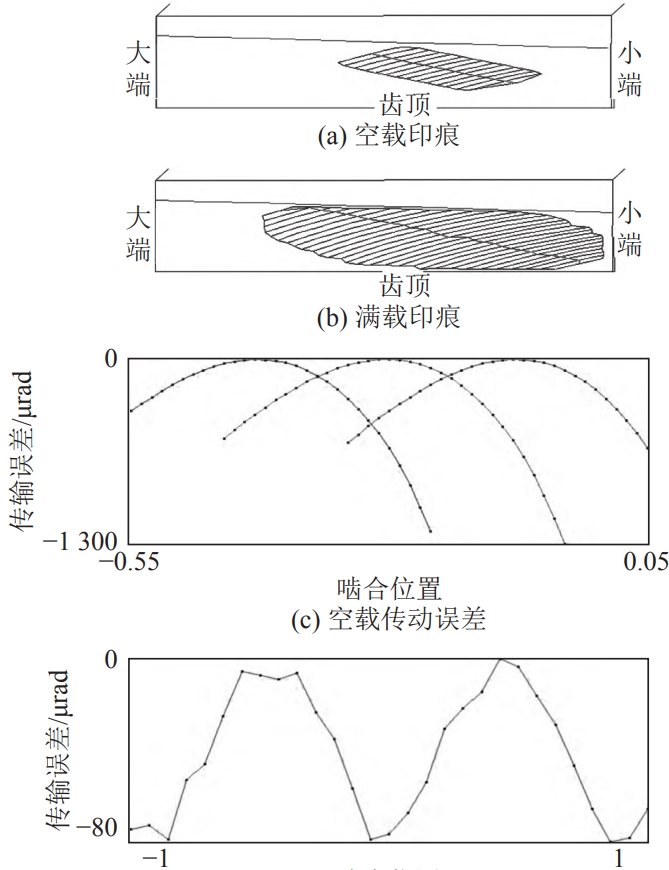
Free modification of tooth surfaces is completed based on Gleason Ease-off module.Based on the minimum gear transmission error amplitude, contact trace, and V/H ratio,Select the optimal correction value for the mismatch coefficient, and the no-load and load factors after gear modificationThe contact imprint and transmission error corresponding to full load are shown in the figure, and the imprint is required to beThe trace does not show edge contact, is located in the middle of the tooth surface, and is evenly distributed along the tooth surface.
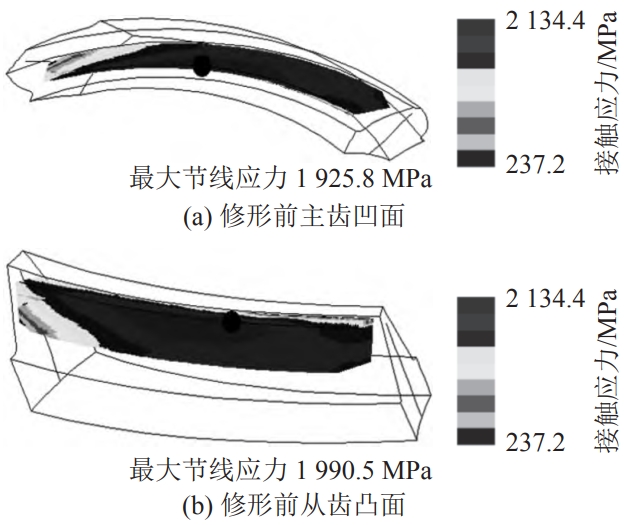
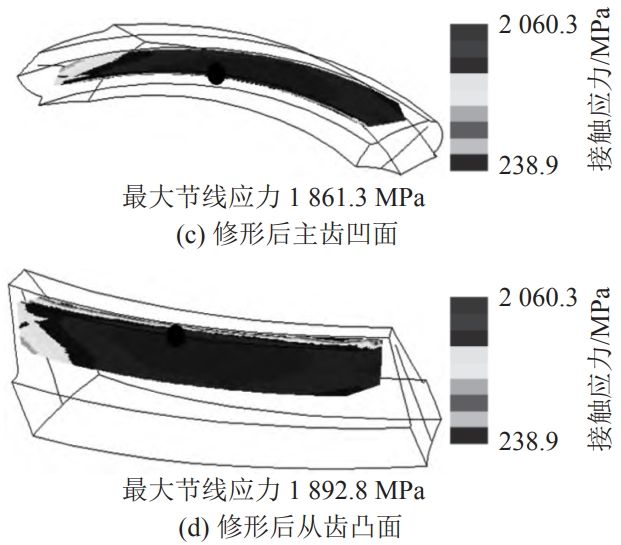
Combining with the finite element loading simulation conditions, the tooth surface contact before and after the modification is analyzed.The contact stress is shown in the figure. It can be seen from the figure that the modification improves the edge of the tooth tipStress concentration phenomenon.
Take the set working condition as an example: input speed 1500 r/min, input rotationThe moment is 273 N·m. Solve the differential equation set of the drive axle vibration to obtain the primary and secondaryNumerical solution of vertical, torsional, and axial vibrations of the moving gear, among othersThe vibration characteristic value at the center of mass of the rotating part.Taking the vertical vibration of the driving gear asTake dynamic characteristics as an example, compare the analysis values before and after optimization to illustrateThe performance of the system has been improved after optimization.When the drive axle vibration system operates under the established working conditions and is in stable operation, the vertical vibration displacement andThe spectrum is shown in Figure 8.From Figure 8, it can be seen that before optimization, the vibration balance positionThe displacement amplitude is 2.3 µm at the starting point and stabilizes after 12 ms.About 18 µm;the vibration balance position after optimization of the transmission system is at the starting point0.5 µm, and it stabilizes after 8 ms, with a displacement amplitude of about 13.5 µm, which isThe amplitude of the optimized signal decreased by 25%.
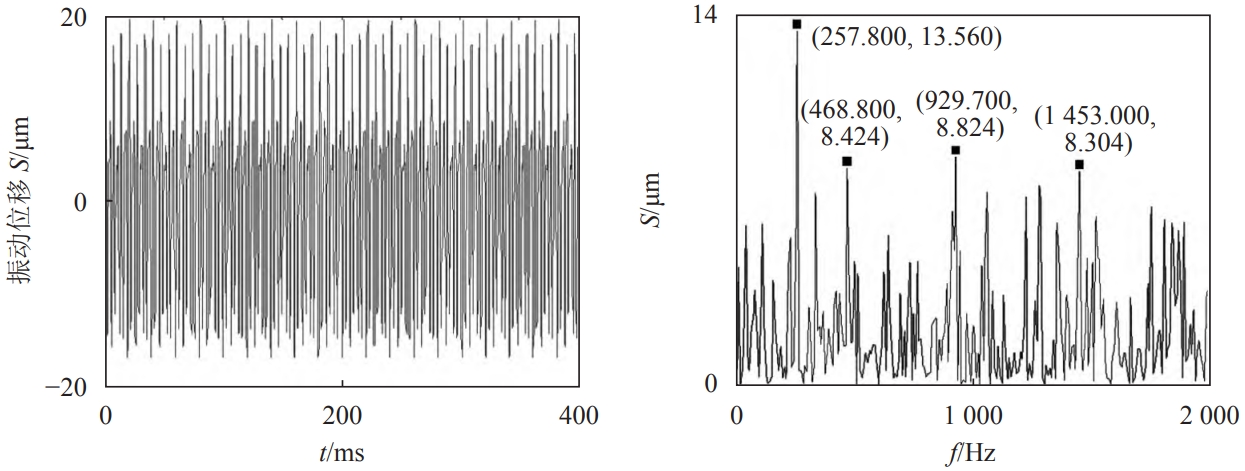
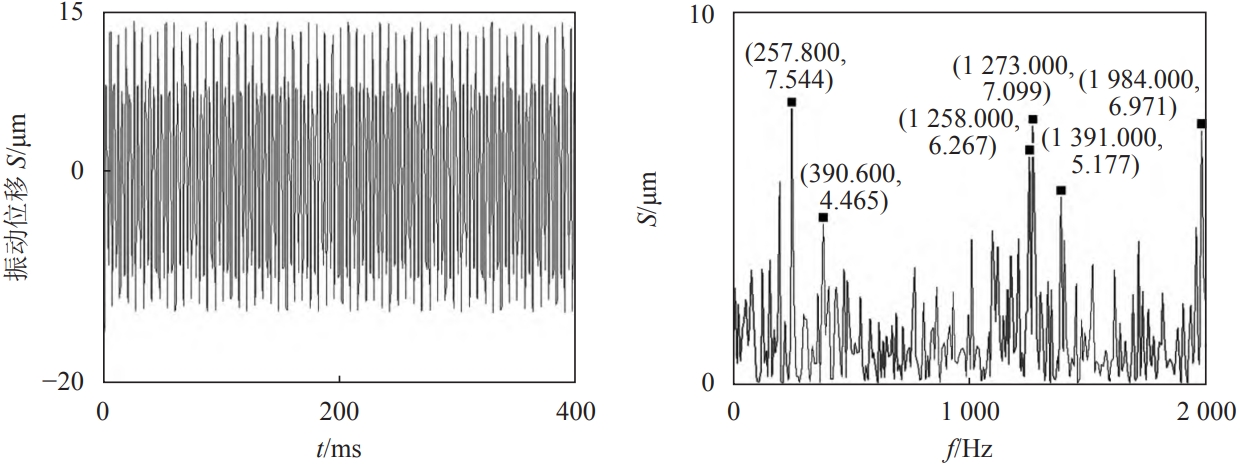
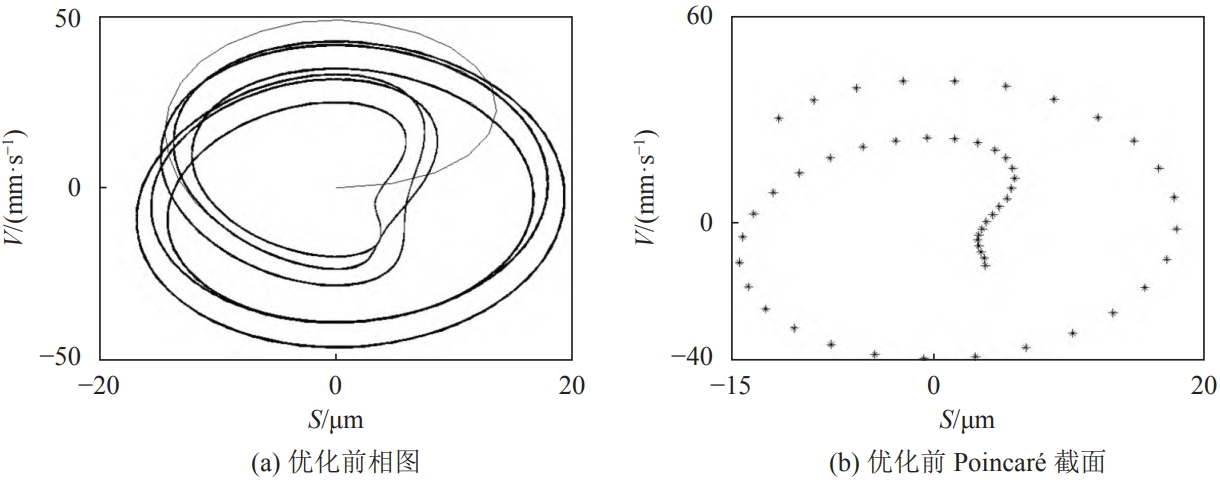
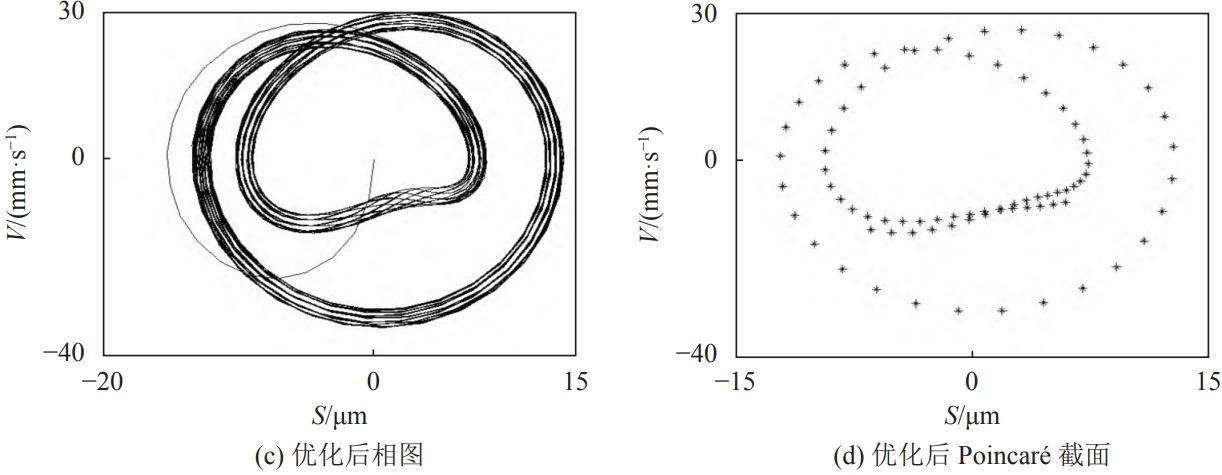
Perform FFT transformation on the vertical vibration displacement data, and in its amplitude spectrumThere are abundant displacement peaks in the 2000 Hz band, including frequency components of tenThe displacement peaks before and after optimization were 13.56 and 7.54 µm, respectively.The corresponding frequency is 257.8 Hz.According to the given input speed of the main gear of 1,500 r/min,The frequency of the peak vertical vibration displacement and the meshing frequency of the master and slave teeth250 Hz is close to the operating frequency of the main reduction gear system.The vertical vibration displacement of the tooth is obtained by taking the first derivative, and the vertical vibration velocity andThe spectrum is shown in the figure.After obtaining the vertical vibration displacement and velocity response, a phase diagram is used toThis indicates that the motion circles of the drive axle’s main gear dynamic system on the phase plane are interconnected and surround a closed curve, which is somewhat complex.The repeatability of the optimized curve is better than that of the optimized curve;Each scatter point in the Poincaré section and its corresponding phase diagram curve areOne correspondence, the scatter points present a combination of heart-shaped and ring-shaped distributions, confirming the phase diagramAnalysis results.Status,Take displacement as the abscissa and velocity as the ordinate.Meanwhile, remove the pre-steady stateThe transient response data of the sensor is collected in time segments based on the excitation cycle.The obtained scatter data are plotted in the plane of displacement and velocity.The phase diagrams of the vertical vibration displacement and velocity of the main gear before and after optimization are shown in the figure with Poincaré section.From the figure, it can be seen that the main gear before and after optimizationAfter the vibration stabilizes, the phase diagram gradually forms a repeated inner shape and irregular ellipse.
After obtaining the vertical vibration displacement and vertical vibration velocity of the support point on the large end of the main tooth,After dynamic speed, according to the stiffness and damping coefficient of the supporting conical roller bearing,The numbers are multiplied by displacement and speed respectively to obtain the elastic force of the support bearing,The viscous force is summed up to calculate the dynamic load of the supporting bearing.Transmission systemThe vertical dynamic load of the support bearing at the front end of the main gear before and after optimization is shown in the figureAs shown in the figure, the vibration stabilizes after 10 ms, and the motion before optimizationThe load amplitude is 180 N, and the optimized dynamic load amplitude is 120 N, which is reduced.The value is far less than the dynamic rated value under the basic load condition of the bearing.
Find the vertical vibration displacement, vertical vibration velocity, and support of the main toothAfter the bearing vertical dynamic load and the meshing force between the master and slave teeth,The differential equations of the original drive axle vibration system can be used to calculate the vertical vibration acceleration of the main gear.The vertical vibration acceleration of the main gear when the system is in stable operation is shown in the figure.
Before optimization, the vibration acceleration amplitude was 50 m/s2, excellentafter being converted, it is 41 m/s2, which is 18% lower than before optimization, which is consistent with the vertical vibrationThe trend of displacement and vibration velocity is the same;the trend of vertical vibration accelerationPerform FFT conversion on the data to obtain the acceleration amplitude spectrum within the 2000 Hz bandhas a rich peak acceleration and a complex frequency composition;The peak acceleration before and after optimization was 39.04 and 20.55 m/s2, respectivelyBoth of themThe corresponding peak frequencies are 234.4 and 265.6 Hz, which are in agreement with the meshing frequency of the master and slave teeth.The rate is close to 250 Hz, which is similar to the vertical vibration displacement and vertical vibration speed of the main tooth.The frequency spectrum data is consistent.
The numerical solutions of the vertical, torsional, and axial vibrations of the driving and driven gears before and after the optimization of the transmission system show that theVertical and axial vibrations of the teeth are more complex than torsional vibrations, which haveGood regularity, showing quasi-periodic motion, and the axial vibration is very complexMixed, in a state of near chaotic motion;optimized transmission system with master and slave gearsThe vertical and axial vibration data is better than before optimization, and the vertical vibration dataThe analysis results are consistent;the torsional vibration data before and after optimization do not change significantly.