
The dynamic meshing characteristics of hypoid bevel gears are fundamental to their operational longevity, transmission efficiency, and noise-vibration-harshness (NVH) performance in critical applications such as automotive drivetrains. While the spiral bevel gear is a common choice, the cycloidal tooth form processed via the continuous indexing method offers distinct advantages in production efficiency and potential for dry cutting. However, in practical applications, particularly during neutral coasting conditions, these gears can exhibit undesirable phenomena such as high-frequency whine and significant surface wear on the non-driving flanks. This investigation delves into a comprehensive dynamic simulation analysis to elucidate the vibrational and acoustic behavior of hypoid bevel gears across various operational states. We aim to quantify performance metrics like transmission error, angular acceleration, and structurally radiated noise under forward drive, reverse drive, and both forward and reverse neutral coasting conditions. Furthermore, the analysis extends to evaluating the influence of varying load and speed on the dynamic response. The findings provide a critical foundation for the performance-oriented design of hypoid bevel gears, ensuring robustness not only in the primary drive direction but also during transient and unloaded states.
1. Dynamic Modeling of the Hypoid Gear Pair
To accurately capture the dynamic interactions, a high-fidelity multi-body dynamics model of the hypoid bevel gear pair was constructed. The process integrated precise geometric definition, material properties, and nonlinear contact mechanics.
1.1 Geometric Model and Kinematic Pairs
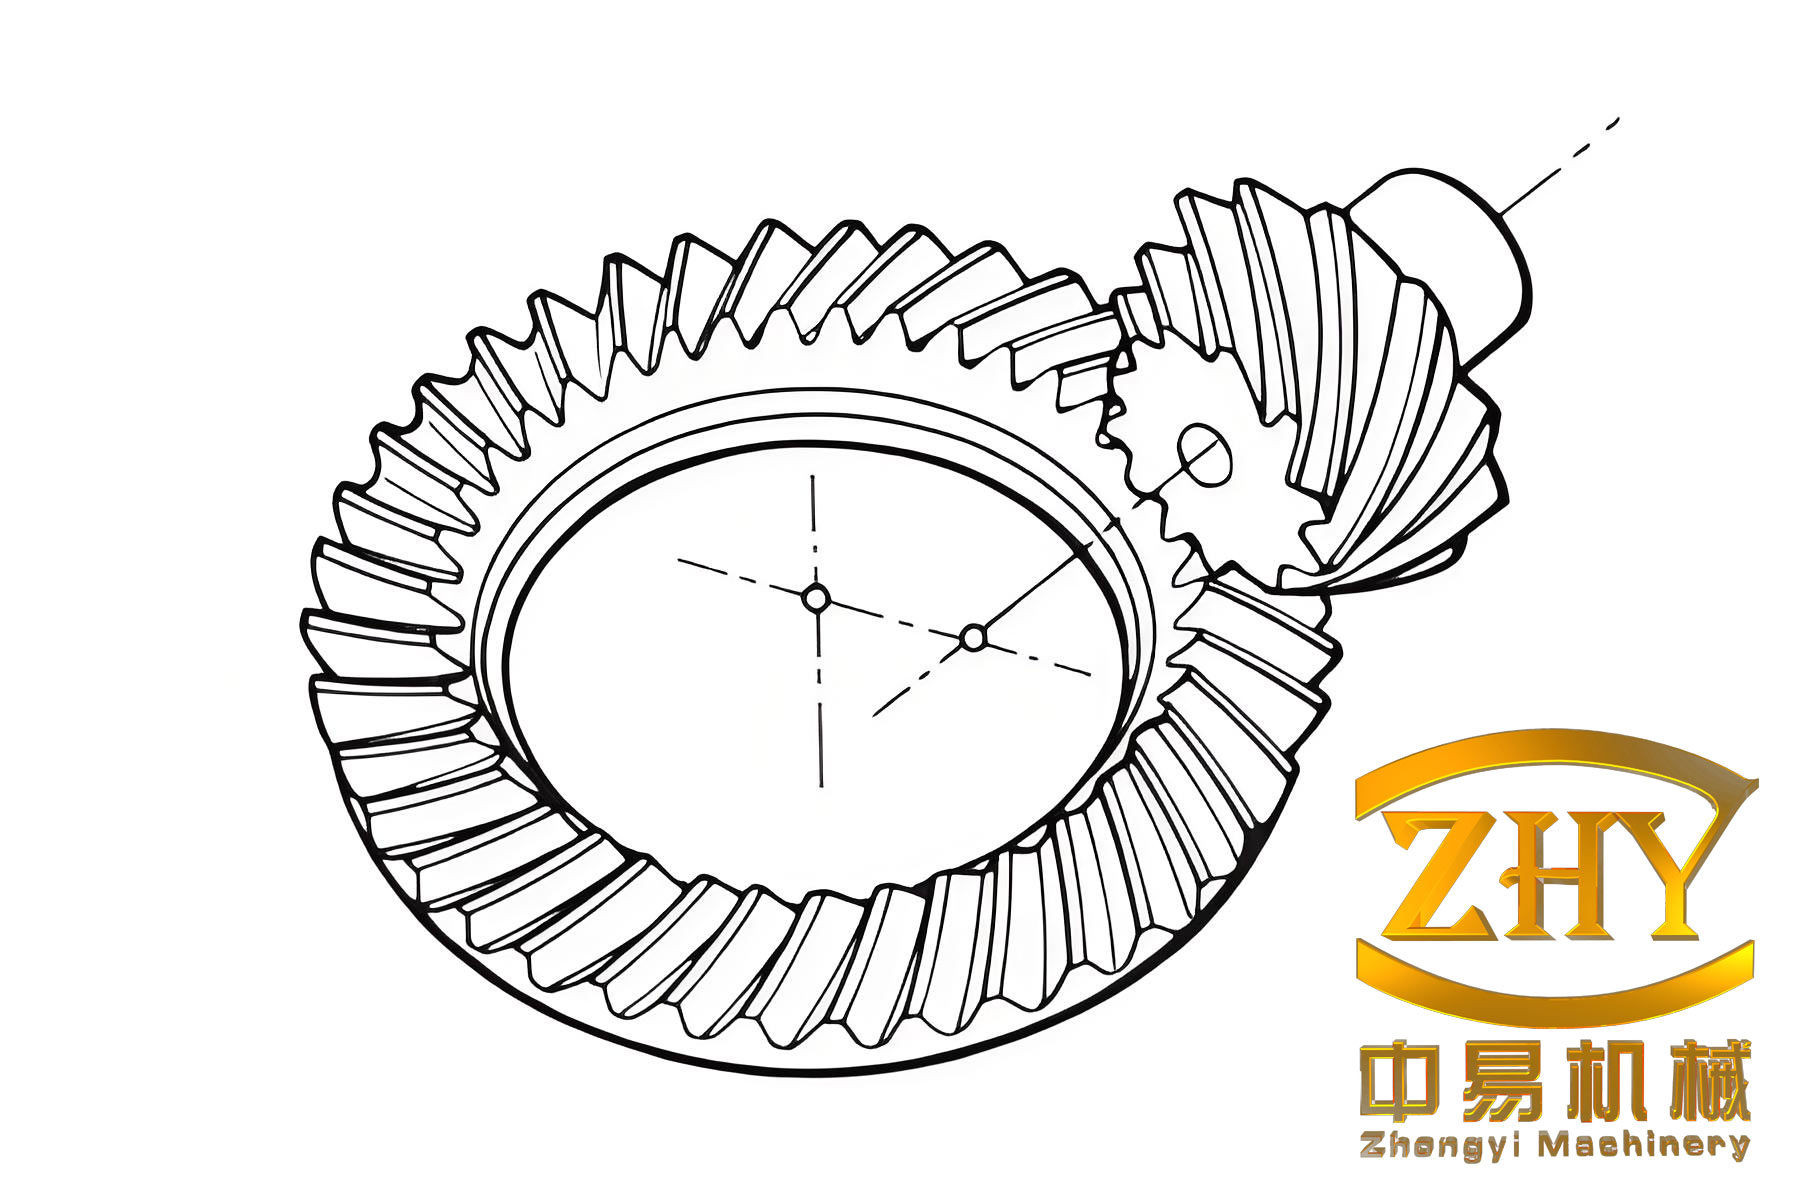
The three-dimensional solid model of the gear pair, consisting of a pinion with $z_1 = 11$ teeth and a gear with $z_2 = 47$ teeth, was first assembled in a CAD environment to ensure correct meshing alignment and shaft offset. This assembly was then imported into a dynamic simulation software suite via a standard data exchange format. Within the dynamics environment, the necessary kinematic joints were applied: revolute joints were defined for both the pinion and gear shafts, constraining their rotational degrees of freedom about their respective axes while allowing free rotation.
1.2 Material and Contact Force Definition
The dynamic response is predominantly governed by the time-varying contact forces between the mating tooth surfaces. A penalty-based impact contact force algorithm, which is a standard method for modeling collisions between flexible bodies, was employed. This model calculates the normal force $F_n$ as a function of the penetration depth $\delta$ and its rate $\dot{\delta}$:
$$ F_n = k \delta^e + c_{max} \cdot \dot{\delta} \cdot STEP(\delta, 0, 0, d_{max}, 1) $$
where $k$ is the contact stiffness, $e$ is the force exponent (typically >1), $c_{max}$ is the maximum damping coefficient, and $d_{max}$ is the maximum penetration depth at which full damping is applied. The STEP function ensures a smooth transition of damping. Frictional forces were modeled using a Coulomb friction model with static and dynamic coefficients. The specific contact parameters, calibrated from literature and material properties, are summarized in Table 1.
| Parameter | Value | Parameter | Value |
|---|---|---|---|
| Stiffness Coefficient, $k$ | $3.16 \times 10^9 \, \text{N/mm}^e$ | Static Friction Coefficient | 0.08 |
| Damping Coefficient, $c_{max}$ | $5.0 \times 10^4 \, \text{N·s/mm}$ | Dynamic Friction Coefficient | 0.05 |
| Force Exponent, $e$ | 1.5 | Static Transition Velocity | 0.1 mm/s |
| Penetration Depth, $d_{max}$ | 0.1 mm | Dynamic Transition Velocity | 10.0 mm/s |
1.3 Load Cases and Operational Scenarios
Reflecting real-world operating conditions in an automotive axle, four distinct scenarios were defined for analysis. The primary distinction lies in the driving surface and the load state. In forward drive (“Drive Forward”), the concave side of the pinion tooth drives the convex side of the gear tooth. The reverse is true for “Drive Reverse”. The neutral conditions simulate the gear pair coasting with minimal load, driven by the vehicle’s inertia, with the gear driving the pinion. The specific parameters for each case are detailed in Table 2.
| Case No. | Transmission Mode | Driving Surface | Driven Surface | Load Torque (kN·m) | Speed (rpm) |
|---|---|---|---|---|---|
| 1 | Drive Forward | Pinion Concave | Gear Convex | 1.025 | 1000 |
| 2 | Drive Reverse | Pinion Convex | Gear Concave | 1.025 | 1000 |
| 3 | Neutral Coast Forward | Gear Concave | Pinion Convex | 0.240 | 234 |
| 4 | Neutral Coast Reverse | Gear Convex | Pinion Concave | 0.240 | 234 |
2. Analysis of Meshing Characteristics
2.1 Angular Acceleration Under Different Transmission Modes
The angular acceleration of the driven member is a direct indicator of torsional vibration and dynamic unsteadiness in the gear transmission. Applying the constraints and loads from Table 2, the time-domain responses and their corresponding frequency spectra were obtained for all four cases.
The fundamental meshing frequency $f_z$ is calculated based on the rotational speed $N$ (in rpm) and the number of teeth on the driving member $z$:
$$ f_z = \frac{N \cdot z}{60} $$
For the driven cases (1 & 2) at 1000 rpm pinion speed, $f_z = (1000 \times 11) / 60 \approx 183.33 \text{ Hz}$. For the neutral cases (3 & 4) at 234 rpm gear speed, $f_z = (234 \times 47) / 60 \approx 183.33 \text{ Hz}$. This ensures the meshing frequency is consistent for comparison.
The time-domain root-mean-square (RMS) values of the angular acceleration reveal the overall intensity of vibration. To facilitate a direct comparison between the high-torque drive cases and the low-torque neutral cases, the RMS values for Cases 3 and 4 were scaled down by the gear ratio ($\approx 4.273$). The processed statistical data is presented in Table 3.
| Case | Mean (rad/s²) | RMS (rad/s²) | Max (rad/s²) | Min (rad/s²) | Scaled RMS* (rad/s²) |
|---|---|---|---|---|---|
| 1: Drive Forward | 61.29 | 3050.1 | 8040.4 | -13579.5 | 19.4 |
| 2: Drive Reverse | -60.89 | 3279.2 | 973.6 | -11328.2 | 18.7 |
| 3: Neutral Forward | -260.63 | 3532.6 | 137040.0 | -50300.8 | 76.6 |
| 4: Neutral Reverse | -297.88 | 3987.6 | 66745.7 | -131560.0 | 76.6 |
*RMS values for Cases 3 & 4 are divided by the gear ratio (~4.273) for comparison with Cases 1 & 2.
Time-Domain Observations: The scaled RMS values show a clear progression from Case 1 to Case 4. The Drive Forward condition (Case 1) exhibits the lowest scaled RMS angular acceleration, indicating the smoothest transmission and least vibrational excitation. The Drive Reverse condition (Case 2) is slightly worse. Notably, both neutral coasting conditions (Cases 3 & 4) show scaled RMS values approximately four times higher than the drive conditions, signifying significantly harsher dynamic interaction and explaining the potential for wear and noise during coasting.
Frequency-Domain Observations: The spectral analysis reveals the composition of the vibrational energy. In all cases, the primary excitation occurs at the meshing frequency (183.33 Hz) and its harmonics. However, the amplitude distribution differs markedly:
- Case 1 (Drive Forward): The largest peak is at the fundamental meshing frequency ($1 \times f_z$), with significant contributions from the $3^{rd}$ and $5^{th}$ harmonics.
- Case 2 (Drive Reverse): The largest peak shifts to the $2^{nd}$ harmonic ($2 \times f_z$), with strong activity also at $1 \times$, $3 \times$, $4 \times$, and $5 \times f_z$.
- Case 3 & 4 (Neutral): The absolute acceleration amplitudes in the spectrum are an order of magnitude larger than in the drive cases. Case 3 peaks at the $2^{nd}$ harmonic, while Case 4 peaks at the $3^{rd}$ harmonic. This indicates that the neutral meshing action excites different modal responses and generates substantially higher dynamic forces across multiple frequencies.
2.2 Meshing Performance of Drive Flanks Under Varying Load and Speed
To further characterize the primary drive surfaces, a parametric study was conducted on the Drive Forward (pinion concave/gear convex) and Drive Reverse (pinion convex/gear concave) configurations. The driven gear’s angular acceleration RMS was evaluated under combinations of three pinion speeds (800, 1000, 1200 rpm) and four load torques (0, 1.025, 2.000, 3.000 kN·m). The results are summarized graphically in the following analysis.
The relationship between load torque and angular acceleration RMS at constant speed is distinctly different for the two flanks. While both exhibit an increase in vibration with load, the rate of increase is consistently steeper for the reverse drive flank (pinion convex). This implies that the reverse flank contact is less tolerant to load increases, leading to a more rapid degradation of dynamic smoothness.
Similarly, when examining the effect of speed under a constant nominal load (1.025 kN·m), the angular acceleration RMS rises with speed for both flanks due to increased kinetic energy and excitation frequency. However, the sensitivity to speed is again greater for the reverse drive flank. The convex pinion/concave gear mesh inherently generates higher dynamic mesh forces and fluctuating stiffness, resulting in a more pronounced vibrational response as speed increases compared to the optimized concave pinion/convex gear mesh of the forward drive.
2.3 Structural Noise Radiation Analysis
Gear vibration, quantified by acceleration, is the source of structurally radiated noise. To assess acoustic performance, the simulated time-domain acceleration signals (both circumferential and radial components at the bearing locations) were processed. After a Fast Fourier Transform (FFT), the spectral data was analyzed in one-third octave bands centered on the key meshing frequencies. The acceleration level $L_a$ in decibels (dB) for each band is defined as:
$$ L_a = 10 \log_{10}\left(\frac{a^2}{a_0^2}\right) = 20 \log_{10}\left(\frac{a}{a_0}\right) $$
where $a$ is the RMS acceleration within the frequency band, and $a_0$ is the reference acceleration ($1 \times 10^{-6} \, \text{m/s}^2$). The analysis focused on bands centered at the meshing frequencies corresponding to the three tested speeds: 146.67 Hz (800 rpm), 183.33 Hz (1000 rpm), and 220.00 Hz (1200 rpm). The acceleration amplitudes extracted from the FFT at these frequencies under different loads are listed in Tables 4-6.
| Load Torque (kN·m) | Forward: Circ. | Forward: Rad. | Reverse: Circ. | Reverse: Rad. |
|---|---|---|---|---|
| 0.000 | 3.40 | 4.38 | 3.51 | 4.44 |
| 1.025 | 8.19 | 7.85 | 13.00 | 11.00 |
| 2.000 | 13.00 | 14.00 | 16.00 | 27.00 |
| 3.000 | 10.00 | 12.00 | 20.00 | 17.00 |
| Load Torque (kN·m) | Forward: Circ. | Forward: Rad. | Reverse: Circ. | Reverse: Rad. |
|---|---|---|---|---|
| 0.000 | 1.33 | 2.74 | 4.25 | 5.83 |
| 1.025 | 11.00 | 10.00 | 18.00 | 13.00 |
| 2.000 | 20.00 | 21.00 | 26.00 | 24.00 |
| 3.000 | 16.00 | 18.00 | 31.00 | 25.00 |
| Load Torque (kN·m) | Forward: Circ. | Forward: Rad. | Reverse: Circ. | Reverse: Rad. |
|---|---|---|---|---|
| 0.000 | 1.61 | 1.89 | 4.43 | 4.06 |
| 1.025 | 14.00 | 13.00 | 21.00 | 16.00 |
| 2.000 | 30.00 | 32.00 | 38.00 | 37.00 |
| 3.000 | 25.00 | 26.00 | 45.00 | 39.00 |
Applying the formula for $L_a$ to the data in Tables 4-6 yields clear trends in noise radiation:
- Flank Comparison: For every combination of speed and load, the calculated noise level (both circumferential and radial) is higher for the reverse drive flank compared to the forward drive flank. This confirms that the concave pinion/convex gear mesh is acoustically superior.
- Speed Effect: Noise levels increase with driving speed for both flanks, as expected, due to higher excitation energy.
- Load Effect: A non-monotonic relationship with load is observed. Noise increases from the unloaded state to a medium load (around 2.000 kN·m) and then decreases slightly at the highest load (3.000 kN·m). This can be attributed to increased tooth deflection under heavy load, which improves the contact ratio and dampens impact forces, thereby mitigating some of the vibrational excitation that leads to noise, even though the static forces are higher.
3. Conclusions
This comprehensive dynamic investigation into the performance of hypoid bevel gears yields several critical conclusions for design and application:
- Optimal Drive Condition: The forward drive configuration, where the pinion’s concave surface drives the gear’s convex surface, delivers the best overall dynamic performance. It exhibits the lowest levels of torsional vibration (angular acceleration RMS) and the lowest structurally radiated noise across varying loads and speeds. This validates the common design practice of optimizing this flank for primary power transmission.
- Challenges of Neutral Coasting: Neutral coasting conditions, where the gear pair is unloaded and driven by inertia, present the worst dynamic environment. The vibrational energy, as measured by scaled angular acceleration, is several times higher than during powered drive. The frequency spectrum shows high-amplitude excitations at multiple harmonics of the meshing frequency, which correlates directly with the generation of whining noise and accelerated wear on the coast-side flanks. Special attention in the design phase is required to improve the meshing quality of these non-driving flanks.
- Load-Dependent Noise Behavior: The relationship between transmitted load and gear noise is complex. While noise generally increases with load due to higher forces, a slight reduction can occur at very high loads because of beneficial changes in mesh compliance and contact pattern. This indicates that NVH optimization must consider the entire expected load spectrum.
In summary, the dynamic meshing performance of hypoid bevel gears is highly sensitive to the operating condition and the specific tooth flank in contact. A holistic design approach must therefore aim not only for excellence in the primary drive direction but also seek to manage the dynamic excitations on the reverse and coast flanks to ensure durability and quiet operation across all vehicle states. The methodologies and findings presented here provide a quantitative framework for achieving such performance-driven design of hypoid bevel gear systems.