
In modern mechanical transmission systems, helical gear pairs are widely employed due to their high efficiency, smooth operation, and substantial load-bearing capacity. However, fatigue failure, particularly tooth breakage, remains a critical concern that can compromise the reliability and longevity of these components. My research focuses on investigating the fatigue performance of helical gear pairs through an integrated approach combining finite element analysis, dynamic simulation, and fatigue life prediction. The core of this study lies in utilizing a virtual load spectrum derived from flexible multi-body dynamics simulations to assess fatigue life, while also examining the detrimental effects of tooth profile deviations on the durability of helical gear pairs. This comprehensive methodology aims to provide deeper insights into the fatigue behavior of helical gears under realistic operating conditions.
The fatigue analysis of gears often employs the nominal stress method, which is foundational for anti-fatigue design. This method relies on the S-N curve of the material or component and considers the stress concentration factor at critical locations alongside the nominal stress. The fundamental assumption is that for components made of the same material with identical stress concentration factors and subjected to similar load spectra, the fatigue life will be comparable. The procedure for estimating fatigue life using the nominal stress approach involves several key steps: identifying potential fatigue-critical areas within the structure, determining the nominal stress and stress concentration factor at these locations, defining the nominal stress spectrum based on the operational load history, obtaining the appropriate S-N curve for the given stress concentration and level, and finally calculating the fatigue life using cumulative damage theory.
The mathematical representation of the S-N curve is typically a power-law relationship expressed as:
$$ \sigma^m N = C $$
where \( \sigma \) is the stress amplitude, \( N \) is the number of cycles to failure, and \( m \) and \( C \) are material constants dependent on factors such as stress ratio and loading mode. For the helical gear material studied here, 20CrMnTi steel, the P-S-N curve parameters allow for the construction of an S-N curve for a specific survival probability, forming the basis for subsequent fatigue life calculations.
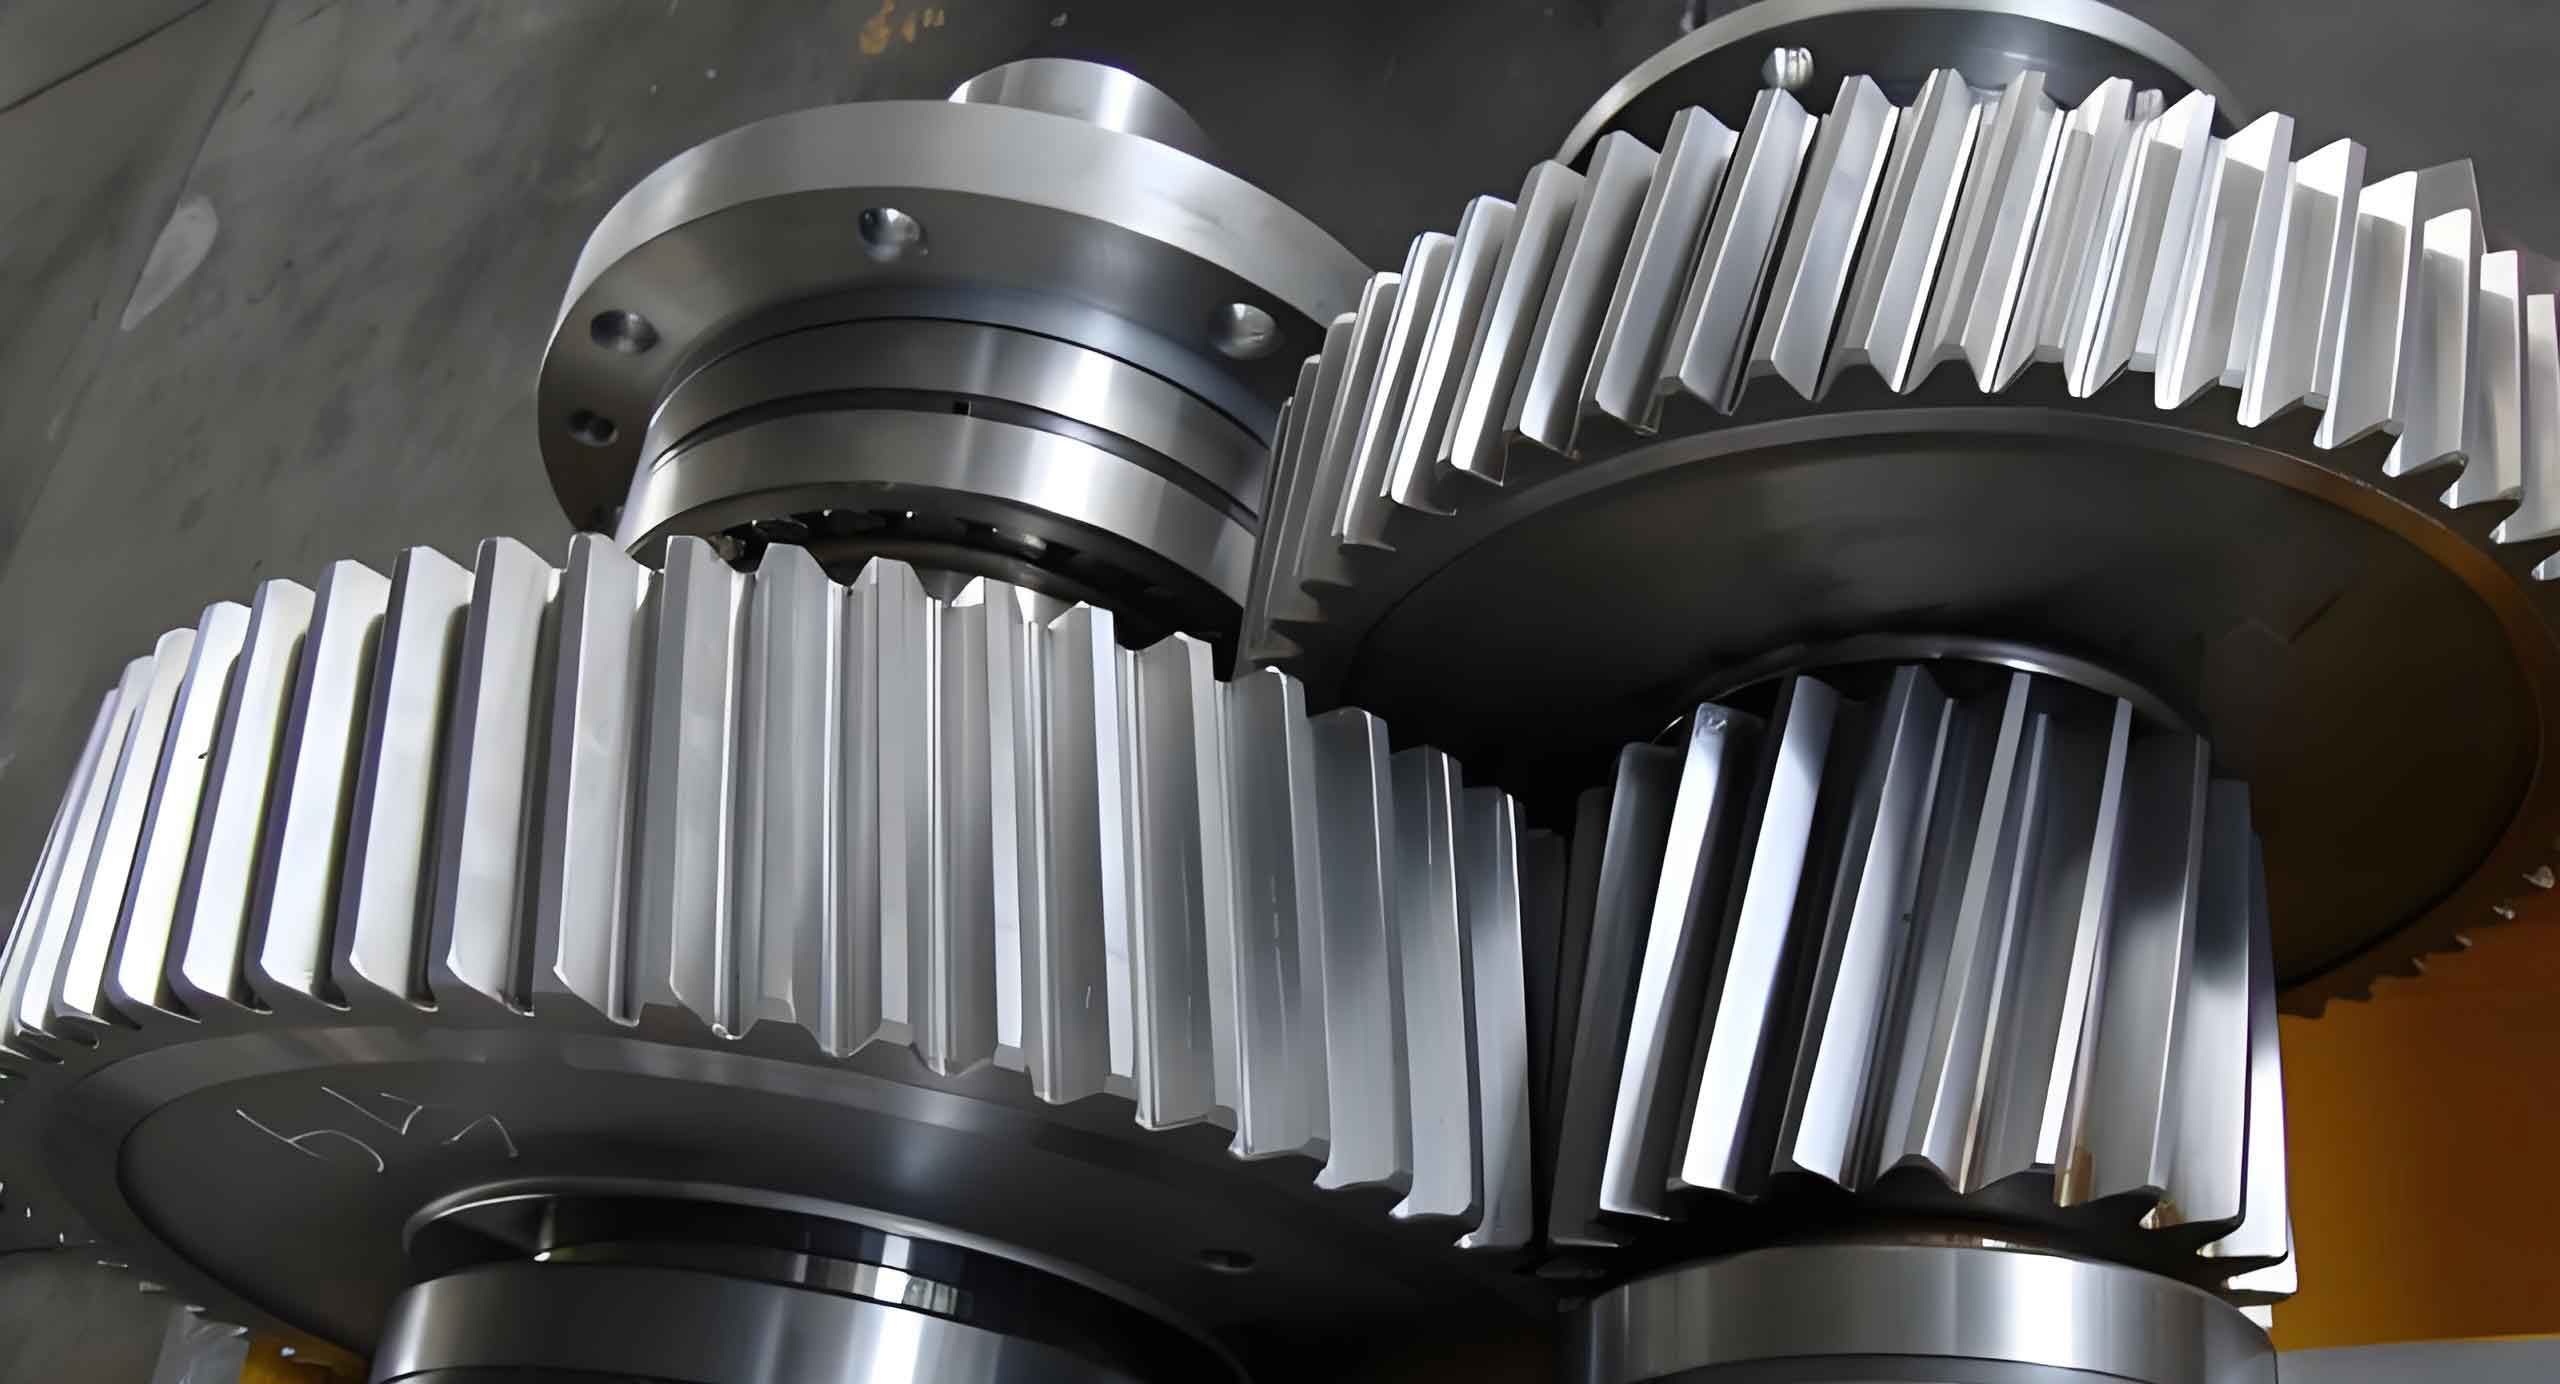
The first phase of my work involved creating an accurate three-dimensional model of the helical gear pair. The primary geometric parameters for the driving and driven helical gears are summarized in the table below. These parameters are essential for defining the gear geometry in CAD software, which is then imported into finite element analysis (FEA) software for further processing.
| Parameter | Symbol | Driving Gear | Driven Gear |
|---|---|---|---|
| Number of Teeth | \( z \) | 20 | 63 |
| Normal Module (mm) | \( m_n \) | 2 | |
| Normal Pressure Angle (°) | \( \alpha_n \) | 20 | |
| Helix Angle (°) | \( \beta \) | 12 | |
| Normal Modification Coefficient | \( x_n \) | 0.40 | -0.33 |
| Actual Center Distance (mm) | \( a \) | 85 | |
| Face Width (mm) | \( b \) | 35 | |
| Input Speed (rpm) | \( n \) | 1088 | – |
Both helical gears are made of 20CrMnTi steel, with a density of 7850 kg/m³, an elastic modulus of 2.07×10⁵ MPa, and a Poisson’s ratio of 0.25. The three-dimensional CAD model of the helical gear pair was assembled and then imported into ANSYS for finite element modeling. Within ANSYS, SOLID185 elements were used to mesh the gear bodies, and MASS21 elements were employed to create connection nodes at the centers of each helical gear. Rigid regions were established linking these central master nodes to all nodes on the gear contact surfaces, which act as slave nodes. This process is crucial for generating the Modal Neutral File (MNF), a binary file containing the flexible body’s geometry, mass properties, and modal information, which is exported for use in dynamic simulation software.
The next step involved multi-body dynamic simulation using ADAMS. The MNF file was imported into ADAMS to create a flexible dynamic model of the helical gear pair. To simulate the contact forces between the meshing helical gears, an impact function method was utilized. The contact force \( F \) in this model is governed by parameters such as the contact stiffness \( K \), penetration depth at maximum damping \( d \), damping coefficient \( C \), and force exponent \( e \). For two contacting bodies, the deformation \( \delta \) during impact can be related to the force. Assuming a circular contact area during helical gear meshing, the relationship between the contact force and deformation is derived from Hertzian contact theory. The deformation is given by:
$$ \delta = \frac{a^2}{R} = \left( \frac{9F^2}{16 R E^{*2}} \right)^{\frac{1}{3}} $$
where \( a \) is the contact radius, \( R \) is the equivalent radius of curvature, and \( E^{*} \) is the equivalent elastic modulus. From this, the contact force can be expressed as:
$$ F = K \delta^{\frac{3}{2}} $$
The contact stiffness coefficient \( K \) is determined by the material and geometric properties of the helical gears:
$$ K = \frac{4}{3} R^{\frac{1}{2}} E^{*} $$
Here, the equivalent radius \( \frac{1}{R} = \frac{1}{R_1} + \frac{1}{R_2} \) and the equivalent modulus \( \frac{1}{E^{*}} = \frac{1 – \mu_1^2}{E_1} + \frac{1 – \mu_2^2}{E_2} \), with \( R_1 \) and \( R_2 \) being the equivalent radii of the driving and driven helical gears at the contact point, and \( E_1, E_2, \mu_1, \mu_2 \) their respective elastic moduli and Poisson’s ratios. For the studied helical gear pair, the calculated contact stiffness \( K \) was approximately \( 7.6635 \times 10^5 \, \text{N/mm}^{1.5} \). Other parameters were set as: \( d = 0.1 \, \text{mm} \), \( C = 50 \, \text{N·s/mm} \), and \( e = 2.2 \). Friction was modeled using the Coulomb method, with dynamic and static friction coefficients of 0.05 and 0.08, respectively, accounting for lubricated conditions.
In the ADAMS simulation, a rotational joint was applied at the center of each helical gear. A load torque of 207,262 N·mm was applied to the driven helical gear, while a rotational velocity was applied to the driving helical gear. To avoid abrupt starts, the velocity was ramped up using a step function: \( \text{step}(time, 0, 0^\circ/s, 0.02, 6528^\circ/s) \). The simulation was run for 0.06 seconds with 1500 steps using the WSTIFF solver with SI2 integration. The dynamic contact force between the helical gears was extracted from the stable portion of the simulation results. The obtained load spectrum, representing the time-history of the contact force, serves as the critical input for subsequent fatigue analysis. The contact force exhibited periodic fluctuations corresponding to the meshing cycle of the helical gear pair. The average contact force from the simulation was 3547.74 N, which showed good agreement with the theoretically calculated value of 3509.73 N, validating the dynamic model of the helical gear pair.
Concurrently, a static contact analysis of the helical gear pair was performed in ANSYS to determine the stress distribution under load. A finite element model encompassing five pairs of teeth was constructed using SOLID185 elements with a mapped meshing technique. Boundary conditions constrained the driving helical gear to allow only rotation about its axis, with the applied torque converted into tangential forces on the nodes of its central hole. The driven helical gear was fully constrained. The analysis simulated the complete meshing process, from engagement to disengagement, and the maximum tooth contact stress at various positions was recorded. The stress distribution clearly showed that the contact lines on the helical gear teeth were inclined relative to the tooth edges, and the equivalent stress near these contact lines was significantly higher than in other regions. The maximum equivalent stresses were found to be 974.53 MPa for the driving helical gear and 540.35 MPa for the driven helical gear, with the peak occurring near the tooth tip of the driven gear during meshing. The results confirmed that the contact stress is the dominant factor compared to root bending stress in this helical gear configuration.
The material fatigue properties for the helical gears are defined by the S-N curve. For 20CrMnTi steel, the P-S-N curve parameters at different failure probabilities are available. Selecting a survival probability of 90% (P=0.1), the constants \( m \) and \( C \) are used in the power-law equation to generate the S-N curve for fatigue life prediction. The approximate S-N relationship for this survival rate is established as a reference for the helical gear material.
| Failure Probability (P) | Constant \( C \) | Exponent \( m \) |
|---|---|---|
| 0.01 | 1.0322 × 10¹⁰² | 28.5714 |
| 0.05 | 7.0099 × 10⁷⁹ | 21.8866 |
| 0.10 | 3.207 × 10⁷⁴ | 20.2425 |
| 0.50 | 1.1604 × 10⁵⁴ | 14.0449 |
With the load spectrum from dynamics simulation, the stress results from static FEA, and the material S-N curve, the fatigue life analysis was conducted using nCode DesignLife software. The workflow in nCode involved importing the time-series load data (.dac file), the static stress results from ANSYS (.rst file), and the material data. The load spectrum, representing the helical gear pair contact force over time, was scaled using a normalization factor based on the static load condition. The stress tensor \( \sigma_{ij}(t) \) at any time \( t \) is calculated within the software by combining the static stress field with the time-varying load profile:
$$ \sigma_{ij}(t) = \sum_k \left[ \frac{P_k(t) S_k + O_k}{D_k} \right] \sigma_{ij,k,s} $$
where \( P_k(t) \) is the input load spectrum (the contact force history for the helical gear pair), \( S_k \) is a load scale factor, \( O_k \) is a load offset, \( \sigma_{ij,k,s} \) is the static stress from the FEA for load case \( k \), and \( D_k \) is a normalization factor. For our analysis, the normalization factor was set to 3500 N, corresponding to the static load used in the contact analysis. The mean stress correction was applied using the Goodman method. The fatigue analysis predicted the life distribution across the helical gear pair. The minimum fatigue life was found to be \( 3.714 \times 10^6 \) cycles, located at the tooth tip region of the driven helical gear where the maximum contact stress occurred. This result aligns with the stress concentration observed in the static analysis of the helical gear pair.
A significant aspect of this research involves studying the influence of manufacturing imperfections, specifically tooth profile deviation, on the fatigue performance of helical gear pairs. Tooth profile deviation refers to the departure of the actual tooth profile from the ideal design profile, encompassing total profile deviation, form deviation, and slope deviation. These deviations can adversely affect the smoothness of transmission, load distribution, and ultimately the fatigue life of helical gears. To investigate this, a method for generating precise three-dimensional models of helical gears with profile deviations was developed.
The mathematical foundation for modeling a gear tooth profile generated by a rack cutter is used as a starting point. For an ideal rack cutter, the coordinates \( (x_0, y_0) \) of a point on the cutter profile in the cutter coordinate system can be transformed to coordinates \( (x, y) \) on the generated gear tooth profile in the gear coordinate system after a rolling motion characterized by angle \( \phi \). The transformation equations are:
$$ \begin{aligned} x &= (r – x_0) \cos \phi + (r \phi – y_0) \sin \phi – r_f \cos\left(\frac{\pi}{z}\right) \\ y &= (r – x_0) \sin \phi + (r \phi – y_0) \cos \phi \\ \phi &= \frac{PN}{r} \end{aligned} $$
where \( r \) is the pitch radius of the helical gear, \( r_f \) is the fillet radius, and \( PN \) is the arc length on the pitch line. To introduce tooth profile deviation, it is assumed that the deviation on the rack cutter profile follows a sinusoidal pattern along the line of action, with a period equal to the base pitch. The deviation \( \Delta f \) at a given point can be expressed as:
$$ \Delta f = A_\alpha \sin(\omega t + \varphi) $$
where \( A_\alpha = \frac{1}{2} F_\alpha \), with \( F_\alpha \) being the total profile deviation, \( \omega \) is the fluctuation frequency, and \( \varphi \) is the initial phase. For a point \( (x_0, y_0) \) on the ideal cutter profile, the corresponding point on the deviated cutter profile \( (x_1, y_1) \) is obtained by shifting along the normal direction by \( \Delta f \):
$$ \begin{aligned} x_1 &= x_0 + \Delta f \sin \alpha \\ y_1 &= y_0 + \Delta f \cos \alpha \end{aligned} $$
where \( \alpha \) is the pressure angle of the rack cutter (equal to the gear’s pressure angle). Substituting these deviated coordinates into the gear generation equations yields the mathematical description of a helical gear tooth profile with profile deviation:
$$ \begin{aligned} x &= \left[ r – (x_0 + \Delta f \sin \alpha) \right] \cos \phi + \left[ r \phi – (y_0 + \Delta f \cos \alpha) \right] \sin \phi – r_f \cos\left(\frac{\pi}{z}\right) \\ y &= \left[ r – (x_0 + \Delta f \sin \alpha) \right] \sin \phi + \left[ r \phi – (y_0 + \Delta f \cos \alpha) \right] \cos \phi \\ \phi &= \frac{PN}{r} \end{aligned} $$
Using these equations, coordinate points for a deviated tooth profile curve were calculated. By generating multiple such curves along the face width of the helical gear and using surface modeling techniques in CAD software, a three-dimensional model of a helical gear with specified tooth profile deviation was constructed. This process was repeated to create a full gear model and subsequently an assembled helical gear pair with deviations. Models with different levels of total profile deviation (e.g., 5 µm, 10 µm, 15 µm, 20 µm) were created for the driving helical gear, while the driven gear remained ideal.
For each deviated helical gear pair model, the static contact analysis was repeated to obtain the stress distribution under load. A comparison between an ideal model and a model with a 20 µm profile deviation on the driving helical gear revealed significant differences. The ideal model showed a regular pattern of maximum contact stress variation corresponding to the alternating two-tooth and three-tooth contact regions typical of helical gear meshing. In contrast, the deviated model exhibited an irregular stress distribution, loss of the clear alternating contact pattern, and the emergence of severe stress concentration on localized tooth surfaces. The maximum contact stress in the deviated helical gear pair model was 1504.3 MPa, which is approximately 46% higher than the 812.25 MPa observed in the ideal model under the same loading condition. This stress increase is attributed to the altered load sharing among teeth and the localized overloading caused by the profile error in the helical gear.
The fatigue life analysis was then performed on these deviated helical gear pair models using the same nCode workflow, incorporating the modified static stress results and the same dynamic load spectrum. The predicted minimum fatigue life for each level of profile deviation is summarized in the following table. The results demonstrate a clear trend: as the tooth profile deviation increases, the fatigue life of the helical gear pair decreases substantially.
| Total Tooth Profile Deviation (µm) | Minimum Logarithmic Fatigue Life (log₁₀ N) | Approximate Minimum Cycles to Failure |
|---|---|---|
| 0 (Ideal) | 6.569 | ~3.714 × 10⁶ |
| 5 | 6.324 | ~2.11 × 10⁶ |
| 10 | 6.045 | ~1.11 × 10⁶ |
| 15 | 5.714 | ~5.18 × 10⁵ |
| 20 | 3.635 | ~4.315 × 10³ |
The most striking observation is for a profile deviation of 20 µm, where the fatigue life plunges to roughly \( 4.315 \times 10^3 \) cycles, which is a reduction of about 99.9% compared to the ideal helical gear pair’s life. This drastic decline underscores the critical sensitivity of helical gear fatigue performance to manufacturing tolerances. The presence of profile deviation disrupts the ideal conjugate meshing action, leading to non-uniform load distribution, impact-like loading conditions, and high local stresses that drastically accelerate the fatigue damage accumulation process in the helical gear teeth.
In conclusion, this research presents a comprehensive framework for analyzing the fatigue performance of helical gear pairs. The methodology integrates multi-body dynamics simulation to generate realistic operational load spectra, detailed finite element analysis for stress determination, and established fatigue life prediction techniques. The application of this framework to a case study helical gear pair provided valuable insights. The fatigue life was successfully predicted, identifying the tooth tip region of the driven helical gear as the most critical location. Furthermore, the study quantitatively demonstrated the profoundly negative impact of tooth profile deviations on the durability of helical gear pairs. The findings highlight that even relatively small deviations can lead to significant stress concentrations and dramatically reduced service life. This underscores the importance of stringent manufacturing quality control and the potential benefits of profile modification strategies for enhancing the fatigue resistance of helical gears in demanding applications. Future work could extend this approach to consider other types of gear errors, such as lead deviation or pitch error, and explore the effects of variable amplitude loading or different material treatments on the fatigue life of helical gear systems.