
Helical gears are the cornerstone of power transmission in mechanical systems, prized for their longevity, smooth operation, high efficiency, and constant transmission ratio. In automotive drivetrains, they play a pivotal role. However, these components operate under complex service conditions involving alternating impact loads. Among various failure modes, surface fatigue pitting is a predominant fault that critically undermines transmission performance, reliability, and generates significant vibration and noise. Therefore, the capability to predict and identify pitting faults in helical gears is of paramount importance for preventive maintenance and system safety.
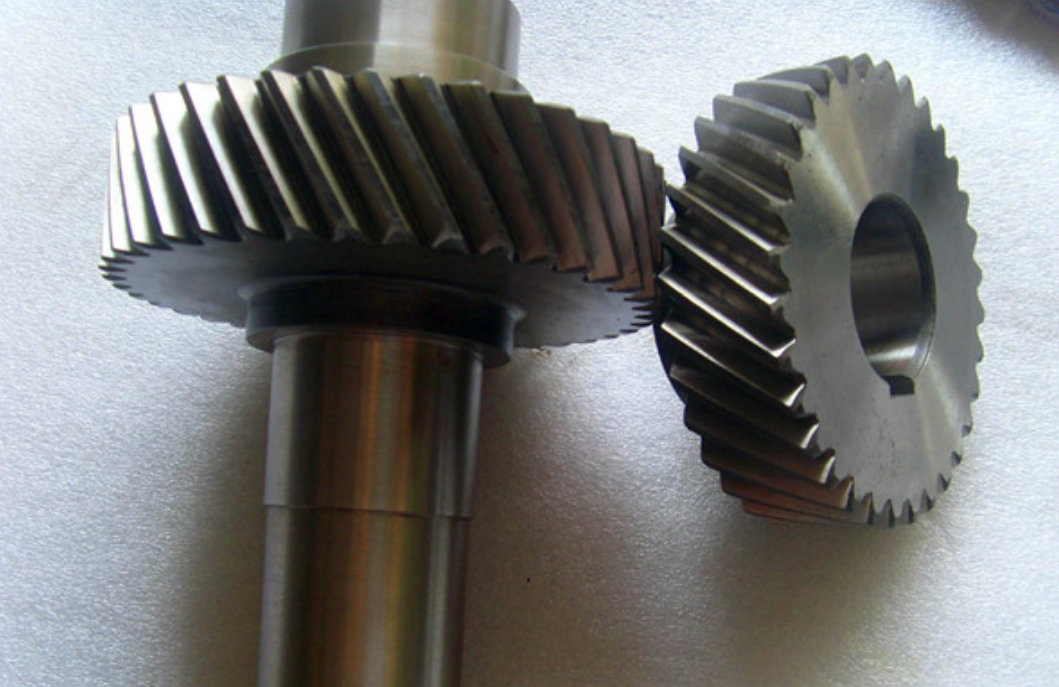
This article presents a comprehensive study that integrates dynamic simulation and experimental testing to investigate the effects of different pitting severities and patterns on the dynamic response of a helical gear system. The core objective is to establish a methodology for predicting and identifying pitting faults based on the system’s dynamic signatures.
1. Dynamic Modeling of Pitted Helical Gears
To simulate the dynamic behavior of helical gears with pitting faults, a nonlinear dynamic model is developed based on the theory of gear system dynamics.
1.1 Contact Force Model via the Impact Function Method
The contact force between meshing gear teeth is calculated using an impact function based on Hertzian elastic contact theory. The normal contact force $$F_n$$ consists of an elastic component and a damping component:
$$F_n = k \cdot step(d, 0, 0, \delta, 1) \cdot \delta^{1.5} + c \cdot step(d, 0, 0, \delta, 1) \cdot \frac{d\delta}{dt}$$
Where:
- $$k$$ is the contact stiffness coefficient (N/mm³ᐧ²).
- $$\delta$$ is the penetration depth between the contacting surfaces (mm).
- $$step(\cdot)$$ is a step function that activates the force calculation only when penetration occurs ($$\delta > 0$$).
- $$d$$ is the maximum allowable penetration (set to 0.1 mm).
- $$c$$ is the damping coefficient (N·s/mm).
- $$\frac{d\delta}{dt}$$ is the penetration velocity.
The contact stiffness coefficient for the helical gears is derived as:
$$k = \frac{4}{3} R^{1/2} E^*$$
Here, $$R$$ is the equivalent radius of curvature, and $$E^*$$ is the equivalent elastic modulus, calculated as follows:
$$\frac{1}{R} = \frac{1}{R_1} + \frac{1}{R_2}, \quad \frac{1}{E^*} = \frac{1-\nu_1^2}{E_1} + \frac{1-\nu_2^2}{E_2}$$
Where $$R_1$$ and $$R_2$$ are the radii of curvature of the pinion and gear, and $$E_1, \nu_1, E_2, \nu_2$$ are their respective Young’s moduli and Poisson’s ratios.
1.2 Load Distribution via the Contact Line Percentage Method
A key characteristic of helical gears is their multi-tooth contact due to the helical lead. The load is shared among several pairs of teeth simultaneously. The length of the contact line on the theoretical plane of action changes continuously during meshing. For a healthy gear pair, the time-varying length of the $$i$$-th contact line, $$l(i, t)$$, can be derived based on gear geometry and the transverse ($$\varepsilon_\alpha$$) and axial ($$\varepsilon_\beta$$) contact ratios.
The total contact line length at any time $$t$$ is:
$$L(t) = \sum_{i=1}^{M} l(i, t)$$
where $$M = ceil(\varepsilon_\gamma)$$ and $$\varepsilon_\gamma = \varepsilon_\alpha + \varepsilon_\beta$$.
Consequently, the load carried by the first pair of contacting teeth is:
$$F_{n1}(t) = F_n \cdot \frac{l(1, t)}{L(t)}$$
The presence of a pitting flaw directly alters the effective contact line length. When a tooth with pitting enters the mesh, the instantaneous contact line length for that pair becomes:
$$l_{faulty}(i, t) = l(i, t) – l_{pit}(i, t)$$
where $$l_{pit}(i, t)$$ is the time-varying length of the pitted area projected onto the contact line. This reduction in effective contact length increases the load on the remaining healthy portions of the contact lines and introduces time-varying disturbances in the meshing stiffness and force.
1.3 Simulation Case Setup
The study focuses on a first-gear pair from a 7-speed dual-clutch automatic transmission. The parameters of the helical gears are detailed in Table 1.
| Parameter | Pinion | Gear |
|---|---|---|
| Number of Teeth, $$z$$ | 17 | 60 |
| Module, $$m_n$$ (mm) | 2.1 | 2.1 |
| Pressure Angle, $$\alpha_n$$ (°) | 17.5 | 17.5 |
| Helix Angle, $$\beta$$ (°) | 29 | 29 |
| Face Width (mm) | 19.8 | 16.9 |
The material for both helical gears is 20MnCrS5, with properties listed in Table 2.
| Property | Value |
|---|---|
| Density, $$\rho$$ (kg/m³) | 7840 |
| Young’s Modulus, $$E$$ (GPa) | 210 |
| Poisson’s Ratio, $$\nu$$ | 0.278 |
Different dynamic models were created to simulate various pitting conditions on the pinion, all located near the pitch line:
- Healthy Gear: Baseline model with no defects.
- Minor Pitting: An elliptical defect with major axis 5 mm and minor axis 1 mm (depth: 0.2 mm).
- Severe Pitting: A larger elliptical defect with major axis 10 mm and minor axis 2 mm (depth: 0.2 mm).
- Multi-Pit Pattern: Three circular pits of 2 mm diameter each (depth: 0.2 mm).
The simulation was run with an input pinion speed of 2500 rpm and a load torque of 250 N·m, corresponding to a nominal meshing frequency $$f_m = 708.33$$ Hz and a pinion rotational frequency $$f_{r} = 41.67$$ Hz.
2. Experimental Fatigue Pitting Test
To validate the simulation results, a gear contact fatigue test was conducted on a back-to-back test rig using the same gear pair. The operating conditions mirrored the simulation: input speed of 2500 rpm, load torque of 250 N·m, and spray lubrication. Tri-axial accelerometers were mounted on the bearing housings near both the input (pinion) and output shafts. Vibration signals were continuously monitored and recorded using an LMS Test.lab system at a sampling frequency of 8000 Hz. The test was periodically halted to inspect the gear teeth for pitting initiation and progression through an observation window. Vibration data corresponding to healthy, minor pitting, and severe pitting stages were collected for analysis.
3. Results and Analysis
The dynamic response was analyzed in both the time domain and the frequency domain. The Fast Fourier Transform (FFT) was applied to the simulated contact force and the experimentally measured vibration acceleration signals for detailed spectral analysis.
3.1 Time-Domain Analysis
The time-domain response of the contact force from the simulation is highly indicative of pitting severity.
- Healthy Gears: The contact force exhibits a uniform, periodic pattern with no significant impulsive events.
- Minor Pitting: The contact force signal becomes slightly more irregular and “sparse” compared to the healthy case, but no dominant, sharp impacts are visible.
- Severe Pitting: Pronounced periodic impacts appear in the contact force waveform. The time interval between these impacts is approximately 0.024 seconds, which corresponds exactly to the rotational period of the faulty pinion ($$T_r = 1/f_r = 1/41.67 \approx 0.024$$ s).
- Multi-Pit Pattern: The contact force shows a sparser distribution similar to the severe pitting case, but the number of distinct high-impact events is fewer.
The experimental vibration acceleration signals showed a congruent trend: increased amplitude and the emergence of periodic impulsive shocks with a period matching the pinion’s rotation as pitting progressed from minor to severe.
3.2 Frequency-Domain Analysis
The frequency domain offers deeper insights into the fault characteristics. The analysis focuses on the simulated contact force spectrum.
Healthy Gears: The spectrum is dominated by the meshing frequency $$f_m$$ and its harmonic $$2f_m$$. No significant sidebands or low-frequency peaks related to faults are present.
Faulty Gears (Minor & Severe Pitting): The spectra for both pitting levels show distinct changes:
- Low-Frequency Region: Peaks emerge at the pinion’s rotational frequency $$f_r$$ and its harmonics ($$2f_r$$, $$3f_r$$). The amplitude of these peaks increases significantly with pitting severity.
- High-Frequency Region (Around $$f_m$$ and $$2f_m$$): The amplitudes of $$f_m$$ and $$2f_m$$ may change slightly. More importantly, a series of sidebands appear around these meshing frequency components. The spacing between these sidebands and the central meshing frequency is equal to the pinion’s rotational frequency $$f_r$$ and its harmonics. For example, sidebands appear at $$f_m \pm f_r$$, $$f_m \pm 2f_r$$, $$2f_m \pm f_r$$, $$2f_m \pm 2f_r$$, etc. The amplitude of these sidebands is markedly higher for severe pitting compared to minor pitting.
The formula for these sidebands is generalized as:
$$f_{sideband} = n \cdot f_m \pm m \cdot f_r$$
where $$n = 1, 2, …$$ and $$m = 1, 2, 3, …$$
Multi-Pit vs. Large-Area Pitting Pattern: The spectral signature of the multi-pit pattern differs from the single large-area pitting. For the multi-pit pattern, the most prominent low-frequency peak is often at $$2f_r$$ (the second harmonic of the rotational frequency), rather than $$f_r$$ itself. Correspondingly, the sidebands around the meshing frequencies are primarily spaced at $$2f_r$$. In contrast, the large-area pitting generates stronger sidebands spaced at $$f_r$$.
3.3 Model Validation and Fault Identification Summary
A direct comparison between the simulation and experimental results confirms the accuracy of the dynamic model. The key fault frequencies identified in both domains align closely with theoretical values, as shown in Table 3.
| Frequency Type | Theoretical Value (Hz) | Simulation Value (Hz) | Experimental Value (Hz) | Error (Sim.) | Error (Exp.) |
|---|---|---|---|---|---|
| Pinion Rotational Freq. ($$f_r$$) | 41.67 | 41.62 | 41.23 | 0.12% | 1.05% |
| Meshing Frequency ($$f_m$$) | 708.33 | 708.09 | 707.48 | 0.03% | 0.12% |
Based on the combined time-domain and frequency-domain analysis, a framework for predicting and identifying pitting in helical gears can be established:
- Detection of Pitting Onset (Minor Pitting):
- Time Domain: Slight increase in signal amplitude and irregularity, but no strong periodic impacts.
- Frequency Domain: Appearance of the rotational frequency $$f_r$$ and its low-order harmonics in the spectrum. Appearance of low-amplitude sidebands around the meshing frequency $$f_m$$ and its harmonics, spaced by $$f_r$$.
- Identification of Severe Pitting:
- Time Domain: Clear, periodic impacts occurring at the rotational period of the faulty gear.
- Frequency Domain: Significant increase in the amplitude of $$f_r$$ and its harmonics. Pronounced increase in the amplitude of the sidebands around $$f_m$$ and $$2f_m$$, with spacing $$f_r$$.
- Distinguishing Pitting Pattern:
- Multi-Pit Pattern: The spectral signature is often dominated by the second harmonic of the rotational frequency ($$2f_r$$) and sidebands spaced by $$2f_r$$.
- Large-Area Pitting Pattern: The spectral signature is typically dominated by the fundamental rotational frequency ($$f_r$$) and sidebands spaced by $$f_r$$.
4. Conclusion
This study successfully demonstrates an integrated approach using dynamic simulation and experimental validation for the prediction and identification of fatigue pitting in helical gears. A nonlinear dynamic model incorporating the impact function method and the contact line percentage method effectively captures the dynamic response changes induced by pitting faults. The experimental results strongly validate the simulation model.
The key findings are:
- The dynamic response, particularly the contact force in simulation and vibration acceleration in practice, serves as a reliable indicator for pitting fault diagnosis in helical gears.
- In the time domain, the transition from a uniform signal to one with clear, periodic impacts (at the faulty gear’s rotation period) signals the progression from minor to severe pitting.
- In the frequency domain, the emergence and growth of the faulty gear’s rotational frequency and its harmonics, along with related sidebands around the meshing frequency and its harmonics, provide a definitive spectral signature for pitting. The spacing of the dominant sidebands ($$f_r$$ vs. $$2f_r$$) offers clues about the pitting pattern (large-area vs. multi-pit).
This methodology provides a valuable reference for model-based fault prediction and condition monitoring of helical gear systems in automotive and industrial applications, enabling early detection and mitigation of gear tooth surface degradation.