
As a core transmission component in automotive gearboxes, engineering machinery, and aerospace systems, helical gears operate under demanding conditions where their tooth surfaces are primarily subjected to contact stress. Among various failure modes, surface fatigue pitting stands out as a predominant fault in transmission systems. This type of damage compromises gear strength and can lead to catastrophic failure, directly impacting the performance and service life of the entire transmission unit. Therefore, the early and accurate detection of pitting faults in helical gears is of paramount importance for the development and reliable operation of powertrain systems across multiple industries.
Diagnosing pitting faults across different tooth surfaces and severity levels traditionally requires extensive experimental data, which is costly and time-consuming to acquire. To address this challenge, our research proposes an integrated methodology combining high-fidelity dynamic simulation with targeted experimental validation. This approach aims to establish a robust framework for identifying both the severity of pitting on a single tooth and the number of teeth affected by pitting in helical gear pairs.
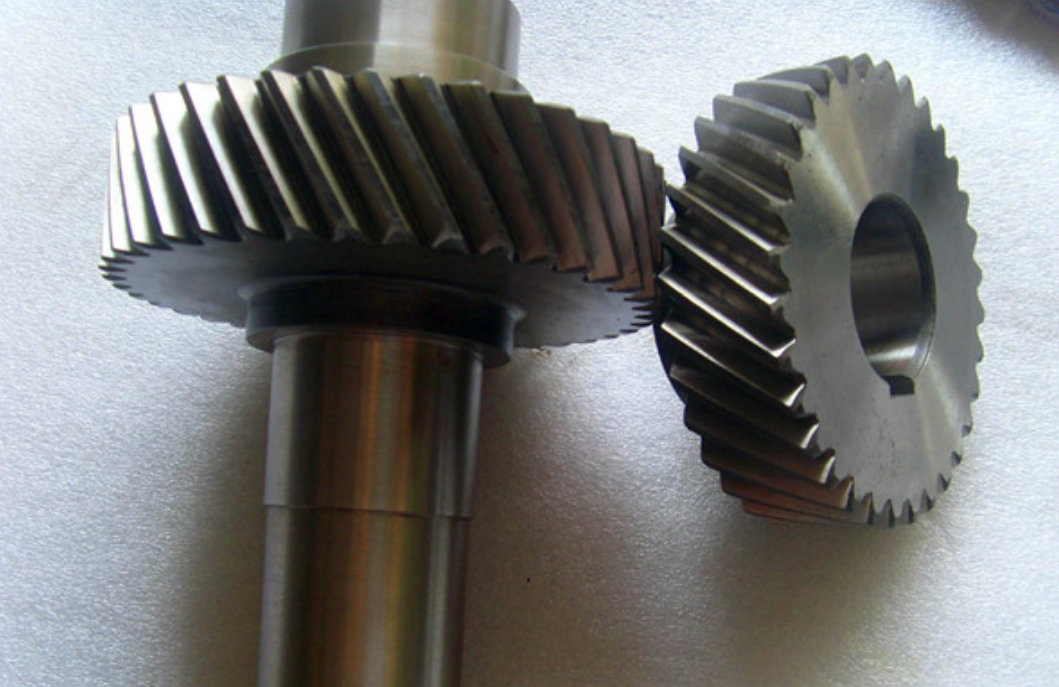
The foundation of our analysis is a detailed dynamic model of a helical gear pair, derived from the parameters of a 7-speed dual-clutch automatic transmission first gear. The key geometrical parameters for the helical gears used in this study are summarized in the table below.
| Gear | Number of Teeth | Normal Module (mm) | Pressure Angle (°) | Helix Angle (°) | Face Width (mm) |
|---|---|---|---|---|---|
| Driving Gear | 17 | 2.1 | 17.5 | 29 | 19.8 |
| Driven Gear | 60 | 16.9 |
To simulate pitting faults, we introduced ellipsoidal and rectangular surface defects on the tooth flanks. The specific fault configurations modeled were: (1) a single tooth with minor pitting (5 mm major axis, 1.5 mm minor axis), (2) a single tooth with severe pitting (10 mm major axis, 1.5 mm minor axis), (3) two teeth with pitting (combining minor and severe defects), and (4) multiple teeth (three) with pitting of varying sizes. All defects had a uniform depth of 0.2 mm. These models provide a basis for investigating the dynamic response of faulty helical gears.
The dynamic simulation model was constructed by importing the geometric models into a multi-body dynamics software. The process involved defining rotational joints, applying a driving speed of 2500 rpm to the input shaft and a load torque of 840 N·m to the output shaft, and critically, defining the gear contact interaction. The normal contact force between the helical gears was calculated using a formulation based on the spring-damper principle, where the key parameter is the mesh stiffness \(K\). The comprehensive mesh stiffness accounts for major deformations and is calculated by considering both the contact stiffness \(K_n\) and the bending stiffness \(K_b\) of the mating teeth:
$$ \frac{1}{K} = \frac{1}{K_n} + \frac{1}{K_{b1}} + \frac{1}{K_{b2}} $$
Where the contact stiffness for a line contact is given by:
$$ \frac{1}{K_n} = \frac{4(1 – \nu^2)}{\pi E B} $$
And the bending stiffness for a tooth is approximated by the integral:
$$ \frac{1}{K_b} = \int_0^d \frac{[(d – x) \cos\alpha_1 – h \sin\alpha_1]^2}{E I_x} dx $$
Here, \(E\) is the Young’s modulus, \(\nu\) is Poisson’s ratio, \(B\) is the face width, \(I_x\) is the area moment of inertia at a distance \(x\) from the tooth base, \(d\) is the distance from the base circle to the contact point along the tooth height, \(h\) is the distance from the contact point to the gear centerline, and \(\alpha_1\) is the angle between the contact force and the line perpendicular to the gear centerline. The subscripts 1 and 2 refer to the driving and driven gear teeth, respectively. The material properties and the final meshing parameters used for the dynamic contact in the simulation are listed in the following tables.
| Density (kg/m³) | Young’s Modulus, E (GPa) | Poisson’s Ratio, ν |
|---|---|---|
| 7840 | 210 | 0.278 |
| Mesh Stiffness, K (N/mm) | Collision Index | Damping Coefficient (N·s/mm) | Penetration Depth (mm) |
|---|---|---|---|
| 3.741 × 10⁵ | 1.5 | 48 | 0.1 |
The primary output from the dynamic simulation was the time-domain contact force signal between the mating helical gears. To extract meaningful fault features, the simulated signals were processed using Hilbert transform-based envelope spectrum analysis. The analytic signal \(y(t)\) is derived from the original signal \(x(t)\):
$$ y(t) = \frac{1}{\pi} \int_{-\infty}^{\infty} \frac{x(\tau)}{t – \tau} d\tau $$
The envelope spectrum is then obtained by taking the magnitude of the analytic signal’s Fourier transform. This technique is particularly effective for demodulating amplitude-modulated vibration signals characteristic of gear faults, revealing modulating frequencies related to the shaft rotation.
For the given operating condition, the characteristic frequencies are calculated. The pinion (driving gear) rotational frequency \(f_r\) and the gear mesh frequency \(f_m\) are fundamental for diagnosis:
$$ f_r = \frac{n}{60} = \frac{2500}{60} \approx 41.67 \, \text{Hz} $$
$$ f_m = f_r \times z_1 = 41.67 \times 17 \approx 708.3 \, \text{Hz} $$
The analysis of the simulated contact force signals yielded distinct patterns for different pitting scenarios in helical gears. For a healthy gear pair, the time-domain signal was relatively smooth, and its envelope spectrum was dominated by the mesh frequency \(f_m\) and its harmonic \(2f_m\). The introduction of minor pitting on a single tooth flank caused negligible change in the time-domain amplitude (~2% increase) but induced significant changes in the frequency domain. The envelope spectrum revealed the appearance of the pinion’s rotational frequency \(f_r\) and its harmonics (\(2f_r\), \(3f_r\)) in the low-frequency region. Furthermore, sidebands spaced at \(\pm f_r\) emerged around the primary mesh frequency components \(f_m\) and \(2f_m\).
When the single-tooth pitting severity increased, the time-domain response of the helical gears showed a clear periodic impulse with an interval of approximately 0.024 s, matching the pinion’s rotational period (\(1/f_r\)). In the frequency domain, the amplitudes of the rotational frequency harmonics and the mesh frequency sidebands increased significantly (up to 9% for mesh frequency amplitude), and the number of visible sidebands increased, indicating stronger modulation.
The investigation into multiple-tooth pitting in helical gears revealed more complex dynamics. For two pitted teeth, the time-domain signal exhibited larger and more frequent periodic impulses compared to the single-tooth severe case, though the overall amplitude increased only moderately (~9%). The corresponding envelope spectrum showed a substantial increase in the amplitude of the low-frequency rotational harmonics (up 46%) and a greater number of higher-amplitude sidebands around \(f_m\) and \(2f_m\). The case with pitting on three teeth presented the most pronounced effects. The time-domain signal was characterized by large, sparse, high-amplitude impulses. Spectrally, the amplitudes of \(f_r\), \(2f_r\), and \(3f_r\) were dramatically elevated (150% higher than the two-tooth case), and the region between 0 and 800 Hz became populated with a high number of significant sidebands, while the absolute amplitude at \(f_m\) itself began to diminish relative to the sideband levels.
To validate the accuracy of the dynamic simulation model for helical gear pitting faults, a dedicated gear contact fatigue test was conducted. The experimental setup mirrored the simulation conditions, operating at 2500 rpm input speed and 240 N·m input torque (840 N·m output torque). Tri-axial vibration acceleration sensors, mounted on the bearing housings close to the test gears, collected data at a 12 kHz sampling rate throughout the gear’s life cycle, from healthy state to advanced pitting.
The analysis of the experimental vibration signals confirmed the trends predicted by the simulation. The envelope spectra of signals from progressively damaged helical gears showed a consistent evolution. The healthy state showed only \(f_m\) and its harmonics. Minor single-tooth pitting introduced \(f_r\) and its low-order harmonics, along with \(\pm f_r\) sidebands around the mesh frequencies. Severe single-tooth pitting intensified these features and added more sidebands. The transition to two and then three pitted teeth was marked by a massive growth in the number and amplitude of sidebands in the low-to-mid frequency range (0-800 Hz) and a relative suppression of the pure mesh frequency peak, exactly as foreseen by the simulation model. The time-domain signals also exhibited the predicted impulse behavior correlating with the pinion’s rotation period.
The consistent correlation between the simulated contact force characteristics and the experimentally measured vibration acceleration characteristics validates the proposed dynamic model as a reliable tool for studying pitting faults in helical gears. The key diagnostic features extracted from both simulation and experiment are synthesized in the table below. This provides a practical reference for condition monitoring and fault diagnosis of helical gear transmissions.
| Fault State | Time-Domain Signature | Envelope Spectrum Signature |
|---|---|---|
| Healthy Helical Gears | Smooth, no distinct impulses. | Dominant peaks at mesh frequency \(f_m\) and harmonic \(2f_m\). No low-frequency rotational peaks. |
| Single Tooth, Minor Pitting | Amplitude distribution becomes slightly irregular. No clear periodic impulses. | Appearance of \(f_r\), \(2f_r\), \(3f_r\) in low-frequency region. Sidebands at \(\pm f_r\) around \(f_m\) and \(2f_m\). |
| Single Tooth, Severe Pitting | Clear periodic impulses with period \(T = 1/f_r\). Overall amplitude increases. | Amplitudes of \(f_r\), \(2f_r\), \(3f_r\) and sidebands increase. Number of sidebands around \(f_m/2f_m\) increases. |
| Two Teeth with Pitting | Frequent, large periodic impulses at \(T = 1/f_r\). Signal appears dense. | Further increase in amplitude of low-frequency harmonics (\(f_r\), \(2f_r\), \(3f_r\)). Significant increase in number and amplitude of sidebands around mesh frequencies. Sidebands begin to appear in the region between \(f_r\) and \(f_m\). |
| Multiple Teeth (>2) with Pitting | Very large, sparse periodic impulses at \(T = 1/f_r\). Maximum overall amplitude observed. | Maximum amplitude of low-frequency harmonics (\(f_r\), \(2f_r\), \(3f_m\)). Mesh frequency \(f_m\) peak may reduce relative to sidebands. Region between 0-800 Hz filled with numerous high-amplitude sidebands. |
In conclusion, this study successfully demonstrates a combined simulation and experimental approach for the diagnosis of surface pitting in helical gears. The developed dynamic fault model accurately captures the essential physics of the interaction between pitted tooth surfaces in helical gears, as verified by experimental data. The research provides clear, actionable diagnostic criteria: the emergence and growth of rotational frequency harmonics and mesh frequency sidebands signal the onset and progression of single-tooth pitting, while the proliferation of sidebands across the low-to-mid frequency spectrum, coupled with specific time-domain impulse patterns, are key indicators of multi-tooth pitting damage. This work offers a solid foundation for the health state prediction and proactive maintenance of critical helical gear transmission systems, reducing reliance on purely data-driven methods and enhancing diagnostic understanding.