
In the field of industrial robotics, the rotary vector reducer plays a critical role in ensuring precision, load capacity, and operational stability, particularly in heavy-duty applications. As a key component in robotic joint systems, the performance of the rotary vector reducer directly impacts trajectory accuracy, efficiency, and overall system reliability. Among its various performance metrics, torsional stiffness stands out as a fundamental property that influences dynamic behavior, including vibration suppression and positional accuracy. Insufficient stiffness can lead to deviations in motion paths, causing tremors and failures in robotic operations. Therefore, a comprehensive understanding and accurate measurement of the stiffness characteristics of rotary vector reducers are essential for advancing robotic technology. In this article, I will delve into the experimental testing and analytical methods for evaluating the stiffness of rotary vector reducers, focusing on a detailed case study that highlights testing procedures, data analysis techniques, and practical insights. The goal is to provide a thorough resource for engineers and researchers working on the design and evaluation of these critical components.
The importance of stiffness in rotary vector reducers cannot be overstated. Stiffness, defined as the resistance to deformation under applied torque, determines how well a reducer maintains its structural integrity during operation. In high-precision applications, such as assembly lines or surgical robots, even minor deformations can result in significant errors. The rotary vector reducer, with its complex gear architecture involving cycloidal gears and pin wheels, exhibits nonlinear stiffness behavior due to factors like contact deformations, bearing compliance, and gear backlash. This nonlinearity necessitates precise testing and sophisticated analysis to characterize its performance accurately. Over the years, numerous studies have explored the stiffness of gear reducers, employing various methodologies from analytical modeling to experimental validation. For instance, researchers have developed semi-analytical models to describe nonlinear stiffness, used finite element simulations to assess component interactions, and conducted comparative tests to benchmark different reducer types. Building on this foundation, my work aims to contribute a practical framework for stiffness testing and analysis, leveraging advanced test benches and computational methods to derive reliable stiffness parameters.
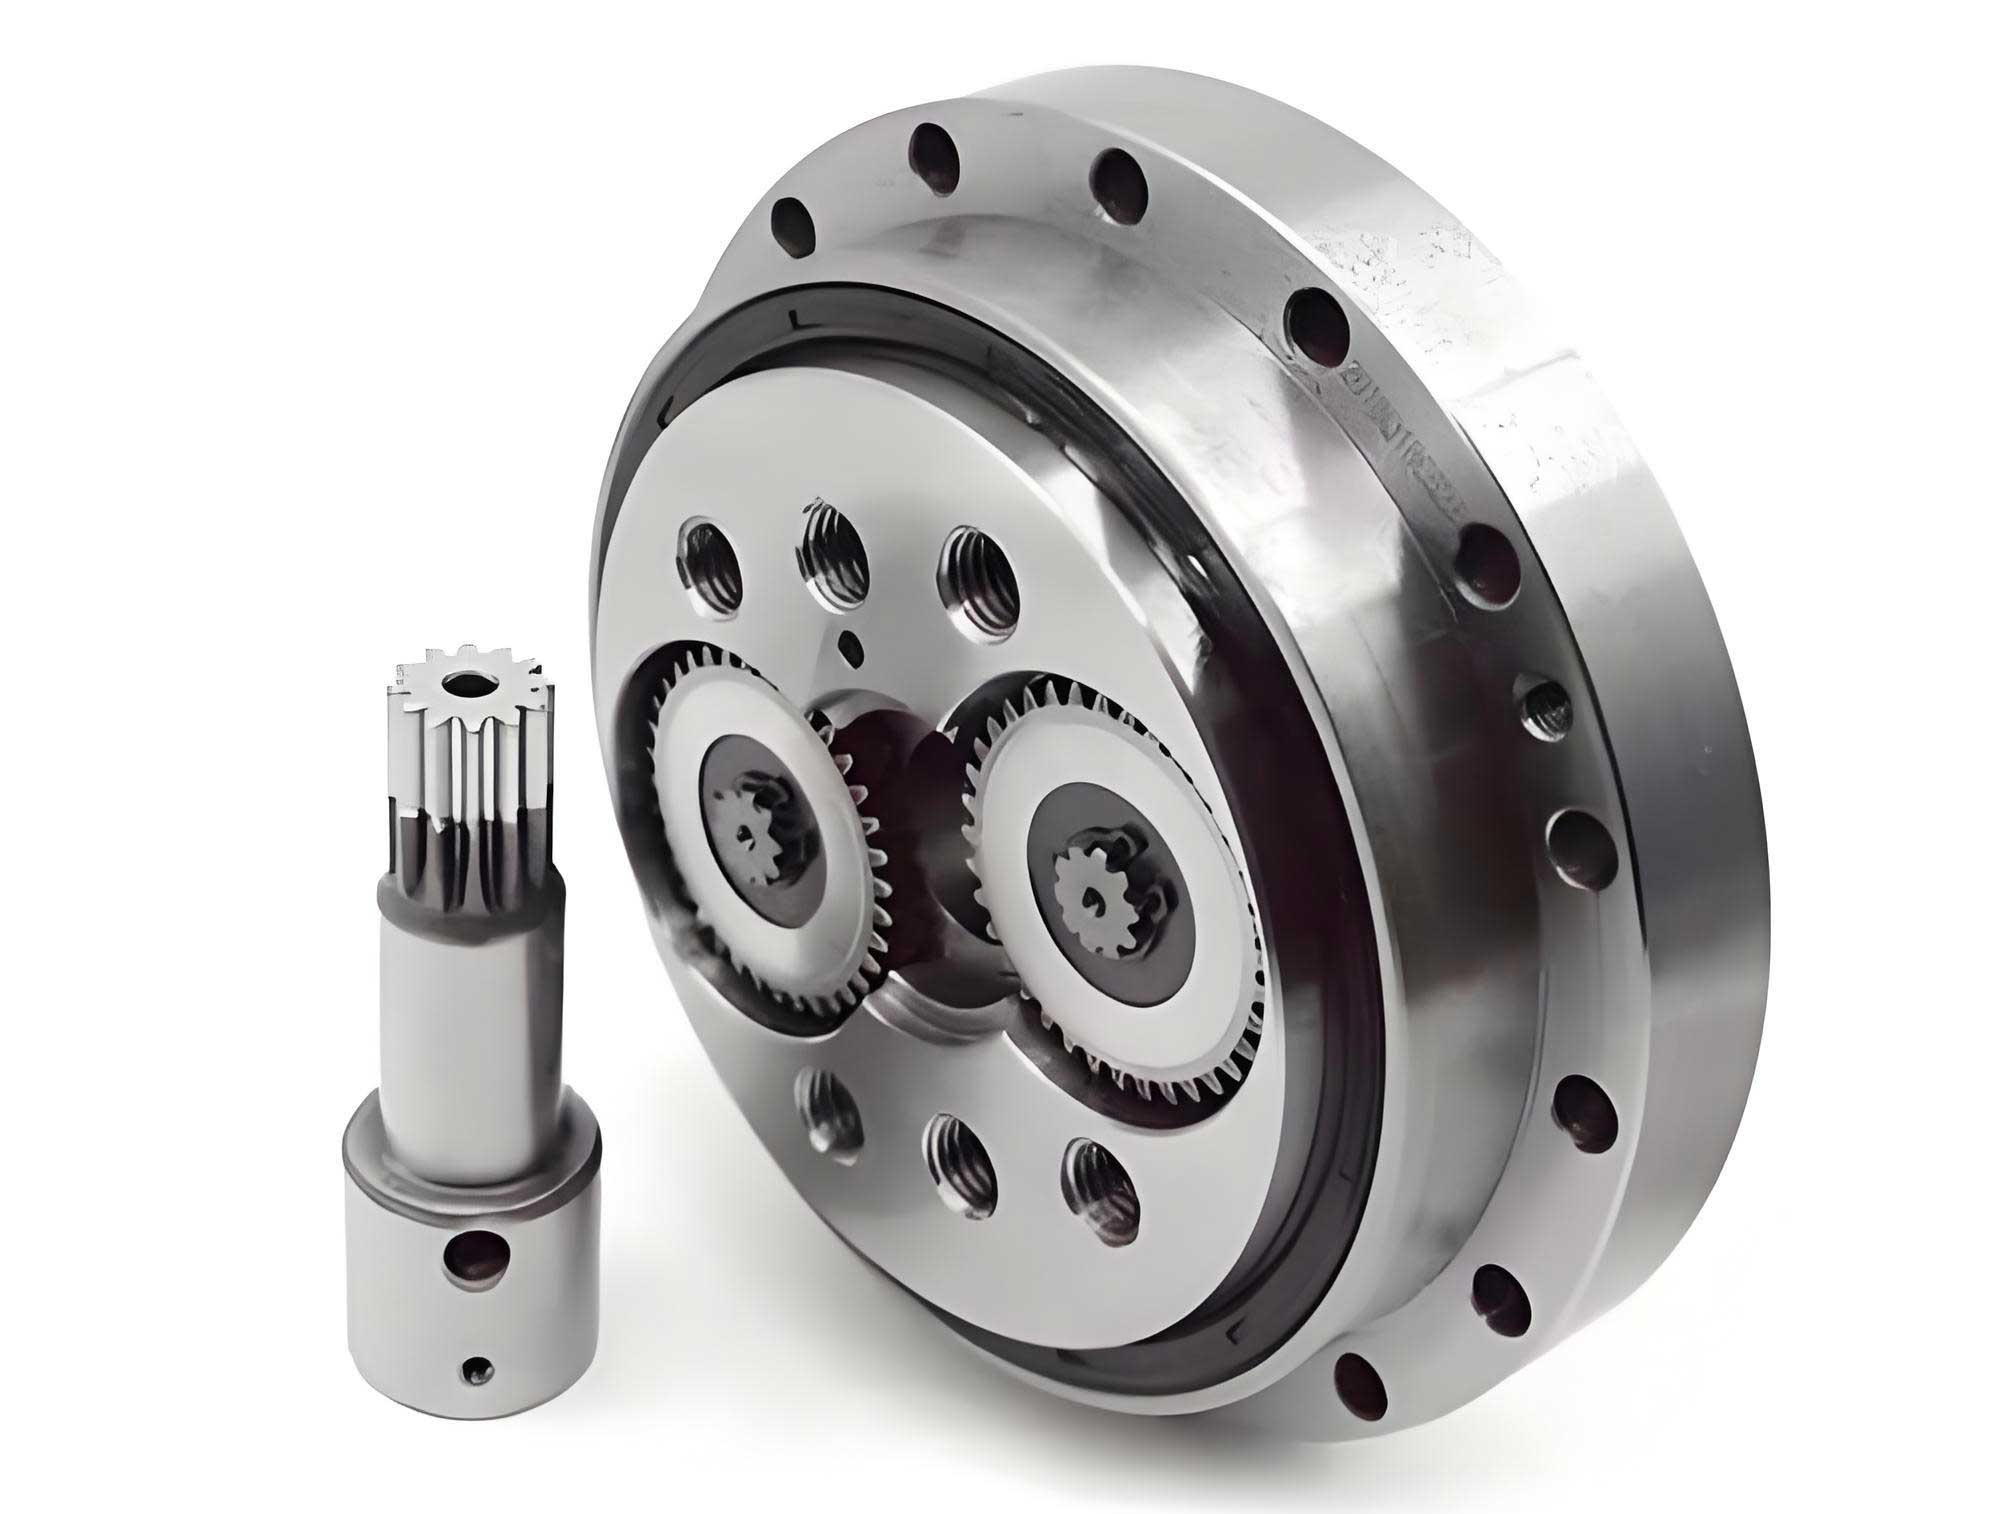
To assess the stiffness characteristics of a rotary vector reducer, I utilized a precision reducer comprehensive performance test bench. This setup is designed to simulate real-world operating conditions while providing high-fidelity measurements of torque and angular displacement. The test bench consists of several key components: a drive motor for input, torque sensors for load monitoring, bearing seats for support, angular sensors at both the input and output ends, and the rotary vector reducer under test. In my experiments, I focused on a specific model, the RV-40E reducer, which has a transmission ratio of 121. This rotary vector reducer is commonly used in industrial robots due to its high torque capacity and compact design. The testing procedure involved locking the input shaft of the rotary vector reducer to simulate a fixed input condition, while applying a controlled torque at the output end via a load motor. The load was increased gradually to the rated torque of 300 N·m at a slow rotational speed of 0.05 r/min, then reversed to unload, with this cycle repeated three times to capture hysteresis effects. Data on output angle and torque were recorded in real-time using a National Instruments (NI) host system, allowing for the generation of stiffness curves that depict the relationship between torque and angular displacement.
The stiffness testing of the rotary vector reducer revealed several interesting phenomena, most notably hysteresis and backlash. Hysteresis refers to the nonlinear behavior where the loading and unloading paths do not coincide, resulting in energy loss due to internal friction and material damping. In the context of the rotary vector reducer, hysteresis manifests as a loop in the torque-angle curve, with the area inside the loop representing the energy dissipated per cycle. Backlash, on the other hand, is the angular lost motion when the direction of rotation changes, caused by gaps between mating gears. During testing, I observed that as torque was applied and removed, the output angle did not return to its original position, leaving a small residual angle known as the empty travel or backlash. This characteristic is critical for precision applications, as excessive backlash can lead to positional inaccuracies. The test data for the rotary vector reducer were exported and processed to generate hysteresis stiffness curves, which serve as the basis for further analysis. A total of 14 test runs were conducted, with varying input angles at which the input shaft was locked. These angles were selected randomly to assess the influence of initial position on stiffness behavior, but as will be shown, the stiffness of the rotary vector reducer proved to be largely independent of angular orientation.
In analyzing the stiffness data, it is important to account for systemic errors that may arise from the test setup itself. The measured torsional stiffness includes contributions not only from the rotary vector reducer but also from auxiliary components such as the input shaft, output shaft, and couplings. To isolate the true stiffness of the rotary vector reducer, a correction formula is applied. Based on mechanical principles, the actual torsional stiffness \( K \) can be derived from the measured stiffness \( K_r \) using the following equation:
$$ K = \frac{1}{\frac{1}{K_r} – \frac{1}{K_i i^2} – \frac{1}{K_1}} $$
where \( i \) is the transmission ratio (121 for the RV-40E reducer), \( K_i \) is the torsional stiffness of the input shaft, and \( K_1 \) is the torsional stiffness of the output shaft. This correction ensures that the stiffness values reflect the intrinsic properties of the rotary vector reducer, enabling fair comparisons and accurate performance assessments. In my experiments, I assumed typical stiffness values for the shafts based on material properties and dimensions, though for precise applications, these parameters should be measured separately. The corrected stiffness values were then used to evaluate the performance of the rotary vector reducer against manufacturer specifications.
The results from the 14 test runs provided a rich dataset for analyzing the stiffness characteristics of the rotary vector reducer. Below, I present a summary of key parameters, including hysteresis loss and backlash, in Table 1. Hysteresis loss, measured in arcseconds, represents the energy dissipation per cycle, while backlash indicates the angular clearance in the gear system. These parameters are crucial for determining the efficiency and precision of the rotary vector reducer.
| Test Group | Hysteresis Loss (arcseconds) | Backlash (arcseconds) |
|---|---|---|
| 1 | 7 | 31 |
| 2 | 7 | 31 |
| 3 | 7 | 31 |
| 4 | 8 | 32 |
| 5 | 8 | 32 |
| 6 | 9 | 31 |
| 7 | 8 | 32 |
| 8 | 8 | 32 |
| 9 | 1 | 16 |
| 10 | 1 | 16 |
| 11 | 1 | 16 |
| 12 | 1 | 16 |
| 13 | 4 | 22 |
| 14 | 2 | 27 |
From Table 1, it is evident that hysteresis loss ranges from 1 to 9 arcseconds, with most values clustered around 7-8 arcseconds. This low hysteresis loss suggests that the rotary vector reducer exhibits minimal internal damping, which is desirable for efficient power transmission. Backlash values vary between 16 and 32 arcseconds, with an average of approximately 26 arcseconds. According to industry standards for robotic reducers, a backlash of less than 1 arcminute (60 arcseconds) is classified as Grade 1 precision. Since the maximum backlash observed in my tests is 32 arcseconds, well below this threshold, the rotary vector reducer meets the highest accuracy grade. This highlights the superior design and manufacturing quality of the rotary vector reducer, ensuring reliable performance in precision applications.
To further quantify the stiffness, I focused on calculating the torsional stiffness from the torque-angle curves. Torsional stiffness, expressed in units of N·m per arcminute, is a measure of how much torque is required to produce a unit angular deflection. For the rotary vector reducer, this parameter is critical for predicting dynamic behavior under load. I employed four different first-order linear processing methods to compute torsional stiffness from the experimental data: the estimation method, the endpoint selection method, the two-point connection method, and the average analysis method. Each method has its advantages and limitations, which I will discuss in detail. The estimation method involves visually approximating the linear portion of the hysteresis curve, while the endpoint selection method uses the extreme points of the curve. The two-point connection method draws a line between specific data points, and the average analysis method calculates stiffness by averaging slopes across multiple segments. These methods are applied to the data from Test Groups 1 and 4, with results summarized in Table 2.
| Test Group | Estimation Method (N·m/arcmin) | Endpoint Selection Method (N·m/arcmin) | Two-Point Connection Method (N·m/arcmin) | Average Analysis Method (N·m/arcmin) |
|---|---|---|---|---|
| 1 | 64.456 | 76.871 | 79.039 | 66.589 |
| 4 | 54.996 | 68.455 | 65.056 | 55.328 |
The results in Table 2 show that the estimation and average analysis methods yield similar torsional stiffness values, around 55-67 N·m/arcmin, while the endpoint selection and two-point connection methods produce higher values, up to 79 N·m/arcmin. This discrepancy arises from the different ways each method handles the nonlinear aspects of the curve. For instance, the endpoint selection method may overestimate stiffness by ignoring intermediate deformations, whereas the average analysis method provides a more balanced view by considering the entire dataset. The manufacturer’s specification for the rotary vector reducer requires a torsional stiffness greater than 49 N·m/arcmin. All computed values exceed this threshold, confirming that the tested rotary vector reducer meets performance standards. However, for design and simulation purposes, it is advisable to use a consistent method, such as the average analysis method, to ensure comparability across different reducers.
Beyond numerical analysis, the stiffness curves themselves offer valuable insights into the behavior of the rotary vector reducer. I plotted nonlinear stiffness curves for selected test groups (1, 4, 7, 10, and 13), which represent different input angles. These curves, though not shown here due to formatting constraints, demonstrated excellent linearity and consistency across all tests. This indicates that the stiffness of the rotary vector reducer is largely independent of the initial angular position, a desirable trait for robotic applications where orientation may vary. The curves also revealed that during the first loading cycle, minor deviations occurred due to settling effects, but subsequent cycles showed重合, indicating stable hysteresis behavior. This stability is crucial for repetitive tasks in industrial automation. The overall shape of the curves can be described by a polynomial function, such as a cubic fit, which captures the nonlinear stiffness. For example, the torque \( T \) as a function of angle \( \theta \) can be modeled as:
$$ T(\theta) = a_0 + a_1 \theta + a_2 \theta^2 + a_3 \theta^3 $$
where \( a_0, a_1, a_2, a_3 \) are coefficients determined through regression analysis. Such models are useful for simulating the dynamic response of robotic systems incorporating rotary vector reducers.
The implications of stiffness characteristics extend beyond mere performance metrics. In robotic systems, the rotary vector reducer’s stiffness affects control stability, resonance frequencies, and energy consumption. A stiffer reducer reduces compliance, allowing for faster and more accurate positioning, but may also transmit more vibrations from the motor. Conversely, a more compliant reducer can absorb shocks but might lead to overshoot or oscillations. Therefore, optimizing stiffness is a trade-off that depends on the specific application. For heavy-duty robots, high stiffness is preferred to handle large loads, while for collaborative robots, moderate stiffness may enhance safety. My findings suggest that the rotary vector reducer tested offers a balanced stiffness profile, suitable for a wide range of industrial uses. Additionally, the low hysteresis loss implies minimal heat generation during operation, contributing to energy efficiency and longer service life.
To place this work in a broader context, I reviewed existing literature on reducer stiffness. Previous studies have employed various approaches, from analytical models based on Hertzian contact theory to finite element simulations of gear meshing. For instance, some researchers have focused on the stiffness of cycloidal gears within rotary vector reducers, considering factors like tooth profile modifications and bearing deformations. Others have developed lumped-parameter models to predict overall stiffness under dynamic loads. My experimental approach complements these efforts by providing empirical data that can validate and refine theoretical models. Moreover, the use of multiple linear processing methods addresses the challenge of extracting meaningful stiffness values from nonlinear data, a common issue in reducer testing. By comparing these methods, I offer practical guidance for engineers on how to interpret test results for rotary vector reducers.
In terms of testing methodology, the precision test bench used in this study represents state-of-the-art equipment for reducer evaluation. It integrates high-resolution sensors, automated control systems, and data acquisition software, enabling accurate and repeatable measurements. For future work, I recommend expanding the test matrix to include varying load rates, temperature conditions, and long-duration cycles to assess fatigue effects. Additionally, combining experimental data with digital twin simulations could enhance predictive maintenance strategies for rotary vector reducers in field applications. The stiffness parameters derived from tests can be fed into robot dynamics models to optimize control algorithms, ultimately improving robotic performance.
From a design perspective, the stiffness of a rotary vector reducer is influenced by several factors, including material selection, gear geometry, and assembly tolerances. Advanced materials like hardened steel or composites can enhance stiffness while reducing weight. Geometric optimizations, such as optimized tooth profiles for cycloidal gears, can minimize stress concentrations and improve load distribution. Furthermore, precision manufacturing techniques are essential to control backlash and ensure consistent stiffness across production batches. My experiments underscore the importance of rigorous testing to verify design intent, as even small variations can impact performance. For manufacturers of rotary vector reducers, implementing stiffness testing as part of quality assurance protocols is crucial to meet the demanding requirements of modern robotics.
In conclusion, the stiffness characteristics of rotary vector reducers are vital for their performance in robotic systems. Through comprehensive testing and analysis, I have demonstrated that the RV-40E rotary vector reducer exhibits high torsional stiffness, low hysteresis loss, and minimal backlash, conforming to Grade 1 accuracy standards. The stiffness was found to be independent of angular position, ensuring reliable operation across different orientations. Four linear processing methods were applied to compute torsional stiffness, with the average analysis method recommended for its consistency. These findings contribute to the broader understanding of rotary vector reducer behavior and provide a framework for future research and development. As robotics continue to evolve towards higher precision and greater loads, the insights gained from stiffness analysis will play a key role in advancing reducer technology. Ultimately, a deep grasp of stiffness properties enables the design of more efficient, durable, and precise robotic systems, driving innovation in automation and beyond.
The rotary vector reducer, as a cornerstone of robotic actuation, deserves continued attention from researchers and engineers. By integrating experimental testing with advanced modeling, we can unlock new potentials in reducer design, leading to robots that are more capable and adaptable. I encourage the community to build upon this work, exploring novel materials, innovative geometries, and smart monitoring techniques to further enhance the performance of rotary vector reducers. Through collaborative efforts, we can ensure that these critical components meet the ever-growing demands of industrial automation, from manufacturing floors to exploration missions. The journey towards perfecting rotary vector reducers is ongoing, and I am confident that with rigorous analysis and creative engineering, we will achieve new heights in robotic excellence.