
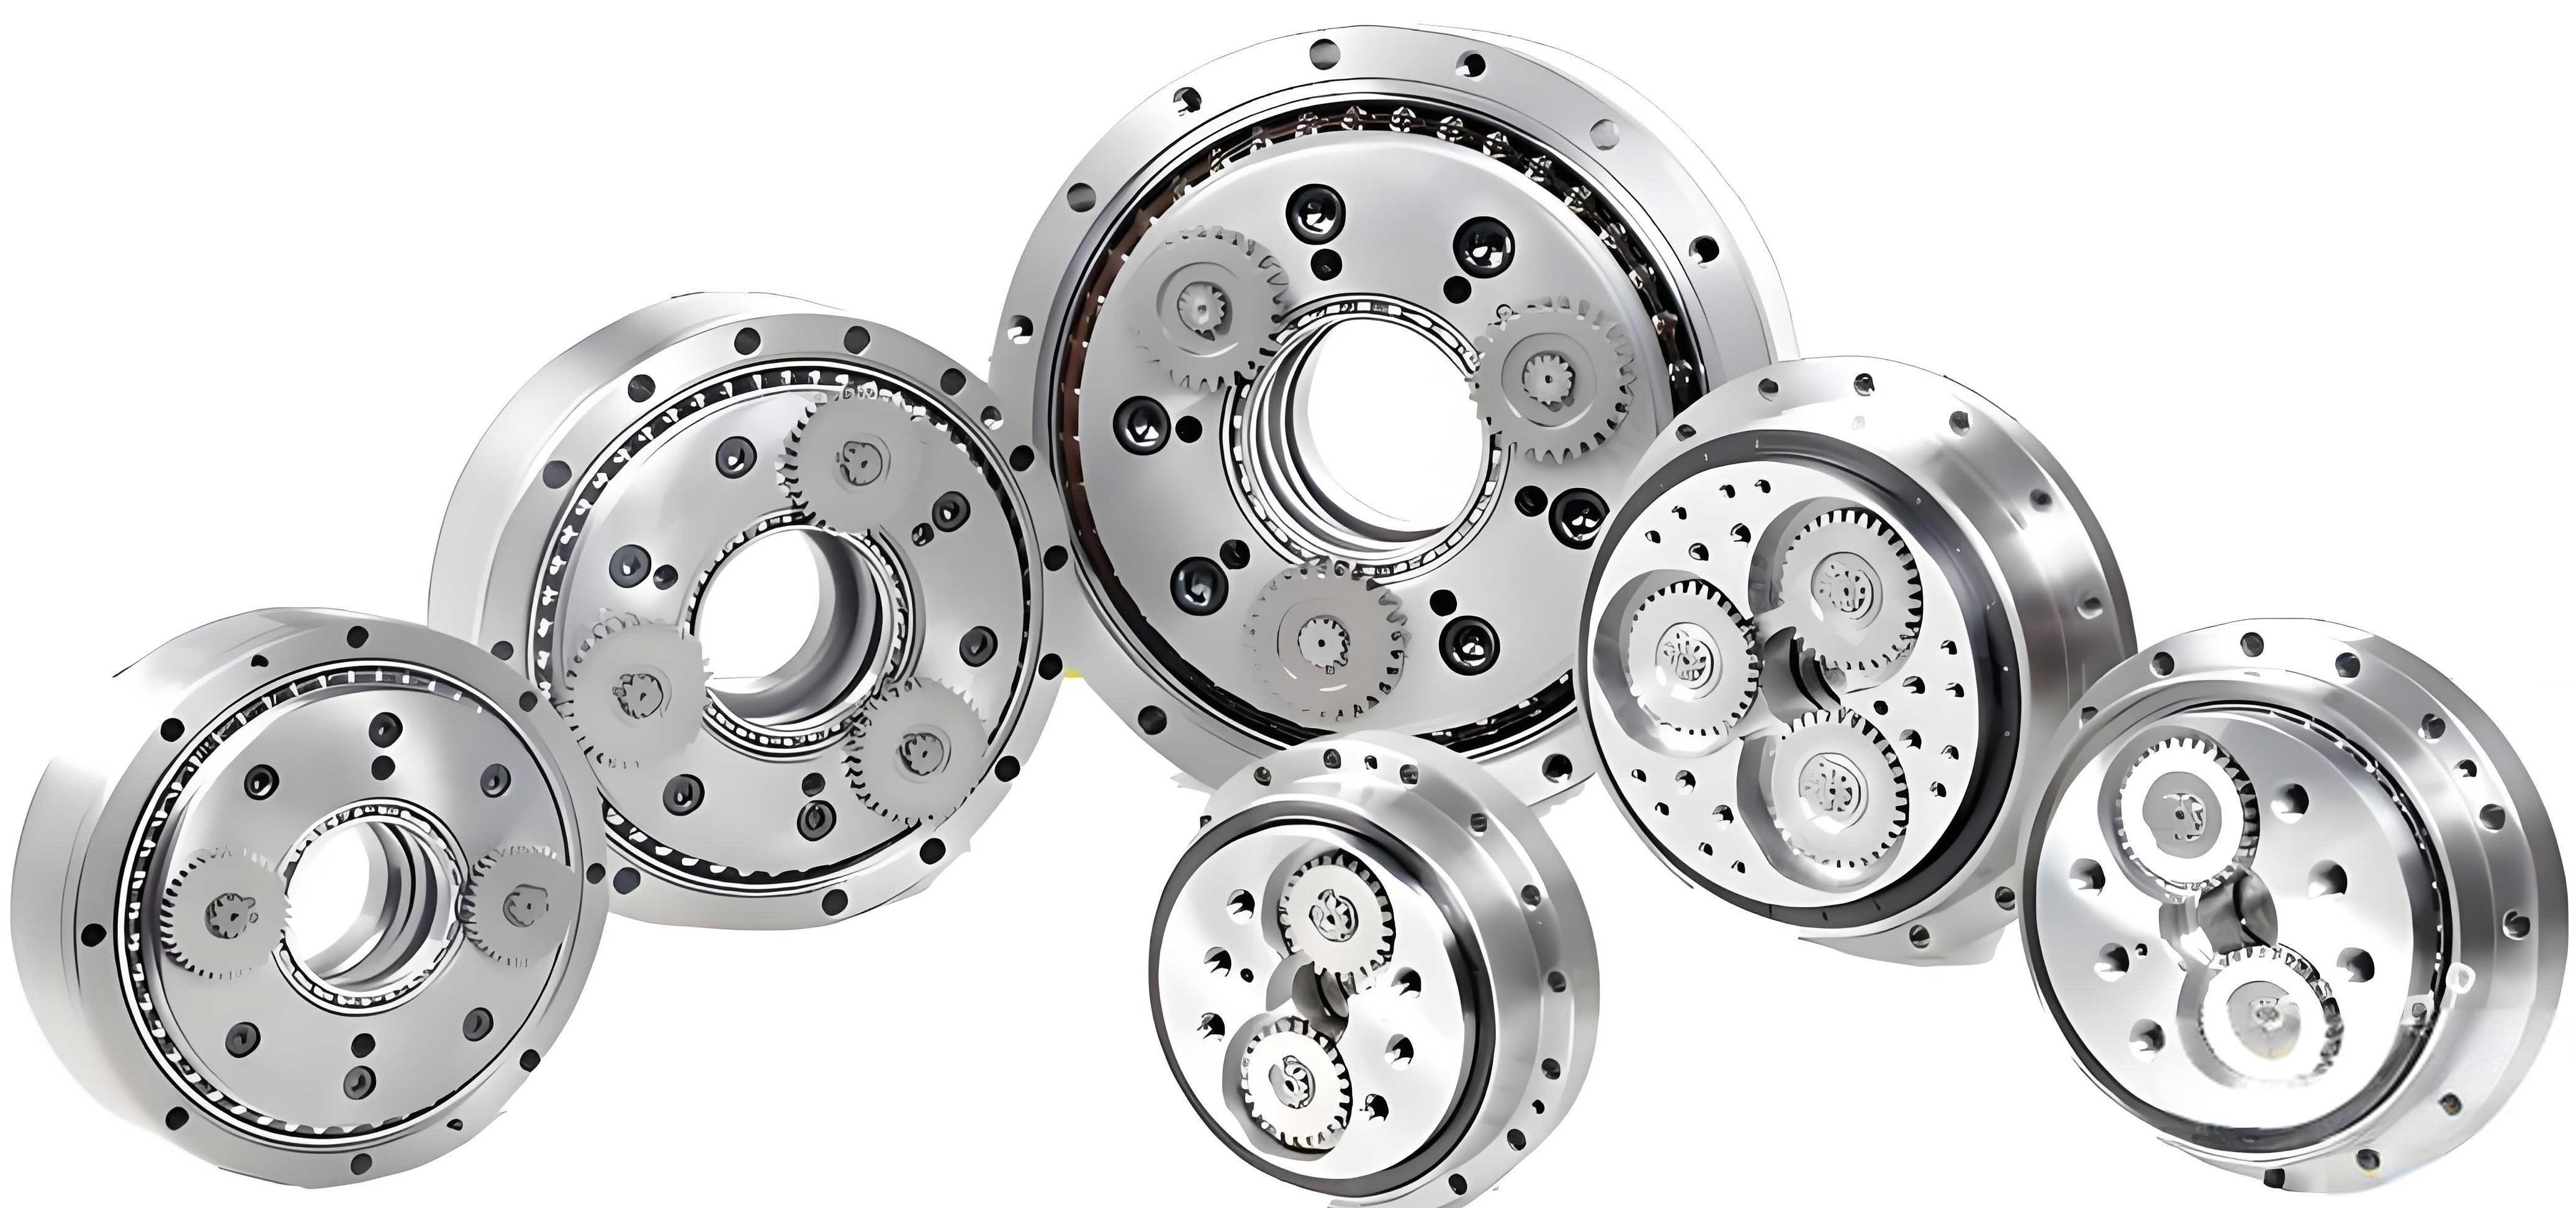
In the field of industrial robotics, the rotary vector reducer stands as a critical component for joint actuation, prized for its high torque capacity, compact size, and precision. The cycloidal pin gear transmission mechanism lies at the heart of the rotary vector reducer’s performance, enabling its exceptional load-bearing characteristics. This transmission involves the meshing of a cycloidal disk with a set of stationary pins housed within a pin gear shell, converting eccentric motion into reduced rotary output. The reliability of this interface directly dictates the overall durability and functional integrity of the rotary vector reducer. In this study, we conduct a comprehensive investigation into the reliability and parametric sensitivity of the cycloidal pin gear transmission system through integrated three-dimensional modeling, finite element analysis, and advanced statistical methods.
The operational principle of a standard rotary vector reducer involves a two-stage speed reduction. The first stage typically consists of a planetary gear train, while the second, high-torque stage is realized through the cycloidal pin gear mechanism. A crank shaft, driven by the first stage, imparts an eccentric motion to the cycloidal disks. As these disks rotate eccentrically, their lobed profiles engage with the fixed pins, resulting in a slow, high-torque rotation of the output carrier. The design ensures multiple tooth contacts simultaneously, distributing the load and contributing to the high stiffness and smooth operation that make the rotary vector reducer indispensable in precision applications.
To analyze the mechanical behavior of this system, we begin by deriving the mathematical foundation for the cycloidal tooth profile. The theoretical profile of a cycloidal gear, generated by a pin rolling on a circle, is described by a set of parametric equations. The coordinates of a point on the theoretical tooth profile, relative to the cycloidal disk’s center, are given by:
$$ \begin{cases}
X = r_p \cos\left[(1 – i_H)\theta\right] – a \cos(i_H \theta) \\
Y = -r_p \sin\left[(1 – i_H)\theta\right] – a \sin(i_H \theta)
\end{cases} $$
where \( r_p \) is the pitch circle diameter of the pin distribution, \( a \) is the eccentricity of the crank shaft, \( i_H = Z_p / Z_c \) is the transmission ratio, with \( Z_p \) being the number of pins and \( Z_c \) the number of teeth on the cycloidal disk, and \( \theta \) is the generating angle. For practical manufacturing and assembly, including considerations for lubrication and backlash, the theoretical profile is often offset. The equidistant profile, representing the actual machining path, is formulated as:
$$ \begin{cases}
X = (r_p – r_{rp}S) \cos\left[(1 – i_H)\theta\right] – (a – k_1 r_{rp}S) \cos(i_H \theta) \\
Y = -(r_p – r_{rp}S) \sin\left[(1 – i_H)\theta\right] + (a – k_1 r_{rp}S) \sin(i_H \theta)
\end{cases} $$
Here, \( r_{rp} \) is the radius of the pins, \( k_1 = a Z_p / r_p \), and \( S = (1 + k_1^2 – 2k_1 \cos \theta)^{-1/2} \). Further modifications, known as profile modifications, are applied to optimize performance and compensate for deformations under load. The modified tooth profile equation incorporates correction terms \( \Delta r_{rp} \) for pin radius and \( \Delta r_p \) for the pin distribution circle radius:
$$ \begin{cases}
X = \left[(r_p + \Delta r_p) – (r_{rp} + \Delta r_{rp})S\right] \cos\left[(1 – i_H)\theta\right] – \left[a – k_1 (r_{rp} + \Delta r_{rp})S\right] \cos(i_H \theta) \\
Y = -\left[(r_p + \Delta r_p) – (r_{rp} + \Delta r_{rp})S\right] \sin\left[(1 – i_H)\theta\right] + \left[a – k_1 (r_{rp} + \Delta r_{rp})S\right] \sin(i_H \theta)
\end{cases} $$
These equations were programmed into SolidWorks to generate a precise three-dimensional solid model of the cycloidal disk. The disk’s width \( B \) was determined by the relation \( B = r_p f \), where \( f \) is a design coefficient. To accurately simulate the eccentric motion within the finite element environment, a simplified eccentric crank element was modeled and assembled with the cycloidal disk. The complete transmission sub-assembly includes the cycloidal disk, the array of pins, and the pin gear shell, forming the core kinematic chain of the rotary vector reducer.
The finite element model was constructed in ANSYS Workbench to perform a transient dynamic analysis, capturing the stress evolution during meshing. The material properties assigned to the components are summarized in the table below, which are crucial for determining the structural response under load.
| Component | Material | Young’s Modulus (N/m²) | Poisson’s Ratio |
|---|---|---|---|
| Cycloidal Disk | 20CrMnMo | 2.07 × 10¹¹ | 0.254 |
| Pins | GCr15 | 2.08 × 10¹¹ | 0.3 |
| Pin Gear Shell | QT500-7 | 1.68 × 10¹¹ | 0.24 |
To balance computational accuracy and efficiency, a strategic meshing approach was employed. The pin gear shell and the eccentric crank were treated as rigid bodies since the focus is on the contact stresses between the cycloidal disk and the pins. The regions of anticipated contact between the cycloidal teeth and the pins were densely meshed with hexahedral elements, which offer superior resistance to distortion and higher accuracy. The rest of the model was meshed with a coarser grid. The final mesh consisted of approximately 197,000 nodes and 40,000 elements, with an average element quality metric of 0.72. A mesh independence study was conducted by refining the contact region mesh, which resulted in a stress variation of less than 6%, confirming the reliability of the simulation results.
Boundary conditions and loads were applied to replicate the operational state of the rotary vector reducer. The kinematic relationship for the entire reducer system can be expressed by a set of homogeneous equations derived from planetary gear theory. For the specific case analyzed, with an input speed of 1815 rpm and an input torque of 167 N·m on the motor shaft, the angular velocity and torque on the cycloidal disk stage were calculated. The governing equations are:
$$ \begin{cases}
\omega_1 + k_1 \omega_2 + (-1 – k_1) \omega_6 = 0 \\
\omega_4 + k_2 \omega_5 + (-1 – k_2) \omega_3 = 0 \\
\omega_2 = \omega_3 \\
\omega_4 = \omega_6 \\
\omega_5 = 0 \\
\omega_1 = \omega_{1N}
\end{cases}
\quad \text{and} \quad
\begin{cases}
T_1 + k_1 T_2 + (-1 – k_1) T_6 = 0 \\
T_4 + k_2 T_5 + (-1 – k_2) T_3 = 0 \\
T_2 = T_3 \\
T_4 = T_6 \\
T_5 = 0 \\
T_1 = T_{1N}
\end{cases} $$
Here, \( \omega_i \) and \( T_i \) represent the angular velocity and torque of different components (1: motor shaft, 2: planetary gear, 3: crank shaft, 4: cycloidal disk, 5: pins, 6: output carrier). Solving these for the second stage yields an operating speed of 61.26 rpm and a resistive torque of -80.73 N·m on the cycloidal disk. In the simulation, the eccentric crank was assigned a rotational velocity of 61.26 rpm about its axis, and the cycloidal disk was subjected to the corresponding output torque. The contact between the cycloidal disk teeth and the pins was defined as frictional, with a coefficient of 0.13, using an asymmetric contact formulation with the Augmented Lagrange algorithm. The pins were bonded to the stationary pin gear shell.
The transient dynamic analysis revealed the stress distribution throughout the meshing cycle. The maximum equivalent (von Mises) stress was consistently found to be located at the concave flank of the cycloidal tooth engaged with a pin, with a peak value of approximately 415.6 MPa. The stress on the contacting pins was significantly lower, with a maximum of about 9.6 MPa. The results confirm the load-sharing characteristic of the cycloidal drive within the rotary vector reducer, as multiple teeth are in contact simultaneously, but the highest stress concentration occurs at a specific point on the engaging tooth’s concave surface. This stress value, while significant, is well below the yield strength of the 20CrMnMo material, which has an allowable stress exceeding 1200 MPa, indicating a high inherent reliability under the rated load for this specific rotary vector reducer configuration.
To generalize the reliability assessment and understand the influence of manufacturing tolerances, a probabilistic analysis was performed. Six key geometrical parameters of the cycloidal pin gear transmission were identified as primary sources of variability: pin diameter \( (d_p) \), pin length or effective thickness \( (t_p) \), pin distribution circle diameter \( (D_p) \), pin bore diameter in the shell \( (d_b) \), cycloidal disk thickness \( (t_c) \), and the crank bearing bore diameter in the cycloidal disk \( (d_{cb}) \). Their nominal values and assumed statistical distributions, based on typical manufacturing processes, are listed in the following table. All are modeled with normal distributions.
| Parameter | Symbol | Nominal Value (mm) | Distribution | Standard Deviation (mm) |
|---|---|---|---|---|
| Pin Diameter | \(d_p\) | 3.99 | N(μ, σ²) | 0.000067 |
| Pin Thickness | \(t_p\) | 8.769 | N(μ, σ²) | 0.012 |
| Distribution Circle Diameter | \(D_p\) | 104.00 | N(μ, σ²) | 0.012 |
| Pin Bore Diameter | \(d_b\) | 4.000 | N(μ, σ²) | 0.0032 |
| Cycloidal Disk Thickness | \(t_c\) | 8.750 | N(μ, σ²) | 0.0142 |
| Bearing Bore Diameter | \(d_{cb}\) | 26.465 | N(μ, σ²) | 0.012 |
A Design of Experiments (DoE) approach was employed to efficiently sample the design space defined by the tolerances of these six parameters. A Central Composite Design (CCD) was chosen, which required 45 design points (combinations of parameter values). For each design point, a corresponding 3D model was created, and a transient finite element analysis was performed to extract the maximum equivalent stress \( (\sigma_{max}) \) during meshing. A subset of the generated experimental data is presented in the table below to illustrate the variation.
| Run | \(d_p\) (mm) | \(t_p\) (mm) | \(D_p\) (mm) | \(d_b\) (mm) | \(t_c\) (mm) | \(d_{cb}\) (mm) | \(\sigma_{max}\) (MPa) |
|---|---|---|---|---|---|---|---|
| 1 | 3.98979 | 8.76900 | 104.00000 | 4.00000 | 8.75000 | 26.46500 | 408.2 |
| 2 | 3.98988 | 8.75114 | 103.98214 | 3.99464 | 8.72499 | 26.44714 | 432.7 |
| 3 | 3.98988 | 8.75114 | 103.98214 | 3.99464 | 8.77501 | 26.48286 | 425.1 |
| … | … | … | … | … | … | … | … |
| 45 | 3.99021 | 8.76900 | 104.00000 | 4.00000 | 8.75000 | 26.46500 | 401.8 |
Using Response Surface Methodology (RSM), a meta-model was constructed to approximate the implicit and computationally expensive relationship between the six input parameters \( (x_1, …, x_6) \) and the output maximum stress \( \sigma_{max} \). A second-order polynomial model was fitted to the 45 data points:
$$ \sigma_{max} = \beta_0 + \sum_{i=1}^{6} \beta_i x_i + \sum_{i=1}^{6} \beta_{ii} x_i^2 + \sum_{i < j} \beta_{ij} x_i x_j + \epsilon $$
where \( \beta_0, \beta_i, \beta_{ii}, \beta_{ij} \) are the regression coefficients, and \( \epsilon \) is the error term. The accuracy of the fitted response surface was validated using standard metrics like R-squared and adjusted R-squared, which showed excellent agreement with the finite element data. This surrogate model allows for rapid prediction of the maximum stress for any combination of parameters within the specified ranges, facilitating extensive probabilistic analysis.
With the established response surface model, a Monte Carlo Simulation (MCS) was conducted to assess the reliability and sensitivity. Latin Hypercube Sampling (LHS) was used to draw 100,000 statistically independent sample sets from the joint probability distribution of the six input parameters. For each sample, the maximum equivalent stress was calculated using the RSM meta-model. The resulting probability density function (PDF) and cumulative distribution function (CDF) of the maximum stress are plotted below conceptually. The analysis showed that the stress values are predominantly distributed between 200 MPa and 550 MPa, with the highest concentration around 300-350 MPa. Critically, in all 100,000 simulations, the maximum calculated stress never exceeded the material’s allowable stress limit. Therefore, the probability of failure \( P_f \), defined as the stress surpassing the allowable limit, is zero for the given operational conditions and tolerance ranges. This confirms a high reliability index for the cycloidal pin gear transmission in this rotary vector reducer design.
The massive dataset generated by the Monte Carlo simulation also enables a global sensitivity analysis. The sensitivity of the maximum equivalent stress to each input parameter was quantified using standardized regression coefficients or similar importance measures derived from the MCS output. The results are summarized in the following chart of relative sensitivity indices.
| Parameter | Symbol | Sensitivity Index | Direction of Influence |
|---|---|---|---|
| Pin Distribution Circle Diameter | \(D_p\) | -0.85 | Negative |
| Pin Thickness | \(t_p\) | -0.32 | Negative |
| Cycloidal Disk Thickness | \(t_c\) | -0.28 | Negative |
| Pin Diameter | \(d_p\) | -0.15 | Negative |
| Bearing Bore Diameter | \(d_{cb}\) | 0.08 | Positive (Low) |
| Pin Bore Diameter | \(d_b\) | 0.05 | Positive (Low) |
The analysis reveals that the diameter of the pin distribution circle \( (D_p) \) is by far the most influential parameter, with a high negative sensitivity. This implies that a decrease in \( D_p \) leads to a significant increase in the maximum contact stress. Physically, a smaller distribution circle diameter reduces the effective meshing clearance and alters the contact geometry, making the transmission more compact and increasing the contact pressure. Conversely, parameters like pin and disk thickness show a moderate negative sensitivity, as increasing them enlarges the contact area, thereby reducing stress. The bearing bore diameter and pin bore diameter exhibit very low sensitivity, indicating they are less critical for the contact stress under these specific conditions.
To further elucidate the dominant effect, we can isolate the relationship between the maximum equivalent stress and the pin distribution circle diameter \( D_p \) using the response surface model while holding other parameters at their nominal values. The resulting univariate response curve clearly demonstrates the strong negative correlation:
$$ \sigma_{max}(D_p) \approx \beta_0′ + \beta_1′ D_p + \beta_2′ D_p^2 $$
Over the tolerance range from approximately 103.96 mm to 104.04 mm, the predicted stress varies dramatically from around 550 MPa to 250 MPa. This steep gradient underscores why \( D_p \) is the most critical parameter for stress control in the design of a rotary vector reducer’s cycloidal stage. For optimal performance, the nominal value of \( D_p \) should be selected towards the upper end of the tolerance band to minimize stress, provided other functional constraints like backlash are satisfied.
In conclusion, this integrated study combines detailed finite element modeling with advanced probabilistic methods to thoroughly evaluate the reliability and parametric sensitivity of the cycloidal pin gear transmission system within a rotary vector reducer. The transient dynamic analysis precisely locates the maximum stress concentration at the concave tooth flank during operation. The constructed response surface model effectively captures the complex, nonlinear interactions between key geometrical parameters and the system’s mechanical response. The Monte Carlo-based reliability analysis confirms a high probability of survival under rated loads for the specified design and tolerance ranges. Most importantly, the global sensitivity analysis identifies the pin distribution circle diameter as the paramount parameter influencing the maximum contact stress, providing a clear directive for design optimization and tolerance allocation. These findings establish a robust theoretical foundation for enhancing the durability, performance, and manufacturability of rotary vector reducers, which are pivotal components in modern high-precision robotic systems. Future work may explore the interaction of these parameters with dynamic loading conditions, thermal effects, and different lubrication regimes to further strengthen the reliability framework for these essential mechanical drives.