
In the field of precision machinery, such as industrial robots and machine tools, the RV reducer plays a critical role due to its high torque capacity, compact size, and excellent positioning accuracy. As a key component, the RV reducer relies heavily on bearings to support and transmit forces and torques within its complex internal structure. However, the operational environment of an RV reducer subjects its bearings to intricate and dynamic loading conditions, often leading to premature failure and impacting the overall system reliability. From my perspective, understanding the forces acting on critical bearings, specifically the crank support bearings and turning arm bearings, is essential for optimizing RV reducer design and enhancing durability. This study aims to systematically investigate how various parameters influence the force states of these bearings, employing advanced simulation techniques to derive practical insights for engineering applications.
The RV reducer integrates a two-stage transmission mechanism: a planetary gear stage and a cycloidal pin-wheel stage. This configuration results in a high reduction ratio and robust performance, but it also introduces complex force distributions among internal components. Bearings within the RV reducer, including thin-walled angular contact ball bearings, tapered roller bearings, and needle roller bearings, are subjected to significant stresses. Notably, the turning arm bearings, often configured as needle roller bearing cages without inner rings, are identified as vulnerable points due to their lower load-carrying capacity and high operational loads. Prior research has focused on isolated aspects, such as individual bearing analysis or specific parameter effects, but a holistic approach considering the interconnected dynamics of the entire RV reducer system is lacking. In this work, I address this gap by developing a comprehensive simulation model that captures the interactions among all components, thereby providing a more accurate assessment of bearing forces.
To elucidate the fundamental mechanics, let’s consider the传动比 and force relationships in an RV reducer. The total transmission ratio, denoted as \(i\), is derived from the combination of the planetary and cycloidal stages. For the first-stage planetary gear, the ratio \(i_1\) is given by:
$$ i_1 = -\frac{Z_x}{Z_t} $$
where \(Z_x\) is the number of teeth on the planetary gear (crank shaft) and \(Z_t\) is the number of teeth on the sun gear (input shaft). For the second-stage cycloidal drive, the ratio \(i_2\) is:
$$ i_2 = \frac{Z_z}{Z_z – Z_b} $$
where \(Z_z\) is the number of pinwheel teeth (typically \(Z_z = Z_b + 1\)) and \(Z_b\) is the number of cycloid gear teeth. The overall transmission ratio of the RV reducer is then:
$$ i = 1 + \frac{Z_x \cdot Z_z}{Z_t (Z_z – Z_b)} $$
This ratio dictates the output speed \(n_c\) of the RV reducer relative to the input speed \(n_r\):
$$ n_c = \frac{n_r}{i} = \frac{n_r}{1 + \frac{Z_x \cdot Z_z}{Z_t (Z_z – Z_b)}} $$
The forces on bearings arise from the torque transmission through these stages. For instance, the output torque \(T_c\) at the output disk can be approximated from the input power \(P_r\), assuming negligible power losses:
$$ T_c = \frac{30 P_r}{\pi n_c} $$
This torque is resisted by the pinwheel, which is fixed to the housing, leading to meshing forces between the cycloid gear and pinwheel. Analyzing the force equilibrium on the cycloid gear, the resultant force on the turning arm bearing \(F_z\) can be derived. When considering \(N\) crank shafts, and assuming uniform force distribution, the maximum force on the turning arm bearing is:
$$ F_z = \frac{30 (d_1 + d_2) P_r}{\pi N D n_c d_2 \cos \alpha} $$
where \(d_1\) is the pitch circle diameter of the cycloid gear, \(d_2\) is the distribution circle diameter of the crank shafts, \(D\) is the pitch circle diameter of the pinwheel, and \(\alpha\) is the pressure angle of the cycloid gear. Similarly, the force on the crank support bearing \(F_q\) depends on the system stiffness and geometry:
$$ F_q = \frac{30 b_1 P_r}{\pi N D n_c b_2 \cos \alpha} $$
where \(b_1\) is the distance between two turning arm bearings and \(b_2\) is the distance between two crank support bearings. These formulas highlight the direct influence of input parameters like power and speed, as well as structural parameters like gear teeth counts and shaft arrangements, on bearing forces.
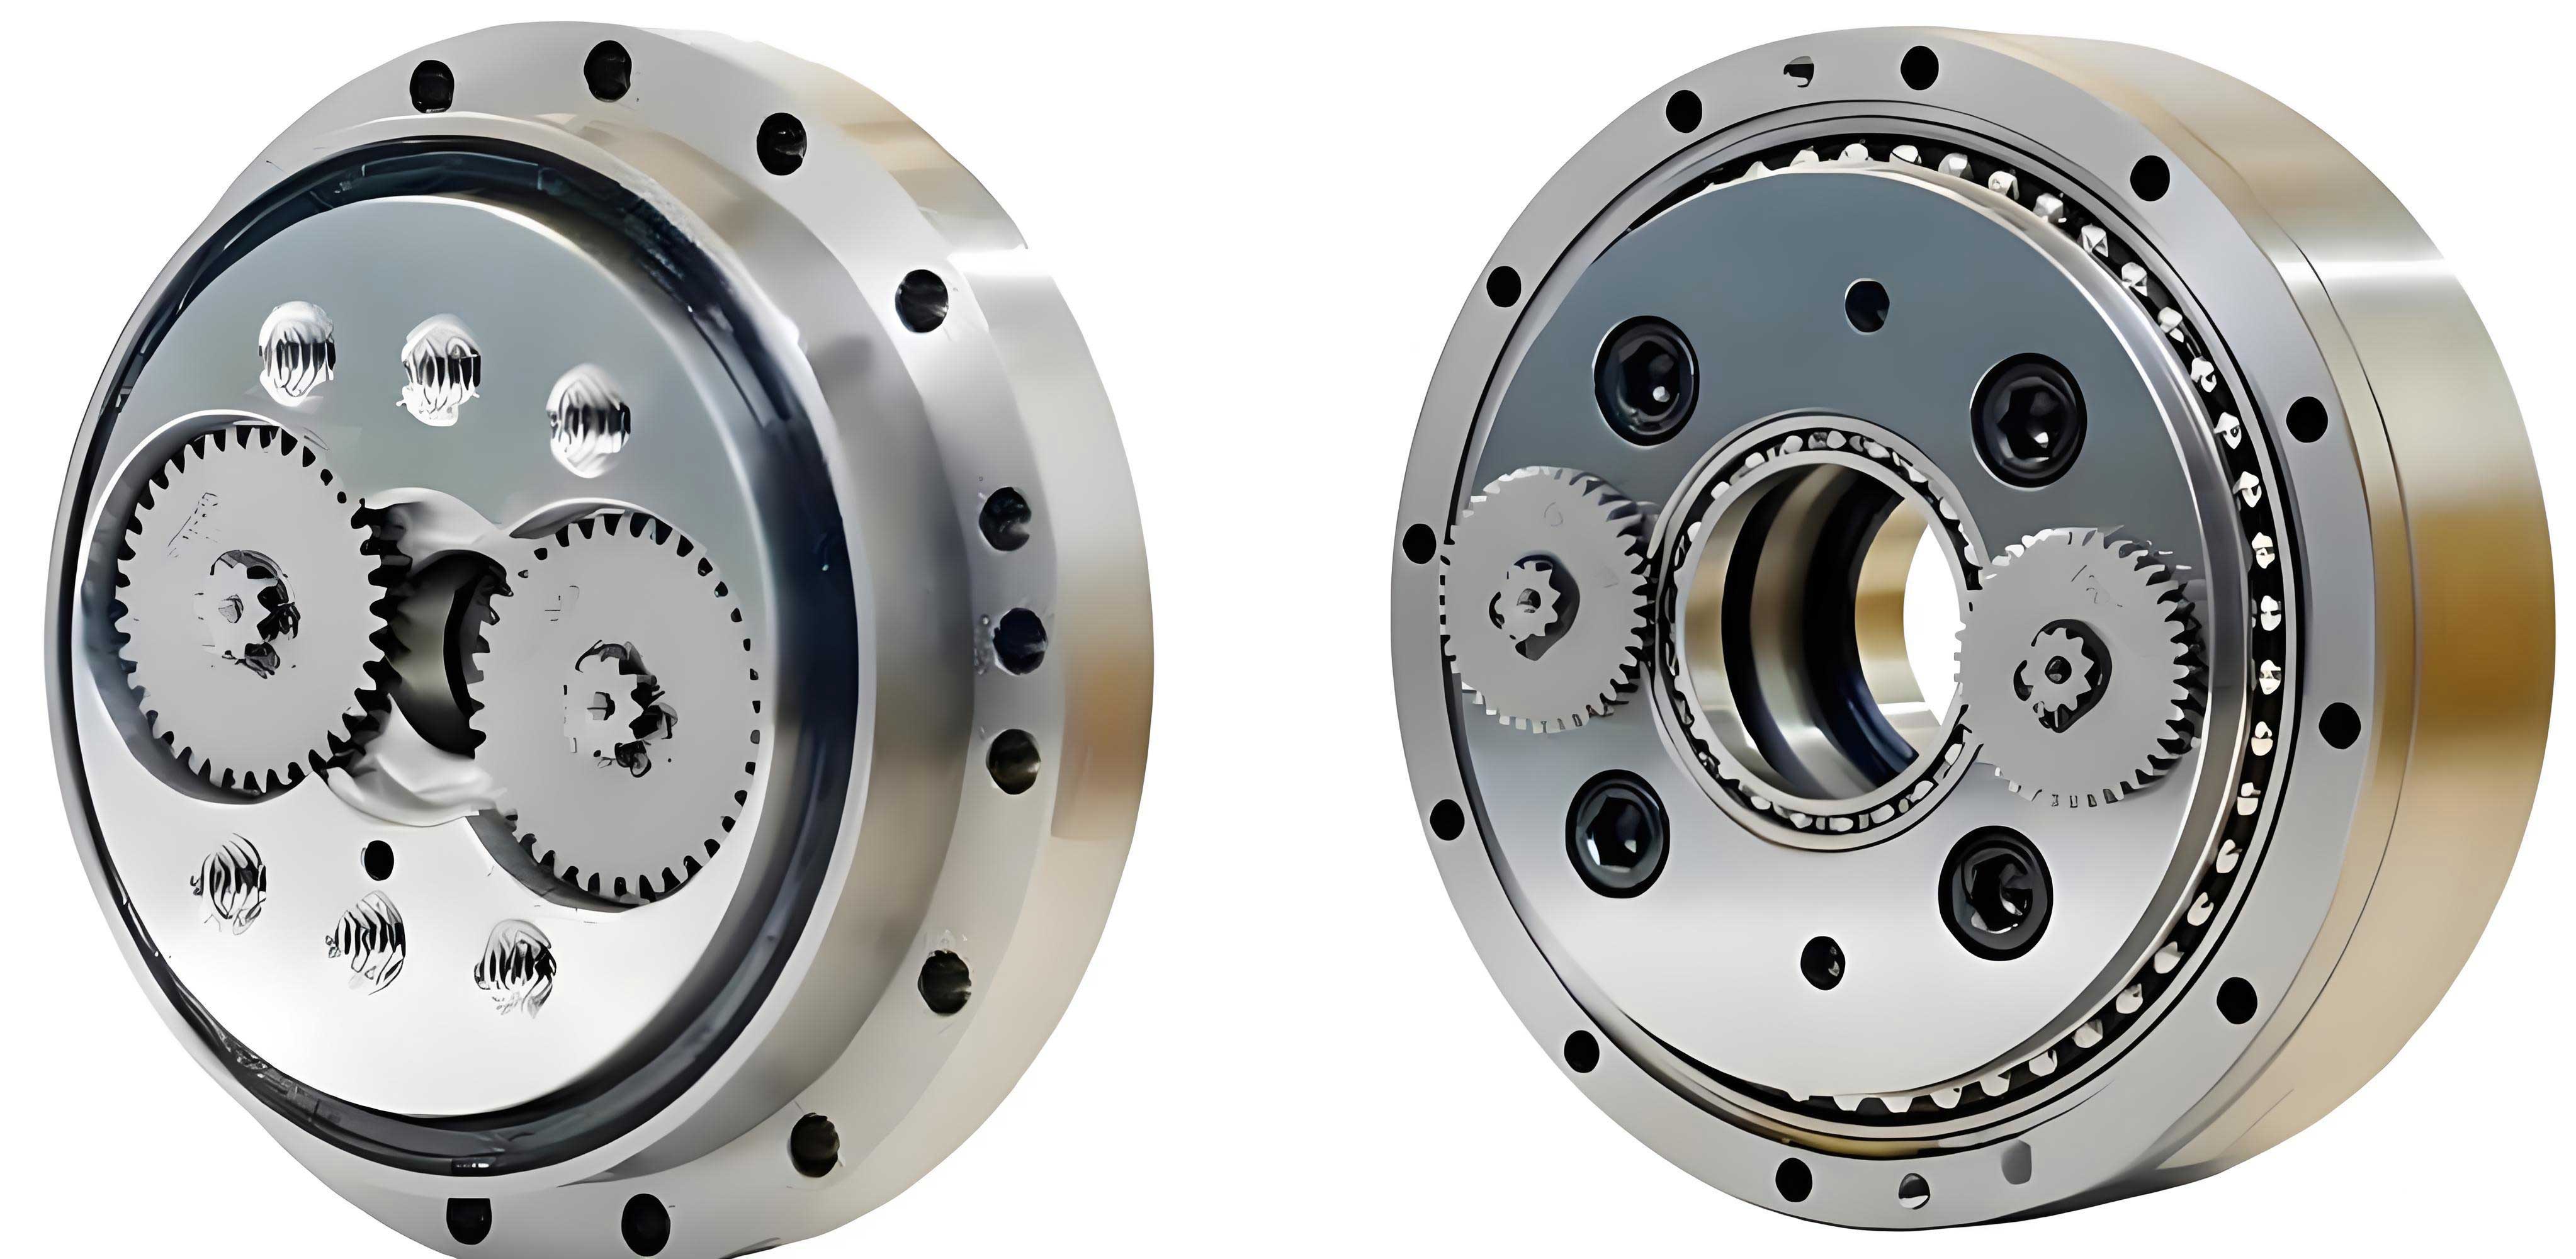
To explore these relationships in detail, I utilized Romax software to construct a full RV reducer simulation model. Romax is a powerful tool for analyzing gear and bearing systems, allowing for integrated modeling of shafts, gears, bearings, and housings with realistic boundary conditions. The model included key components: an input shaft, planetary gears, crank shafts with crank support bearings (tapered roller bearings, model 30206JR), turning arm bearings (needle roller bearings, model HK4516), cycloid gears, pinwheels, and an output disk. The housing was fixed to simulate actual mounting conditions. Input parameters such as speed and power were applied to the input shaft, while output constraints ensured force and torque balance. The model parameters, based on a typical RV reducer design, are summarized in Table 1.
| Parameter | Symbol | Baseline Value |
|---|---|---|
| Input Speed | \(n_r\) | 1000 rpm |
| Input Power | \(P_r\) | 3 kW |
| Number of Cycloid Gear Teeth | \(Z_b\) | 18 |
| Pitch Circle Diameter of Cycloid Gear | \(d_1\) | 322 mm |
| Pressure Angle | \(\alpha\) | 20° |
| Number of Crank Shafts | \(N\) | 3 |
| Distribution Circle Diameter of Crank Shafts | \(d_2\) | 182 mm |
| Pitch Circle Diameter of Pinwheel | \(D\) | 322 mm |
| Planetary Gear Transmission Ratio | \(i_1\) | 2.5 |
| Number of Rollers in Turning Arm Bearing | – | 30 |
| Length of Rollers in Turning Arm Bearing | – | 14 mm |
| Assembly Interference for Turning Arm Bearing | – | 80 μm |
| Installation Preload for Crank Support Bearing | – | 500 N |
Model validation was crucial to ensure accuracy. I compared simulation results with theoretical calculations for output speed and torque under varying input conditions. For example, at an input speed of 1000 rpm, the theoretical output speed from the transmission ratio formula was 20.6 rpm, while the simulation yielded 21.0 rpm, showing excellent agreement. Similarly, output torque values aligned closely, with deviations under 1% in most cases. However, for bearing forces, discrepancies of around 13% were observed, attributable to the simulation’s inclusion of interactive effects, preloads, and interferences that theoretical models often overlook. This validation confirmed the model’s reliability for analyzing bearing force variations in the RV reducer system.
The core of this study involves parametric analysis to uncover how different factors affect the forces on crank support bearings and turning arm bearings in the RV reducer. I categorized these factors into four groups: operational parameters, RV reducer structural parameters, bearing structural parameters, and bearing installation parameters. Each category was investigated systematically while keeping other parameters at baseline values.
Influence of Operational Parameters
Operational parameters, namely input power and input speed, directly dictate the energy input to the RV reducer. As shown in Table 2, varying input power from 1 kW to 5 kW at a constant input speed of 1000 rpm resulted in a linear increase in bearing forces. This linear relationship stems from the direct proportionality between power and torque, as expressed in the force formulas. For instance, the force on the turning arm bearing \(F_z\) scaled linearly with \(P_r\), consistent with the derivation. Conversely, when input speed was varied from 1000 rpm to 5000 rpm at a constant power of 3 kW, bearing forces decreased inversely. Higher speeds reduce output torque for a given power, thereby lowering meshing forces and subsequent bearing loads. This inverse trend is captured by the \(n_c\) term in the denominators of the force equations. These findings emphasize that in practical applications of RV reducers, operating at higher speeds and lower power within design limits can mitigate bearing stresses and enhance longevity.
| Input Power \(P_r\) (kW) | Crank Support Bearing Force \(F_q\) (N) | Turning Arm Bearing Force \(F_z\) (N) |
|---|---|---|
| 1 | 1,984.0 | 1,200.1 |
| 2 | 3,968.0 | 2,400.2 |
| 3 | 5,952.0 | 3,618.9 |
| 4 | 7,936.0 | 4,837.6 |
| 5 | 9,920.0 | 6,012.4 |
The relationship can be summarized mathematically. For a fixed speed, bearing force \(F\) is proportional to input power:
$$ F \propto P_r $$
For fixed power, bearing force is inversely proportional to input speed:
$$ F \propto \frac{1}{n_r} $$
Combining these, the general form for bearing forces in an RV reducer under steady-state conditions is:
$$ F = k \cdot \frac{P_r}{n_r} $$
where \(k\) is a constant dependent on RV reducer geometry and bearing arrangement.
Influence of RV Reducer Structural Parameters
Structural parameters of the RV reducer, such as planetary gear transmission ratio, cycloid gear tooth count, and number of crank shafts, inherently affect force distribution. I altered these parameters within practical ranges and observed their impact on bearing forces, as compiled in Table 3. Increasing the planetary gear transmission ratio \(i_1\) (by raising planetary gear teeth or reducing sun gear teeth) led to higher bearing forces. This occurs because a higher \(i_1\) increases the torque amplification in the first stage, elevating loads transferred to the cycloidal stage. Similarly, a greater number of cycloid gear teeth \(Z_b\) increased forces; from the transmission ratio formula, a larger \(Z_b\) reduces the overall ratio \(i\), which decreases output speed \(n_c\) and thus raises forces for constant input power, as evident from the inverse relationship with \(n_c\) in force equations. On the other hand, increasing the number of crank shafts \(N\) from 2 to 4 significantly reduced forces on both bearing types. More crank shafts distribute the meshing forces over a larger number of bearing sets, decreasing the load per bearing. This aligns with the inverse proportionality to \(N\) in the force formulas. Therefore, in RV reducer design, minimizing planetary ratio and cycloid tooth count while maximizing crank shaft count (within spatial and cost constraints) can optimize bearing load conditions.
| Parameter Variation | Crank Support Bearing Force \(F_q\) (N) | Turning Arm Bearing Force \(F_z\) (N) |
|---|---|---|
| Planetary Ratio \(i_1 = 2.0\) | 5,123.4 | 3,112.5 |
| Planetary Ratio \(i_1 = 2.5\) (Baseline) | 5,952.0 | 3,618.9 |
| Planetary Ratio \(i_1 = 3.0\) | 6,780.6 | 4,125.3 |
| Cycloid Teeth \(Z_b = 17\) | 5,567.8 | 3,387.2 |
| Cycloid Teeth \(Z_b = 18\) (Baseline) | 5,952.0 | 3,618.9 |
| Cycloid Teeth \(Z_b = 19\) | 6,336.2 | 3,850.6 |
| Crank Shafts \(N = 2\) | 8,928.0 | 5,428.4 |
| Crank Shafts \(N = 3\) (Baseline) | 5,952.0 | 3,618.9 |
| Crank Shafts \(N = 4\) | 4,464.0 | 2,714.2 |
Mathematically, the sensitivity of bearing forces to these parameters can be expressed through partial derivatives. For example, from the force equation for \(F_z\):
$$ \frac{\partial F_z}{\partial N} = -\frac{30 (d_1 + d_2) P_r}{\pi N^2 D n_c d_2 \cos \alpha} < 0 $$
indicating that force decreases with increasing \(N\). Similarly, analyzing the effect of \(Z_b\) involves the output speed dependency:
$$ n_c \propto \frac{1}{1 + \frac{Z_x Z_z}{Z_t (Z_z – Z_b)}} $$
so an increase in \(Z_b\) reduces \(n_c\), thereby increasing \(F_z\).
Influence of Bearing Structural Parameters
Bearing structural parameters, specifically the number and length of rollers in the turning arm bearing, were examined for their impact on forces and contact stresses. Interestingly, as shown in Table 4, variations in roller count (from 20 to 40) and roller length (from 12 mm to 16 mm) had minimal effect on the magnitude of bearing forces, with changes less than 5%. This insensitivity arises because these parameters primarily alter bearing stiffness and internal load distribution rather than the external forces dictated by the RV reducer’s global equilibrium. However, they significantly influenced the maximum contact stress on the raceways. Increasing roller count or length reduces the contact pressure per roller due to better load sharing, thereby lowering peak stresses. For instance, the maximum contact stress on the turning arm bearing dropped by approximately 30% when roller count was increased from 20 to 40. Notably, while the crank support bearing generally experienced higher forces, the turning arm bearing exhibited much higher contact stresses—up to 1.4 times greater—due to its smaller roller dimensions and inferior load capacity. This underscores why turning arm bearings are often the weak link in RV reducers and highlights the importance of optimizing roller geometry to mitigate contact fatigue.
| Parameter Variation | Crank Support Bearing Force \(F_q\) (N) | Turning Arm Bearing Force \(F_z\) (N) | Max Contact Stress on Turning Arm Bearing (MPa) |
|---|---|---|---|
| Roller Count = 20 | 5,976.2 | 3,635.1 | 1,850 |
| Roller Count = 30 (Baseline) | 5,952.0 | 3,618.9 | 1,550 |
| Roller Count = 40 | 5,927.8 | 3,602.7 | 1,300 |
| Roller Length = 12 mm | 5,960.5 | 3,625.3 | 1,700 |
| Roller Length = 14 mm (Baseline) | 5,952.0 | 3,618.9 | 1,550 |
| Roller Length = 16 mm | 5,943.5 | 3,612.5 | 1,420 |
The contact stress \(\sigma\) in a roller bearing can be estimated using Hertzian theory. For a line contact, the maximum contact pressure \(p_0\) is:
$$ p_0 = \sqrt{\frac{F E^*}{\pi R L}} $$
where \(F\) is the load per roller, \(E^*\) is the equivalent elastic modulus, \(R\) is the effective radius, and \(L\) is the roller length. Increasing roller count reduces \(F\) (load sharing), while increasing \(L\) directly reduces \(p_0\), explaining the observed stress reductions. In the context of RV reducers, this means that bearing design should focus on contact stress management through roller optimization, even if force levels remain unchanged.
Influence of Bearing Installation Parameters
Installation parameters, including preload on crank support bearings and interference fit for turning arm bearings, are critical for ensuring proper bearing operation and longevity. For crank support bearings (tapered roller bearings), preload eliminates internal clearance and prevents skidding under load. I varied preload from 0 N to 2000 N and found a nonlinear effect on bearing forces, as depicted in Table 5. Forces initially decreased with increasing preload, reaching a minimum at around 1500 N, beyond which they increased. At 1500 N preload, the crank support bearing force was 5,952.0 N and the turning arm bearing force was 5,313.3 N, both minimized. This optimal preload aligns with SKF calculation methods and balances stiffness without inducing excessive internal stresses. For turning arm bearings, which are often press-fitted into the cycloid gear, interference fit affects radial clearance and thus bearing performance. Varying interference from 80 μm to 110 μm caused a slight decrease in bearing forces (about 290 N reduction), as shown in Table 6. This reduction is attributed to changes in system stiffness and vibration characteristics due to altered clearance. More importantly, interference fit significantly influenced bearing life. As interference increased, working clearance decreased from positive to negative values, and bearing life exhibited a peak at 95 μm interference, corresponding to a slight negative clearance of -4.87 μm. This optimal interference maximizes life by optimizing load distribution and minimizing wear.
| Preload (N) | Crank Support Bearing Force \(F_q\) (N) | Turning Arm Bearing Force \(F_z\) (N) |
|---|---|---|
| 0 | 6,250.0 | 5,600.0 |
| 500 | 6,100.0 | 5,450.0 |
| 1000 | 5,980.0 | 5,380.0 |
| 1500 | 5,952.0 | 5,313.3 |
| 2000 | 6,050.0 | 5,400.0 |
| Interference (μm) | Crank Support Bearing Force \(F_q\) (N) | Turning Arm Bearing Force \(F_z\) (N) | Turning Arm Bearing Working Clearance (μm) | Turning Arm Bearing Life (hours) |
|---|---|---|---|---|
| 80 | 5,952.0 | 3,618.9 | 3.01 | 850.5 |
| 90 | 5,930.0 | 3,600.0 | -1.43 | 920.8 |
| 95 | 5,920.0 | 3,590.0 | -4.87 | 950.2 |
| 100 | 5,910.0 | 3,580.0 | -8.30 | 930.1 |
| 110 | 5,890.0 | 3,560.0 | -12.74 | 880.3 |
The preload effect can be modeled considering bearing stiffness. For a tapered roller bearing, the axial stiffness \(K_a\) relates preload \(P_a\) to deflection \(\delta_a\):
$$ P_a = K_a \delta_a $$
Under external load \(F_{ext}\), the total force on the bearing becomes:
$$ F = P_a + C F_{ext} $$
where \(C\) is a load distribution factor. The optimal preload minimizes \(F\) by balancing \(P_a\) and \(C F_{ext}\). For interference fit, the change in radial clearance \(\Delta r\) affects bearing life \(L\) via the ISO life formula:
$$ L = \left( \frac{C}{P} \right)^p $$
where \(C\) is the dynamic load rating, \(P\) is the equivalent dynamic load, and \(p\) is an exponent (e.g., 10/3 for roller bearings). Interference alters \(P\) by modifying internal clearance, leading to the observed life peak.
Throughout this analysis, the integration of simulation via Romax has proven invaluable for capturing the interconnected dynamics of the RV reducer system. Unlike isolated studies, this approach accounts for mutual influences among gears, shafts, and bearings, providing a realistic force assessment. The RV reducer’s performance is highly sensitive to parametric choices, and this work delineates clear trends for designers. For instance, in RV reducer applications, prioritizing high-speed, low-power operation can reduce bearing loads. Structural tweaks like using fewer cycloid teeth or more crank shafts offer force reductions, while bearing internal design should focus on roller count and length to curb contact stresses. Installation practices, particularly preload and interference, require careful calibration to hit force and life optima.
In conclusion, this comprehensive study elucidates the variation laws of forces on crank support bearings and turning arm bearings in RV reducers. Key findings include: bearing forces scale linearly with input power and inversely with input speed; reducing planetary transmission ratio and cycloid tooth count or increasing crank shaft count lowers forces; roller parameters have minimal force impact but significantly affect contact stresses, with turning arm bearings being critical due to higher stress concentrations; and optimal preload (1500 N) and interference (95 μm) exist to minimize forces and maximize life. These insights provide a foundation for optimizing RV reducer designs, ultimately enhancing reliability and efficiency in industrial applications. Future work could explore dynamic loading conditions, thermal effects, and material advancements to further push the boundaries of RV reducer performance.