
In the field of precision agricultural machinery, the RV reducer plays a critical role in ensuring efficient and accurate motion control, particularly in equipment such as slot tipping machines used for organic waste composting. As a researcher focused on mechanical transmission systems, I have extensively studied the deviation mechanisms affecting the RV reducer’s performance. This article delves into the theoretical analysis of transmission deviations in RV reducers, emphasizing the impact of assembly processes on overall accuracy. The RV reducer, a two-stage gear system combining planetary gears and cycloidal pin wheels, is widely adopted in agricultural applications due to its high torque capacity and compact design. However, deviations arising from part manufacturing and assembly can significantly degrade transmission precision, leading to reduced efficiency in machines like compost turners. Here, I present a comprehensive analysis using directed deviation graphs and Monte Carlo simulations to quantify these effects, with a focus on the RV-40E model. The goal is to provide insights that can guide the design and production of more reliable RV reducers, thereby enhancing the performance of agricultural systems.
The RV reducer is a sophisticated transmission device that integrates a primary planetary gear stage and a secondary cycloidal pin wheel stage. This dual-stage configuration allows for high reduction ratios and robust load-bearing capabilities, making it ideal for heavy-duty applications. In slot tipping machines, the RV reducer drives the turning mechanism that aerates and moves organic waste during composting, a process essential for efficient fertilizer production. Understanding the internal construction of the RV reducer is fundamental to analyzing its deviation sources. The RV-40E reducer, for instance, consists of key components such as input shafts, sun gears, planetary gears, crank shafts, cycloidal gears, pin gears, and output plates. Each component contributes to the overall transmission chain, and any deviations in their geometry or assembly can propagate through the system, affecting the final output accuracy. The transmission principle involves the sun gear driving multiple planetary gears, which in turn rotate crank shafts connected to cycloidal gears. These cycloidal gears mesh with fixed pin gears, resulting in a combined motion that reduces speed and increases torque. This complex interaction highlights the need for precise control over part tolerances and assembly alignment to minimize transmission errors.
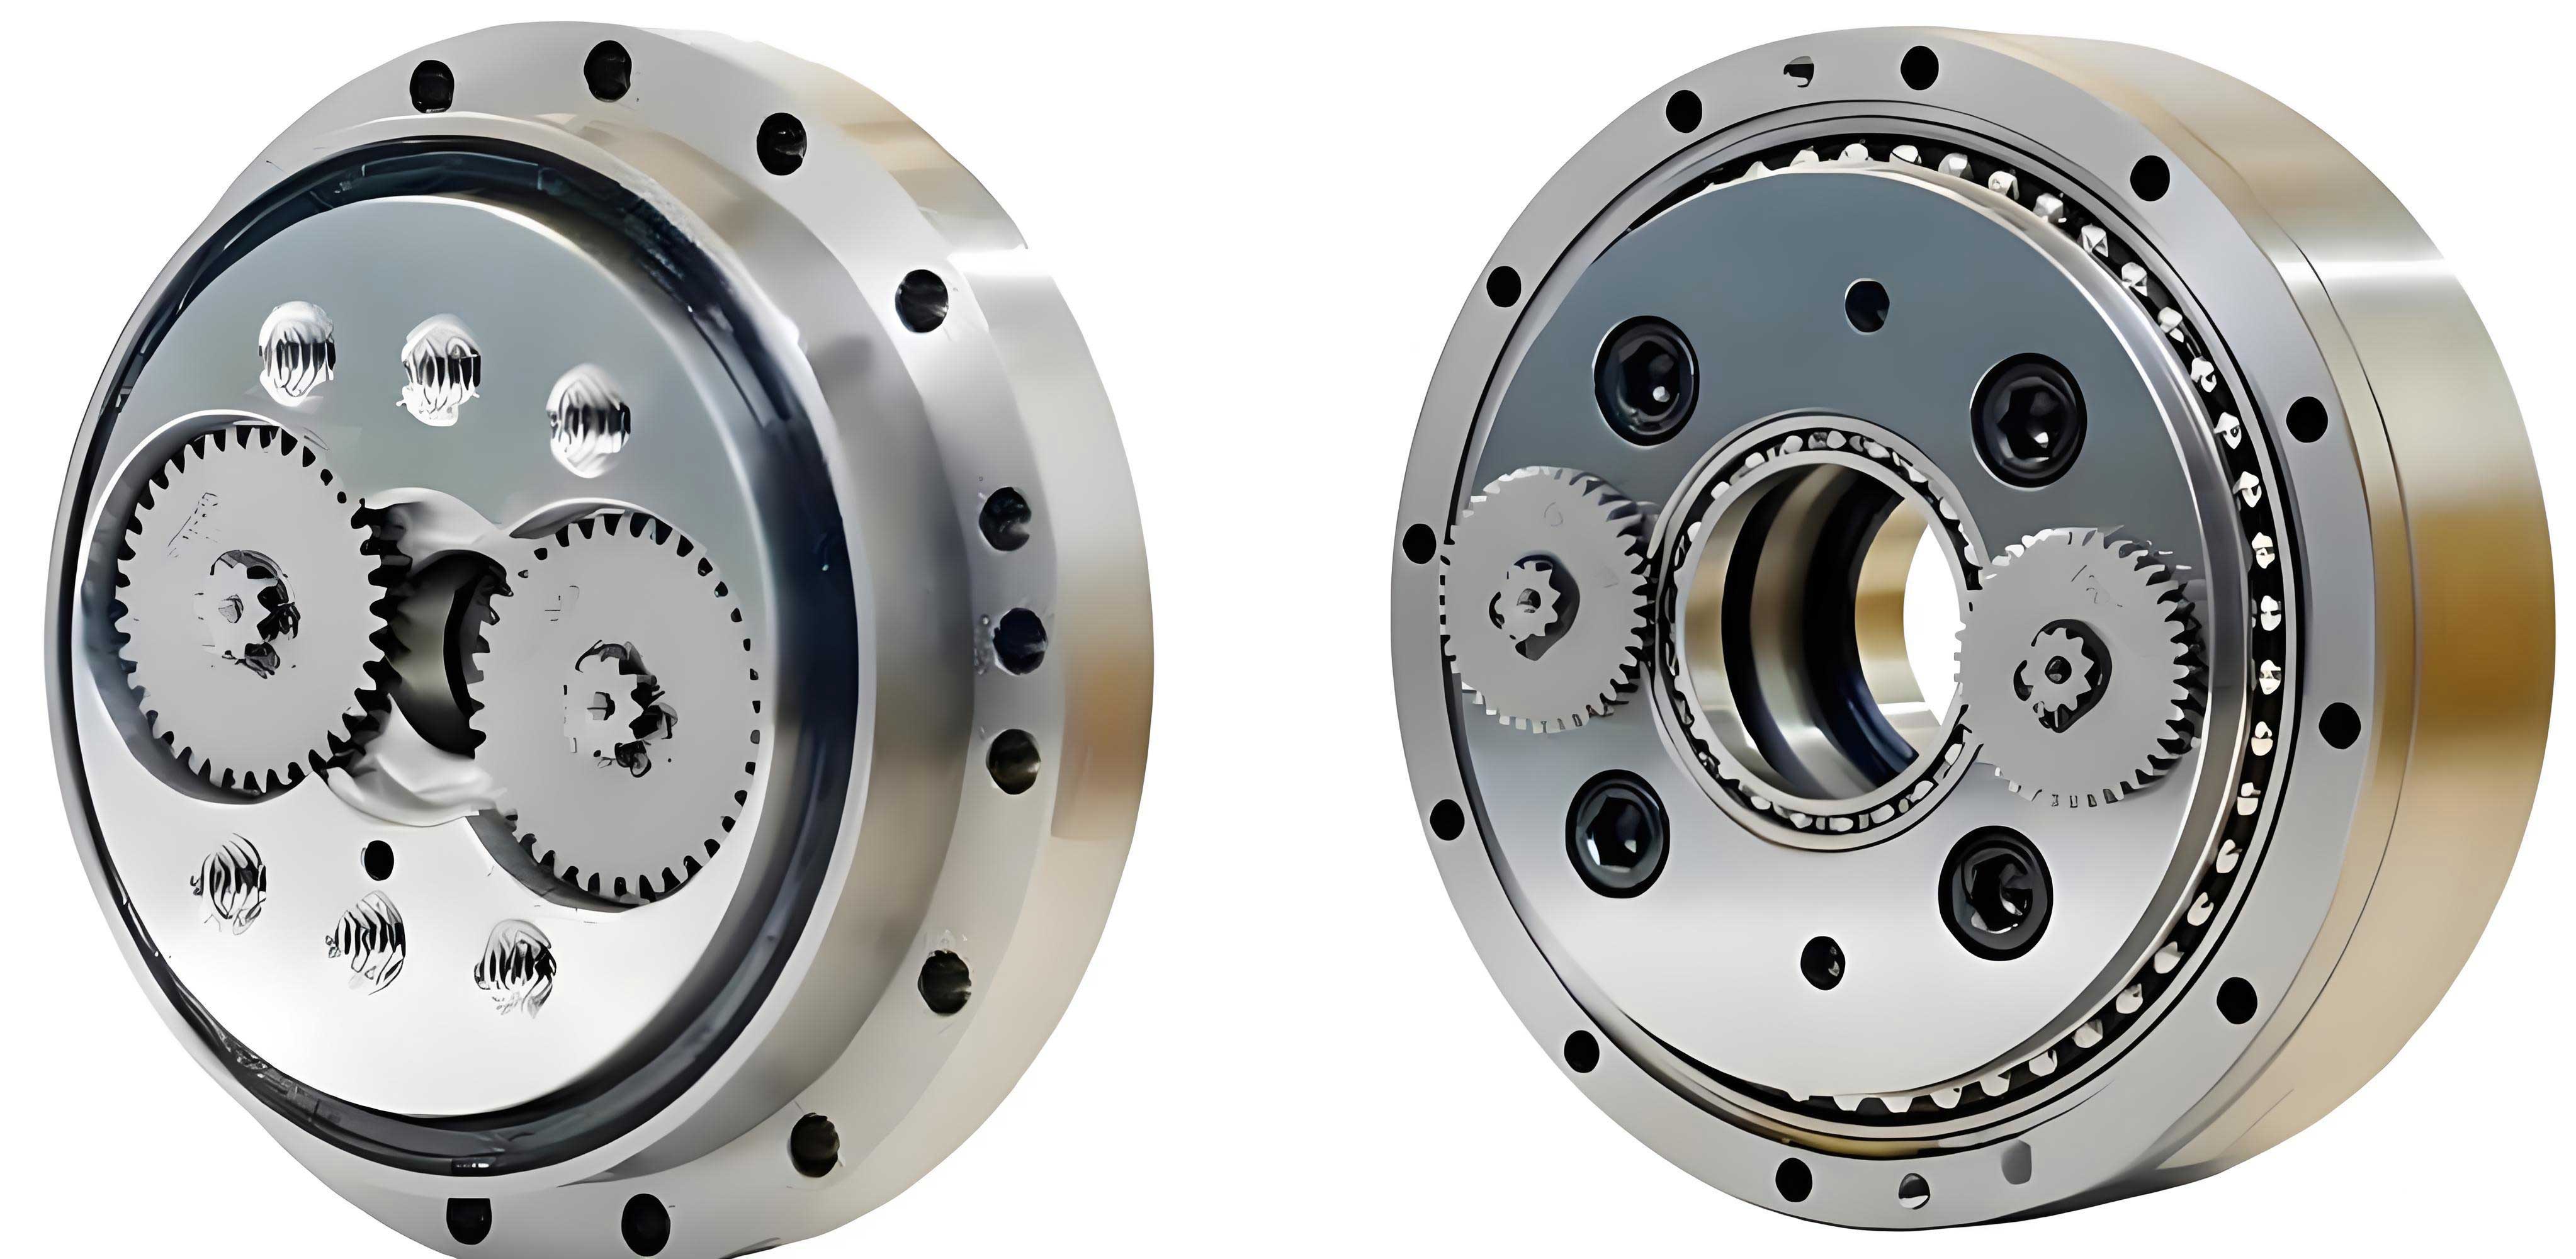
Deviation sources in the RV reducer can be categorized into three main types, which I refer to as E1, E2, and E3. The first type, E1, pertains to geometric position deviations, such as parallelism errors between the input shaft axis and crank shaft axes. The second type, E2, involves geometric shape deviations, like profile errors in cycloidal gear teeth. The third type, E3, relates to assembly position deviations, such as misalignment during the mating of crank shafts and planetary gears. These deviation sources couple during the assembly process, leading to cumulative effects that degrade the transmission accuracy of the RV reducer. To model this, I employ a directed graph approach, where each component’s functional geometry is represented as nodes, and deviations are depicted as flows between them. This method allows for a systematic analysis of how deviations propagate through the RV reducer’s assembly chain. For example, in a non-clearance fit, deviations from one part directly influence the position of the next, causing coupling and accumulation. In contrast, clearance fits can interrupt deviation propagation due to gaps, but reintroduce errors through assembly positioning. The interaction between these fits and deviation types is crucial for predicting overall system performance.
The transmission deviation mechanism in the RV reducer is further analyzed through mating relationships, which I classify into Mgg, MgD, and MDD types. Mgg mating involves both geometries being deviation geometries, affected by all three deviation sources. MgD mating has one deviation geometry and one datum geometry, influenced primarily by the deviation geometry’s sources. MDD mating involves datum geometries, where only assembly position deviations play a role. The state of mating—whether non-clearance (Mf) or clearance (Mj)—also impacts deviation propagation. For instance, in Mgg mating under non-clearance conditions, the deviation statistic is the sum of individual part deviations, whereas in clearance conditions, it depends on the assembly position deviation of the second part. To quantify these effects, I derive deviation statistics using a multivariate model. Assuming deviation vector components follow normal distributions, the linear and rotational deviations can be expressed as:
$$ \Delta u \sim (\mu_1, S_1), \quad \Delta v \sim (\mu_2, S_2), \quad \Delta w \sim (\mu_3, S_3) $$
$$ \Delta \alpha \sim (\mu_4, S_4), \quad \Delta \beta \sim (\mu_5, S_5), \quad \Delta \gamma \sim (\mu_6, S_6) $$
Here, $\mu_i$ represents the mean, and $S_i$ the variance for each direction. The overall deviation statistic model is given by:
$$ F(E_i) = 2\pi^{-3}(\det P)^{-1/2} e^{-\frac{1}{2}(E_i – \mu)^T P^{-1}(E_i – \mu)} $$
where the mean vector $\mu$ and covariance matrix $P$ are defined as:
$$ \mu = (\mu_1, \mu_2, \mu_3, \mu_4, \mu_5, \mu_6) $$
$$ P = \begin{bmatrix} S_{11} & S_{12} & \ldots & S_{16} \\ S_{21} & S_{22} & \ldots & S_{26} \\ \vdots & \vdots & \ddots & \vdots \\ S_{61} & S_{62} & \ldots & S_{66} \end{bmatrix} $$
For practical evaluation, constraints such as maximum deviation limits are applied. For example, in a parallel plane deviation domain, the maximum values are:
$$ \max \Delta w = t_2 – t_1 = \Delta t, \quad \max \Delta \alpha = \frac{2\Delta t}{L_1}, \quad \max \Delta \beta = \frac{2\Delta t}{W_1} $$
with $\Delta u = 0$, $\Delta v = 0$, and $\Delta \gamma = 0$. The mean vector is then:
$$ \mu = \left(0, 0, \frac{\max \Delta w}{2}, \frac{\max \Delta \alpha}{2}, \frac{\max \Delta \beta}{2}, 0\right) $$
These models form the basis for computing deviation statistics in the RV reducer assembly.
To apply this theory, I focus on the RV-40E reducer, a common model used in agricultural machinery. The mating relationships among core components are summarized in the table below, which details the mating types, states, and associated deviation sources. This table is essential for constructing the directed deviation graph and calculating cumulative effects.
| Core Component | Number of Mating Surfaces | Mating Type | Mating State | Deviation Sources Involved |
|---|---|---|---|---|
| Input Shaft | 2 | Mgg | Non-clearance | Gear surface deviations |
| Planetary Gear | 4 | MgD | Non-clearance | Face and axis deviations |
| Crank Shaft | 6 | MgD | Clearance | Axis and surface deviations |
| Needle Bearing | 4 | MgD | Clearance | Axis and face deviations |
| Cycloidal Gear | 6 | Mgg | Non-clearance | Gear profile deviations |
| Pin Gear | 2 | MgD | Clearance | Axis deviations |
| Output Plate | 1 | MgD | Clearance | Face deviations |
Based on these mating relationships, I construct a directed deviation graph for the entire RV-40E reducer. This graph models how deviations flow from one component to another, considering both primary and secondary transmission stages. The graph includes nodes for each functional geometry and edges representing deviation interactions. For instance, deviations from the input shaft propagate to planetary gears, then to crank shafts, and finally to cycloidal gears and the output. The secondary stage, involving cycloidal and pin gears, is particularly sensitive due to its high reduction ratio. The directed graph helps visualize the cumulative path, which is crucial for identifying critical deviation sources in the RV reducer.
Using the directed graph, I derive the overall deviation statistic for the RV-40E reducer. The total deviation $\Delta E$ is a combination of first-stage and second-stage deviations, weighted by gear ratios. Mathematically, it can be expressed as:
$$ \Delta E = \Delta E_1 + \Delta E_2 = \left( \sum \text{first-stage deviations} \right) \cdot \frac{Z_2}{Z_1} \cdot \frac{Z_5}{Z_4} + \left( \sum \text{second-stage deviations} \right) \cdot \frac{Z_5}{Z_4} $$
where $Z_1$, $Z_2$, $Z_4$, and $Z_5$ are tooth numbers of planetary, sun, pin, and cycloidal gears, respectively. The deviation components in the coordinate system are evaluated as linear and angular measures. For example, the distance deviation $E_1$ and angle deviation $e_1$ are computed as:
$$ E_1 = \sqrt{U_0^2 + V_0^2 + W_0^2 + A_0^2 + B_0^2} $$
$$ e_1 = \sqrt{u_0^2 + v_0^2 + w_0^2 + a_0^2 + b_0^2} $$
Here, $U_0$, $V_0$, $W_0$, $A_0$, and $B_0$ are linear and angular deviation sums from all components, derived from the directed graph model. The final deviation statistic $\delta_E$ is given by:
$$ \delta_E = \frac{e_1 / E_1}{40} $$
To solve these equations, I employ the Monte Carlo method, implemented in MATLAB, which allows for statistical sampling of deviation ranges. The input deviation ranges for core components, as derived from manufacturing tolerances, are listed in the following table. These values are used as inputs for the simulation to compute the overall assembly deviation.
| Component | Deviation Source | Deviation Range (mm or rad) |
|---|---|---|
| Input Shaft | Face deviations | (-0.1, 0.1) |
| Planetary Gear | Axis and face deviations | (-0.15, 0.15) |
| Crank Shaft | Axis deviations | (-0.2, 0.2) |
| Cycloidal Gear | Profile deviations | (-0.2, 0.2) |
| Pin Gear | Axis deviations | (-0.1, 0.1) |
| Output Plate | Face deviations | (-0.25, 0.25) |
The Monte Carlo simulation involves generating random samples within these ranges and calculating the resulting deviation statistic $\delta_E$ for the entire RV reducer. After multiple runs, the results indicate that the absolute deviation values for the RV-40E reducer vary between 0.017 arc-minutes and 0.957 arc-minutes, which falls within the allowable transmission error limit of 1 arc-minute for most agricultural applications. This demonstrates that the RV reducer can maintain precision under typical manufacturing tolerances. However, the contribution of each transmission stage to the overall deviation is not uniform. The table below summarizes the contribution percentages from the first-stage (planetary) and second-stage (cycloidal) systems, based on five simulation samples.
| Sample Number | First-Stage Contribution (%) | Second-Stage Contribution (%) |
|---|---|---|
| 1 | 21.56 | 78.44 |
| 2 | 2.15 | 97.85 |
| 3 | 2.77 | 97.23 |
| 4 | 15.75 | 84.25 |
| 5 | 12.32 | 87.68 |
| Mean | 16.94 | 83.06 |
The data clearly shows that the second-stage transmission, primarily involving the cycloidal pin wheel system, contributes over 80% on average to the overall deviation in the RV reducer. This highlights the critical importance of controlling deviations in the cycloidal gear components during design and assembly. Factors such as tooth profile accuracy, pin gear alignment, and bearing clearances in the second stage have a disproportionate impact on the RV reducer’s transmission precision. In agricultural machinery like slot tipping machines, where consistent torque output is essential for effective compost turning, minimizing these deviations can lead to significant improvements in operational reliability and lifespan.
Further analysis of the deviation propagation mechanism reveals that the mating type and state play pivotal roles. For example, in the RV reducer, non-clearance mates in the cycloidal stage cause deviation coupling, whereas clearance mates in the crank shaft assemblies can introduce additional positioning errors. The directed graph model helps identify these critical paths, enabling targeted tolerance adjustments. I also explore the effect of different probability distributions for deviation sources. While normal distributions are commonly assumed, real-world manufacturing processes might exhibit skewness or kurtosis, which could affect the Monte Carlo results. Future studies could incorporate more complex distributions to enhance the model’s accuracy for the RV reducer.
In addition to theoretical modeling, practical implications for RV reducer design are considered. For instance, optimizing the gear tooth profiles in the cycloidal stage can reduce E2-type deviations, while improving assembly fixtures can mitigate E3-type deviations. The use of advanced materials and surface treatments can also enhance the wear resistance of the RV reducer, indirectly reducing deviation growth over time. In agricultural settings, where environmental factors like dust and moisture are prevalent, sealing and lubrication of the RV reducer become crucial to maintain deviation levels within acceptable limits. These design considerations underscore the interdisciplinary nature of developing robust RV reducers for machinery.
The application of this deviation analysis extends beyond slot tipping machines to other agricultural equipment, such as harvesters and irrigators, where RV reducers are employed for precise motion control. By understanding the deviation sources and propagation, manufacturers can implement stricter quality control measures during RV reducer production. For example, statistical process control (SPC) can be applied to monitor critical dimensions, and automated assembly systems can reduce human error. Furthermore, digital twins of the RV reducer could be created using the deviation models, allowing for virtual testing and optimization before physical prototyping. This approach aligns with Industry 4.0 trends, promoting smarter manufacturing of agricultural components.
To conclude, my analysis demonstrates that transmission deviations in the RV reducer are primarily influenced by the second-stage cycloidal system, with contributions exceeding 80% in the RV-40E model. The directed graph and Monte Carlo methods provide effective tools for quantifying these effects, offering valuable insights for design and assembly improvements. For agricultural machinery, enhancing the precision of the RV reducer can lead to better performance and longevity, ultimately supporting sustainable farming practices. Future work should focus on real-world validation of these models and exploring adaptive control strategies to compensate for deviations in operational RV reducers. This research underscores the importance of precision engineering in advancing agricultural technology, with the RV reducer serving as a key component in modern mechanized systems.