
The pursuit of precision and reliability in industrial automation has positioned the RV (Rotary Vector) reducer as a critical component within robotic joints. Its compact design, high reduction ratio, and excellent positional accuracy are paramount. However, these performance benchmarks are directly threatened by minute imperfections arising from its complex manufacturing and precise assembly processes. Vibration signature serves as a potent, non-invasive indicator of such internal health. My research focuses on developing and implementing a robust online vibration detection methodology for RV reducers under simulated operational loads. This technology aims to bridge the gap between theoretical dynamic analysis and practical, production-floor quality assurance, ultimately enhancing product yield, robotic motion accuracy, and system longevity.
The core challenge lies in the RV reducer’s sophisticated two-stage transmission architecture. Comprehending its vibration characteristics necessitates a thorough examination of its kinematic and dynamic principles.
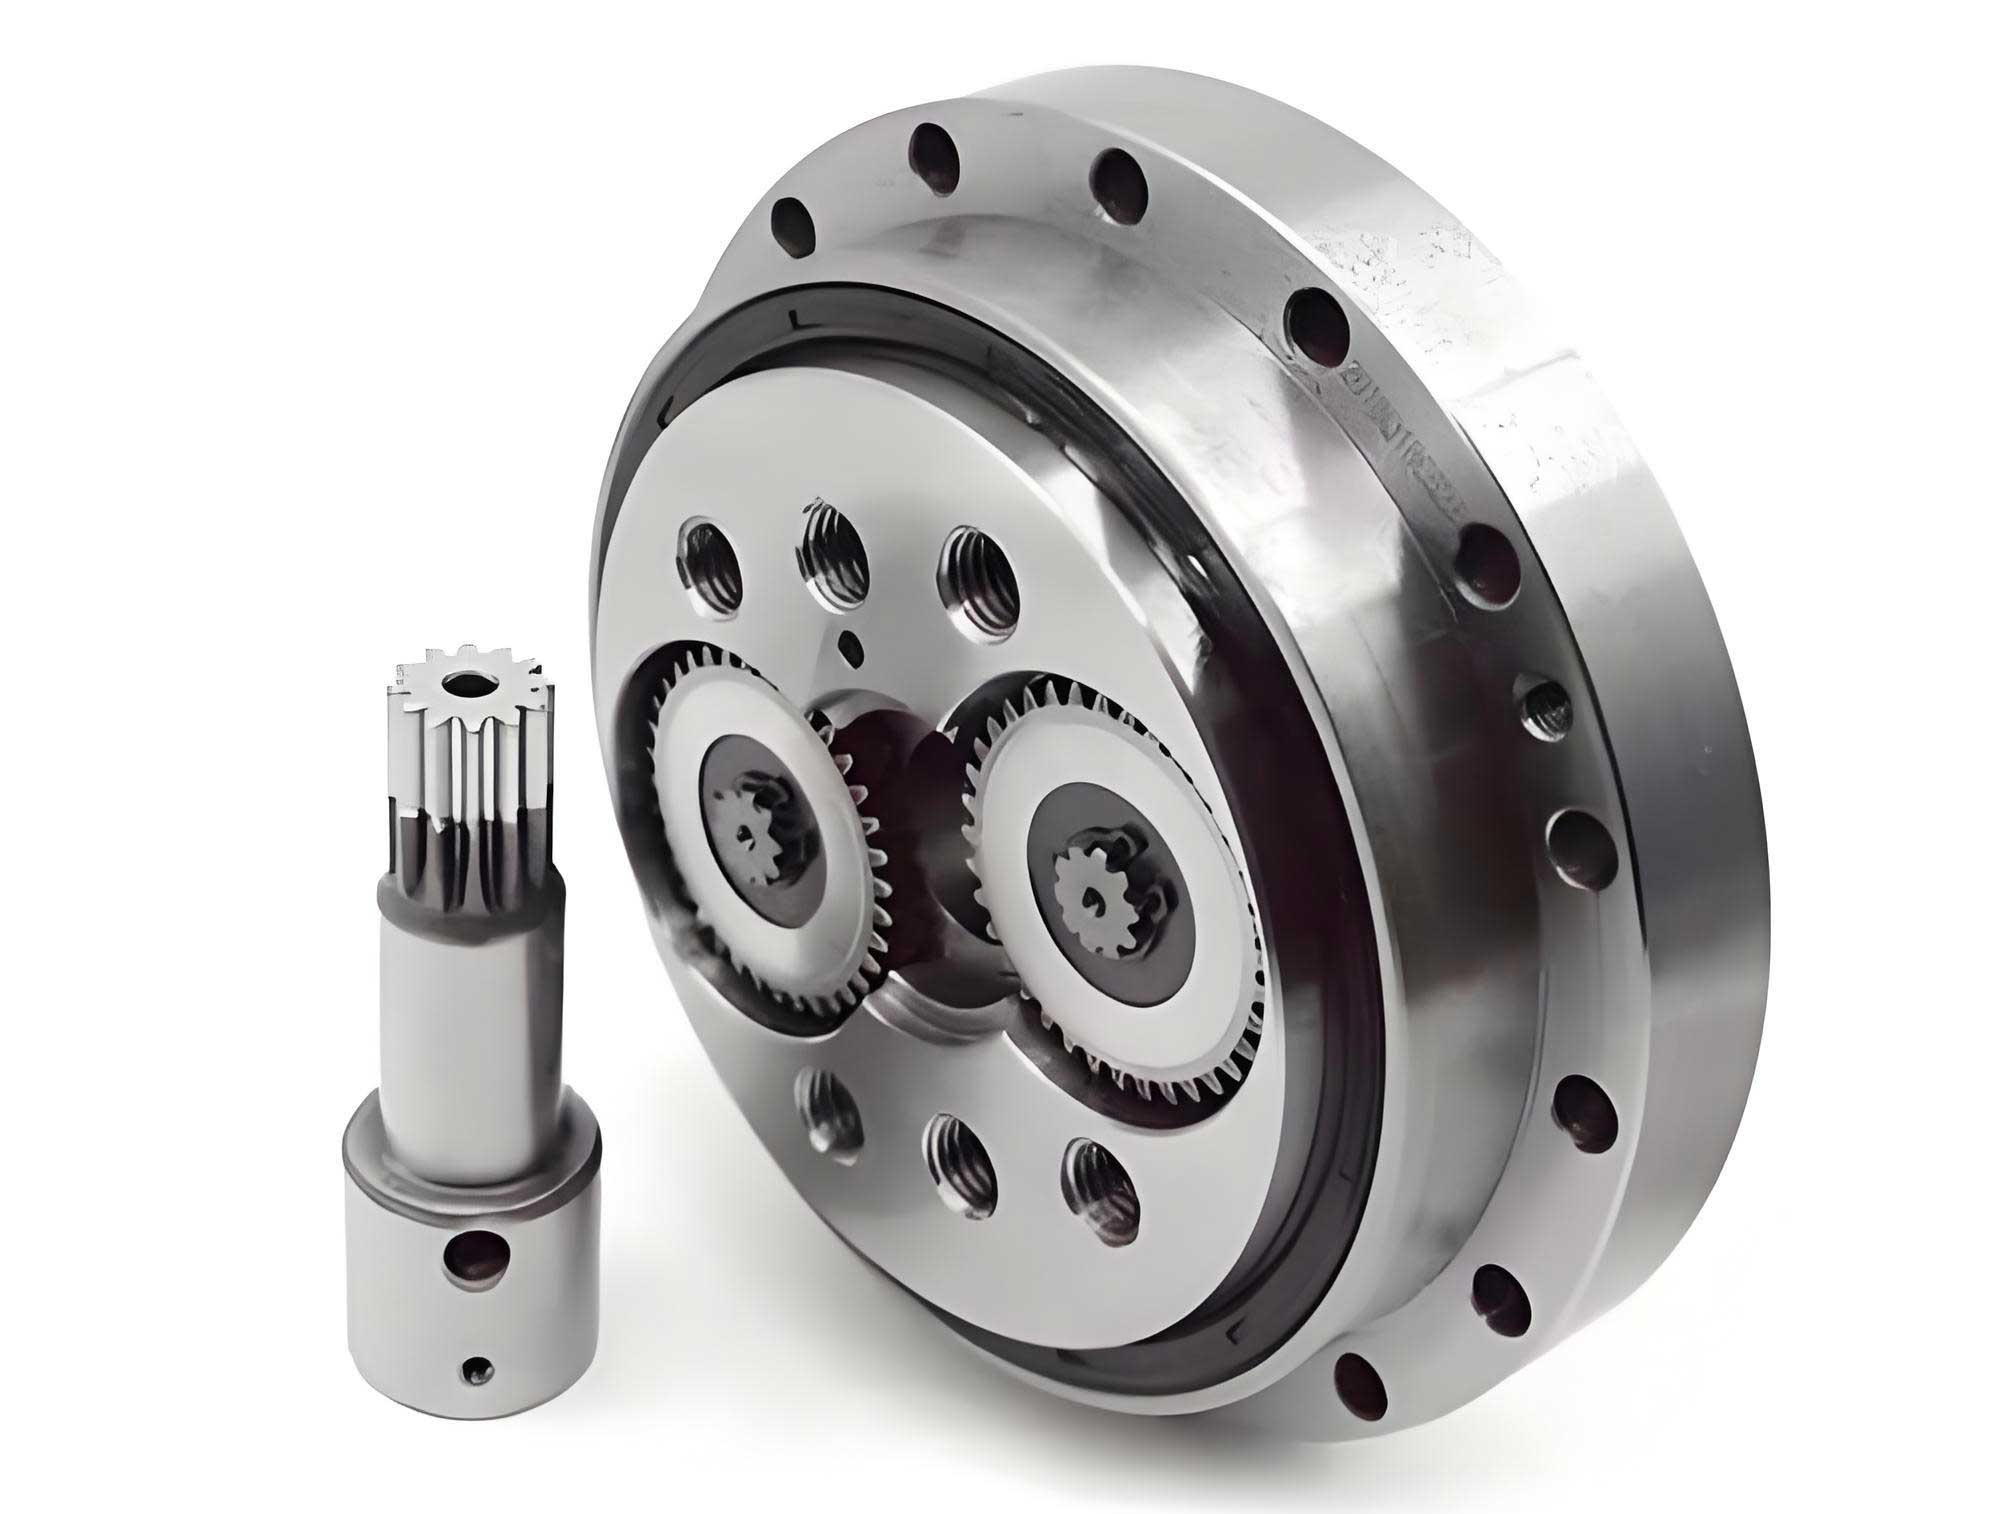
The operation of a standard RV reducer can be described as follows: The input rotation is provided to the sun gear. This drives the planetary gears, which constitute the first-stage reduction. Each planetary gear is connected via a spline to a crankshaft. The rotation of the planetary gears causes the crankshafts to revolve, carrying the cycloid disks mounted on their eccentric sections. This initiates the second stage. The cycloid disks mesh with the stationary pinwheel (or needle bearings housed in the pin housing). Due to the difference in the number of teeth between the cycloid disk (e.g., $Z_c$) and the pinwheel (e.g., $Z_p$), the cycloid disk undergoes a compounded planetary motion: a forced eccentric revolution (translation) and a resultant slow counter-rotation. This counter-rotation is transferred back through the crankshaft to the planet carrier, which serves as the output. When the pin housing is fixed, the total reduction ratio $R$ for a standard configuration is given by:
$$ R = 1 + \frac{Z_p}{Z_c – Z_p} \times Z_s $$
where $Z_s$ is the number of teeth on the planetary gear. For a common design with $Z_s=27$, $Z_c=39$, $Z_p=40$, the ratio calculates to 121.
From this mechanism, three primary categories of excitation sources within the RV reducer are identified, each associated with specific characteristic frequencies crucial for diagnostic analysis.
- Rotational Unbalance Excitation: This originates from residual mass unbalance in rotating components like the input shaft, crankshafts, and the output carrier. Its frequency is equal to the rotational frequency of the respective component ($f_r$).
$$ f_r = \frac{n}{60} $$
where $n$ is the rotational speed in revolutions per minute (RPM). - Gear Meshing Excitation: This is the most significant high-frequency vibration source, caused by the time-varying stiffness and transmission error during gear engagement at both stages. The fundamental meshing frequency ($f_m$) is:
$$ f_m = \frac{n \times z}{60} = f_r \times z $$
where $z$ is the number of teeth on the rotating gear in question. - Cycloid Disk Eccentric Motion Excitation: The eccentric revolution of the cycloid disk, driven by the crankshaft, generates periodic inertial forces. This frequency is tied to the revolution speed of the cycloid disk relative to the housing.
To perform a targeted vibration analysis, calculating the exact frequencies for a specific RV reducer model is essential. Taking an RV-20E model as an example, with parameters: Sun gear teeth $Z_{sun}=9$, Planetary gear teeth $Z_{plan}=27$, Cycloid disk teeth $Z_{cycl}=39$, Pinwheel teeth $Z_{pin}=40$. The rotational speeds of various components relative to the input speed ($n_{in}$) are derived from kinematic relations:
- Planet Gear Spin Speed (relative to carrier): $n_{plan}^{spin} = (Z_{pin} – 1) \times n_{out}$
- Cycloid Disk Revolution Speed (eccentric speed): $n_{cycl}^{rev} = n_{plan}^{spin}$
- Cycloid Disk Spin Speed: $n_{cycl}^{spin} = n_{out}$
Where the output speed $n_{out} = n_{in} / R$. Based on these, the characteristic frequencies for the RV-20E reducer at various input speeds are summarized in the table below.
| Excitation Source | Formula | Frequency at 400 RPM (Hz) | Frequency at 800 RPM (Hz) | Frequency at 1200 RPM (Hz) |
|---|---|---|---|---|
| Input Shaft Rotation ($f_{in}$) | $$ f_{in} = n_{in} / 60 $$ | 6.67 | 13.33 | 20.00 |
| Crankshaft Rotation ($f_{cr}$) | $$ f_{cr} = n_{out} / 60 $$ | 1.22 | 2.44 | 3.66 |
| Pinwheel/Carrier Rotation ($f_{out}$) | $$ f_{out} = n_{out} / 60 $$ | 0.11 | 0.22 | 0.33 |
| Planet Gear Spin ($f_{ps}$) | $$ f_{ps} = n_{plan}^{spin} / 60 $$ | 2.14 | 4.28 | 6.42 |
| Cycloid Disk Spin ($f_{cs}$) | $$ f_{cs} = n_{cycl}^{spin} / 60 $$ | 0.06 | 0.11 | 0.17 |
| Sun-Planet Meshing ($f_{m1}$) | $$ f_{m1} = f_{in} \times Z_{sun} $$ | 60.00 | 120.00 | 180.00 |
| Cycloid-Pin Meshing ($f_{m2}$) | $$ f_{m2} = f_{cycl}^{rev} \times Z_{pin} $$ where $f_{cycl}^{rev}=n_{cycl}^{rev}/60$ |
~47.6 | ~95.2 | ~142.8 |
The successful implementation of an online vibration detection system for the RV reducer requires a holistic integration of mechanical simulation, precise data acquisition, and advanced signal processing. The system I developed comprises four synergistic modules.
1. Motion Control & Loading Module: This module replicates the operational dynamics of a robotic joint. A servo motor, controlled via a programmable logic controller (PLC) or robotic controller cabinet, provides the precise input motion to the RV reducer. To simulate the inertial load experienced on a robot arm, a cantilever beam is attached to the output flange of the RV reducer, with calibrated masses fixed at its end. The total moment of inertia $J_{load}$ is calculated to represent a typical joint load:
$$ J_{load} = m \times l^2 $$
where $m$ is the mass and $l$ is the distance from the RV reducer output center. The RV reducer housing is rigidly mounted on a massive test bed to approximate a fixed base condition.
2. Vibration Sensing Module: The selection of sensors is critical given the low-amplitude, high-frequency nature of RV reducer vibrations. Integrated Circuit Piezoelectric (IEPE) accelerometers are chosen for their high sensitivity, wide frequency range, and robustness. Two single-axis accelerometers are mounted orthogonally on the RV reducer’s housing – typically in radial and tangential (or axial) directions – to capture the spatial vibration vector. Key sensor specifications include:
- Measurement Range: ±10 g
- Sensitivity: 500 mV/g
- Frequency Response: 0.5 Hz to 5 kHz
- Resolution: < 0.0001 g RMS
3. Data Acquisition Module: This module conditions and digitizes the analog signals from the sensors. A high-fidelity data acquisition (DAQ) device is employed with the following capabilities:
- Simultaneous sampling on all channels to maintain phase relationships.
- 24-bit Analog-to-Digital Converter (ADC) for high dynamic range.
- Built-in IEPE constant current excitation and signal conditioning.
- Sampling rate configurable well above the Nyquist rate for the highest frequency of interest (e.g., > 10 kHz).
4. Data Processing & Analysis Module (Software): This is the core of the online detection system. A specialized software platform, such as DEWESOFT, is utilized for real-time data visualization, recording, and analysis. Its functions include:
- Real-time Monitoring: Displaying time-domain waveforms from all accelerometer channels.
- Multi-rate Recording: Synchronously storing data from different sensor types.
- Online Spectral Analysis: Computing and displaying Fast Fourier Transform (FFT) spectra in real-time.
- Order Analysis: Resolving vibration components as a function of rotational speed (RPM), which is crucial for tracking speed-dependent excitations in the RV reducer.
- Custom Algorithm Integration: Implementing specific diagnostic algorithms, such as calculating overall vibration levels (RMS, peak), envelope detection for bearing faults, and comparing spectral peaks against the pre-calculated RV reducer characteristic frequency table.
The integration of these modules creates a closed-loop diagnostic system. The RV reducer operates under a programmed load profile, its vibration is captured, transformed into the frequency domain, and automatically analyzed against known fault signatures.
Applying the aforementioned online detection system to an RV-20E reducer yields insightful data. The test protocol involves sweeping the input servo motor speed from 300 RPM to 1800 RPM in steps, while continuously recording the vibration data.
Time-Domain Waveform Analysis: The raw acceleration signals reveal distinct patterns. A key feature observable in the time-domain signal is the “beat” phenomenon. For an RV reducer with two crankshafts (and thus two cycloid disks 180° apart), the vibration amplitude modulates at a frequency corresponding to the passing frequency of the crankshafts. Over one full revolution of the output carrier, two distinct beats are typically visible, reflecting the synchronous excitation from the two eccentric assemblies. The captured waveform’s amplitude, expressed in gravitational acceleration units (g), provides a direct measure of vibration intensity. The peak-to-peak and Root Mean Square (RMS) values are calculated as:
$$ A_{RMS} = \sqrt{\frac{1}{T} \int_{0}^{T} a(t)^2 dt} $$
where $a(t)$ is the instantaneous acceleration and $T$ is the averaging time.
Vibration Characteristic Curve: Plotting the overall vibration level (e.g., velocity RMS or acceleration RMS) against the input speed generates the vibration characteristic curve for the RV reducer. This curve is a fundamental performance fingerprint. Data from tests consistently show that vibration amplitude generally increases with rotational speed due to higher dynamic forces. However, critical speeds or resonances may appear as distinct peaks. For instance, a pronounced peak often occurs around 1200 RPM input speed, indicating a potential structural resonance or a harmonic alignment of excitation frequencies within the RV reducer assembly. Adherence to quality standards, such as maintaining vibration below 0.1 g RMS under rated load, can be instantly verified from this curve.
| Input Speed (RPM) | Radial Acceleration RMS (g) | Tangential Acceleration RMS (g) | Overall Vibration Level (g) | Pass/Fail (vs 0.1g spec) |
|---|---|---|---|---|
| 400 | 0.012 | 0.010 | 0.016 | Pass |
| 800 | 0.028 | 0.025 | 0.038 | Pass |
| 1200 | 0.065 | 0.058 | 0.087 | Pass |
| 1600 | 0.045 | 0.042 | 0.062 | Pass |
Frequency-Domain (FFT) Spectrum Analysis: This is the most powerful diagnostic tool. Converting the complex time-domain signal to the frequency domain via the FFT algorithm decomposes the vibration into its constituent sinusoidal components. The resulting spectrum displays amplitude versus frequency. By superimposing the calculated characteristic frequencies (from the table above) onto the measured spectrum, the source of dominant vibrations can be pinpointed.
For example, in an FFT spectrum taken at 1200 RPM input:
- A dominant peak at precisely 20 Hz corresponds perfectly to the input shaft rotational frequency ($f_{in}$). An anomalously high amplitude at this frequency suggests mass unbalance or misalignment of the input shaft.
- A cluster of high-amplitude peaks around 180 Hz aligns with the sun-planet meshing frequency ($f_{m1}$). Excessive vibration here indicates potential errors in first-stage gear manufacturing (profile error, pitch error) or improper assembly backlash.
- Another set of peaks near 143 Hz matches the cycloid-pin meshing frequency ($f_{m2}$). Amplitude anomalies in this region directly reflect the quality of the second-stage transmission, including cycloid disk tooth profile accuracy, pin position error, and assembly clearance of the needle bearings.
- The presence of sidebands around the meshing frequencies, spaced at the cycloid disk revolution frequency ($f_{cycl}^{rev}$), is a classic indicator of localized faults like a chipped tooth on a cycloid disk or a defective needle bearing in the pin housing.
The mathematical basis for this analysis is the discrete Fourier transform:
$$ X(f_k) = \sum_{n=0}^{N-1} x(t_n) e^{-i 2\pi k n / N} $$
where $x(t_n)$ is the discrete-time signal, $N$ is the number of samples, and $X(f_k)$ is the complex spectrum at frequency bin $f_k$.
The implementation of this online vibration detection framework delivers substantial benefits for the production and application of RV reducers. It transforms quality control from a passive, post-assembly audit to an active, in-process diagnostic procedure. By immediately identifying units whose vibration signatures deviate from the established healthy baseline, defective RV reducers can be quarantined before they leave the production line. More importantly, the spectral analysis provides actionable intelligence. If a batch of RV reducers consistently shows elevated peaks at the sun-planet meshing frequency, the feedback points directly to an issue in the first-stage gear hobbing or grinding process, or in the planetary gear assembly station. This enables rapid root-cause analysis and continuous process improvement.
For the end-user, such as a robotics integrator, the implications are significant. An RV reducer with minimal vibration ensures smoother motion, higher repeatable positioning accuracy, and reduced wear on its own components as well as on the adjoining robot arm structures. This directly translates to longer maintenance intervals, higher throughput due to less settling time, and extended operational lifespan for the entire robotic cell. The online detection system, therefore, serves as a key enabler for achieving the levels of reliability and precision demanded by modern advanced manufacturing, aerospace, and biomedical automation applications where the RV reducer is a cornerstone technology.
Future directions for this research involve enhancing the intelligence of the detection system. This includes integrating machine learning algorithms for automated fault classification and severity assessment, developing standardized pass/fail thresholds based on statistical analysis of large populations of RV reducers, and extending the methodology to monitor other critical parameters like temperature and transmission error concurrently with vibration. The ultimate goal is a fully autonomous, smart test cell that not only rejects faulty RV reducers but also provides detailed digital twins and health certificates for each unit shipped, fostering trust and enabling predictive maintenance in the field.