
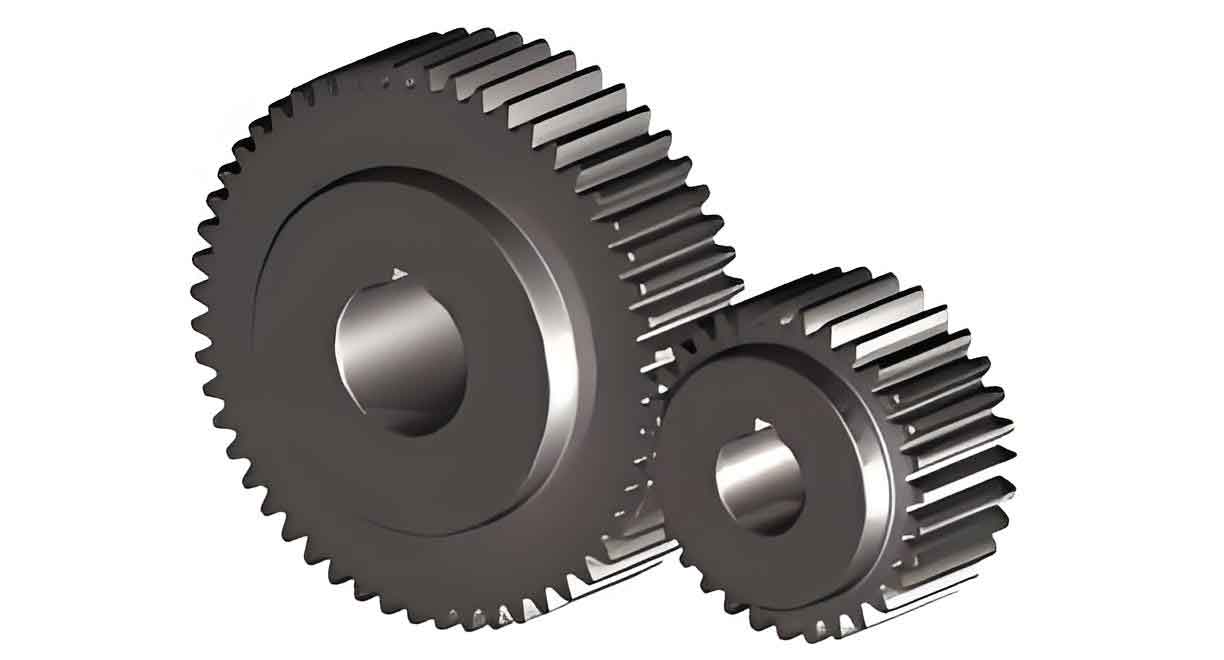
In mechanical power transmission systems, the reliable performance of spur gears is paramount. Failures such as tooth root fatigue fracture or pitting on the tooth flank surface can lead to catastrophic system breakdowns, often resulting from insufficient material strength, manufacturing inaccuracies, stress concentrators like small fillet radii, or an underestimation of operational loads during the design phase. Therefore, a rigorous and accurate assessment of the structural strength of spur gears is not merely an academic exercise but a critical engineering necessity. This analysis aims to delve deeply into the methodologies for evaluating the strength of spur gears, contrasting traditional theoretical calculations with modern finite element analysis (FEA) techniques, and extending the investigation to fatigue life prediction. By systematically comparing results from both approaches, we can validate the FEA methodology and establish a robust framework for designing more durable and reliable spur gear transmissions.
The fundamental geometry of spur gears is defined by several key parameters which directly influence their load-carrying capacity and stress state. For the purpose of this detailed analysis, we consider a specific gear pair. The essential parameters for these spur gears are summarized in the table below:
| Parameter | Pinion (Input Gear) | Gear (Output Gear) |
|---|---|---|
| Number of Teeth, Z | 9 | 23 |
| Face Width, b (mm) | 26 | 10 |
| Tip Diameter, d_a (mm) | 9 | 23 |
| Material | 40Cr Steel | 45 Steel |
| Young’s Modulus, E (GPa) | 211 | 209 |
| Poisson’s Ratio, ν | 0.277 | 0.269 |
| Density, ρ (kg/m³) | 7870 | 7890 |
The operating condition is defined by an input torque of $T = 0.13 \text{ N·m}$ applied to the pinion. The standard center distance is $a = 18 \text{ mm}$, with an operating center distance of $a’ = 17 \text{ mm}$.
Theoretical Strength Calculation for Spur Gears
The classical approach to spur gear design relies on standardized procedures outlined in mechanical engineering handbooks, such as those by AGMA or ISO. These methods calculate two primary types of stress: contact (Hertzian) stress and bending stress.
Contact Stress Calculation
The contact stress at the pitch point or the lowest point of single tooth contact is calculated to prevent surface failures like pitting. The fundamental formula is based on Hertzian contact theory and incorporates several application factors. The contact stress $\sigma_H$ is given by:
$$
\sigma_H = Z_H Z_E Z_{\varepsilon} \sqrt{ \frac{F_t}{b d_1} \cdot \frac{u + 1}{u} \cdot K_A K_V K_{H\beta} K_{H\alpha} }
$$
Where:
- $F_t$ is the tangential force at the reference circle, derived from the input torque $T$ and pitch radius.
- $b$ is the face width.
- $d_1$ is the pinion reference diameter.
- $u$ is the gear ratio ($Z_2 / Z_1$).
- $Z_H$ is the zone factor, accounting for the geometry at the pitch point.
- $Z_E$ is the elasticity factor, $\sqrt{ \frac{1}{\pi \left( \frac{1-\nu_1^2}{E_1} + \frac{1-\nu_2^2}{E_2} \right) } }$.
- $Z_{\varepsilon}$ is the contact ratio factor.
- $K_A$, $K_V$, $K_{H\beta}$, $K_{H\alpha}$ are the application factor, dynamic factor, face load factor, and transverse load factor, respectively.
Applying this formula with the given parameters and appropriate factor selections from standard tables yields the theoretical contact stresses for our spur gears.
Bending Stress Calculation
The bending stress at the tooth root is calculated to prevent fatigue crack initiation and tooth breakage. The Lewis equation forms the basis, augmented by modern correction factors. The bending stress $\sigma_F$ is expressed as:
$$
\sigma_F = \frac{F_t}{b m_n} \cdot Y_{Fa} Y_{Sa} Y_{\varepsilon} Y_{\beta} \cdot K_A K_V K_{F\beta} K_{F\alpha}
$$
Where:
- $m_n$ is the normal module.
- $Y_{Fa}$ is the form factor, dependent on tooth geometry and number of teeth.
- $Y_{Sa}$ is the stress correction factor.
- $Y_{\varepsilon}$ is the bending contact ratio factor.
- $Y_{\beta}$ is the helix angle factor (equal to 1 for spur gears).
- $K_{F\beta}$ and $K_{F\alpha}$ are the face load factor and transverse load factor for bending.
Using the established procedures, the theoretical bending stresses for the pinion and gear are computed. The results from the theoretical calculations for both spur gears are consolidated below:
| Spur Gear Component | Theoretical Bending Stress, $\sigma_F$ (MPa) | Theoretical Contact Stress, $\sigma_H$ (MPa) |
|---|---|---|
| Pinion (Input) | 15 | 12 |
| Gear (Output) | 24 | 18 |
Finite Element Analysis of Spur Gear Strength
While theoretical methods are invaluable, they involve simplifications and empirical factors. Finite Element Analysis offers a more direct, visual, and potentially more accurate means of determining the stress state within complex geometries like spur gears.
Model Preparation and Meshing
A high-fidelity three-dimensional solid model of the spur gear pair is created based on the precise geometric parameters. The model is then imported into a professional FEA software suite (e.g., ANSYS Mechanical). The geometry is cleaned and prepared to ensure a watertight volume suitable for high-quality meshing. The volumes are discretized using a fine mesh of second-order tetrahedral (solid) elements, which are well-suited for capturing the complex curvatures of gear teeth. The final finite element model for the contact analysis consists of over 34,000 elements, ensuring sufficient resolution in the critical contact and root fillet regions.
Material Properties and Boundary Conditions
The material properties listed in the first table are assigned to their respective spur gears: 40Cr steel for the pinion and 45 steel for the gear. A transient structural analysis is set up to simulate the meshing process. The boundary conditions are applied as follows:
- Connections: A frictional contact pair is defined between the engaging tooth flanks of the two spur gears. A standard coefficient of friction is applied.
- Constraints: The inner bore of the output gear is fixed in all degrees of freedom. The inner bore of the input pinion is constrained to allow rotation only about its central axis.
- Loads: A moment (torque) of $T = 0.13 \text{ N·m}$ is applied to the pinion’s central axis, simulating the driving input.
This setup accurately represents the physical loading condition where one spur gear drives the other.
FEA Results: Static Stress Analysis
The solved finite element model provides a detailed von Mises equivalent stress distribution. For the pinion, the maximum stress of approximately 15 MPa is localized at the root fillet of the teeth in the meshing zone. Similarly, for the output spur gear, the maximum root fillet stress reaches about 18 MPa. These values represent the bending-dominated stress in the teeth.
Furthermore, the contact analysis explicitly calculates the pressure between the mating teeth. The results show a narrow band of high contact pressure along the line of action. The maximum contact pressure on the pinion tooth flank is found to be 15.6 MPa, while on the gear tooth flank it is 18.8 MPa. The distribution aligns perfectly with Hertzian contact theory expectations.
Comparison: Theoretical vs. FEA Results
A critical step in validating any analytical method is comparison with established results. The table below juxtaposes the stresses obtained from the two methods for our spur gears.
| Stress Type & Component | Theoretical Value (MPa) | FEA Value (MPa) | Notes |
|---|---|---|---|
| Bending Stress (Pinion) | 15 | 15 | Excellent agreement. |
| Bending Stress (Gear) | 24 | 18 | Discrepancy noted; FEA often provides a more localized “hot spot” value. |
| Contact Stress (Pinion) | 12 | 15.6 | FEA typically yields the peak pressure, while theory may calculate a nominal value. |
| Contact Stress (Gear) | 18 | 18.8 | Close agreement, within reasonable engineering tolerance. |
The bending stress comparison shows very good agreement for the pinion and a notable difference for the gear. This discrepancy can often be attributed to the specific location of stress evaluation: theoretical methods use a defined root chord, while FEA identifies the precise point of maximum stress concentration, which can be higher or lower depending on fillet geometry and load position. The contact stress values from FEA are reasonably close to, but generally slightly higher than, the theoretical predictions. This is expected because the FEA solution captures the exact local deformation and pressure distribution without relying on averaged factors like $K_{H\beta}$ and $Z_{\varepsilon}$. The most important conclusion is that the trends and order of magnitude match, strongly validating the use of FEA for stress analysis of spur gears.
Fatigue Life Assessment of Spur Gears
Static strength is only one part of the story. Spur gears in service are subjected to cyclic loading, making fatigue failure a primary concern. FEA software often includes integrated fatigue analysis tools based on strain-life or stress-life methods (e.g., Miner’s rule).
Fatigue Analysis Setup
For this analysis, a simplified model of a single spur gear tooth or segment can be used to reduce computational cost while maintaining accuracy for life prediction. A very fine mesh with over 440,000 elements is generated to accurately resolve stress gradients. The material’s S-N curve (stress versus cycles to failure) for 40Cr steel must be defined or estimated. The loading is defined as a fully-reversed, constant-amplitude cyclic moment applied to simulate the repetitive meshing action. The magnitude of this moment is derived from the nominal operating torque. A mean stress correction model (like Goodman or Gerber) is applied to account for the non-zero mean stress in gear tooth bending.
Fatigue Analysis Results
The fatigue analysis solves for two key results: life (in cycles) and safety factor. The life distribution plot shows that the minimum number of cycles to failure is on the order of $2 \times 10^7$ cycles at the critical root fillet location. For many applications, this constitutes a virtually infinite life, indicating good fatigue resistance under the given load. The safety factor distribution plot confirms this, showing a minimum safety factor of approximately 1.0 at the same critical location. A safety factor of 1.0 indicates the design is at the limit of the endurance strength for infinite life; values above 1.0 indicate a proportionally longer life or capacity for higher loads. This analysis provides a quantitative and visual assessment of the spur gear’s durability under cyclic loading, going far beyond the capabilities of simple theoretical checks.
Conclusions and Engineering Insights
This comprehensive investigation into the structural strength of spur gears through both theoretical and finite element methods leads to several important conclusions:
- Validation of FEA: The finite element analysis results for both bending and contact stress in the spur gears showed good correlation with established theoretical calculations. The minor discrepancies are understandable and often attributable to the FEA’s ability to model precise geometries and nonlinear contact conditions without relying on generalized empirical factors. This confirms that FEA is a highly viable and accurate tool for analyzing spur gear strength.
- Superior Detail of FEA: The FEA provides a significant advantage by visually and quantitatively revealing the exact stress distribution. It pinpointed the maximum von Mises stress at the precise location of the root fillet radius, a value that can be more accurate than the traditional method which involves chart lookups for form factors and assumes a specific critical section. For contact analysis, FEA directly outputs the pressure distribution along the tooth flank.
- Integrated Fatigue Prediction: A major strength of the modern FEA approach is its seamless integration with fatigue life prediction algorithms. This allows engineers to not only verify that stresses are below static yield strengths but also to estimate the operational lifespan of the spur gears under cyclic loading, thereby enabling true durability-driven design.
- Design Utility: The methodologies demonstrated here form a robust framework. Engineers can use this approach to rapidly prototype and analyze different spur gear geometries (module, pressure angle, profile shift), materials, and loading conditions. Sensitivity studies on parameters like fillet radius can be easily performed to optimize the design for minimum weight or maximum life.
In summary, while traditional handbook calculations remain a vital and quick first-pass tool in the design of spur gears, finite element analysis offers a powerful, detailed, and comprehensive supplement. It bridges the gap between simplified theory and complex reality, providing deeper insights into stress states, failure modes, and ultimately, enabling the creation of more reliable, efficient, and durable spur gear transmissions. The synergy of both methods represents best practice in modern mechanical design.