
The pursuit of higher power density and reliability in modern transmission systems, particularly for demanding applications such as naval propulsion and aerospace engines, has placed herringbone gears at the forefront of mechanical design. The inherent advantage of herringbone gears lies in their balanced axial thrust and superior load-carrying capacity compared to single helical gears. However, these advantages are critically dependent on precise manufacturing and alignment. In practical installations, the inevitable presence of assembly inaccuracies and deflections under load can lead to a condition known as crossed axes malposition, where the rotational axes of the mating pinion and gear are not perfectly parallel. This misalignment disrupts the intended uniform load sharing between the left-hand and right-hand helical halves of the herringbone gear, leading to localized stress concentrations and, consequently, elevated thermal loads on the tooth flanks. This localized overheating is a primary driver for scuffing or adhesive wear, a severe form of surface failure. Therefore, developing an accurate predictive model for the transient flash temperature on the tooth surface of herringbone gears operating under realistic misaligned conditions is paramount for robust anti-scuffing design and operational safety.
Traditional methods for predicting gear contact temperature largely rely on the classical Blok flash temperature theory. This theory, while foundational, typically incorporates simplifying assumptions derived from Hertzian contact mechanics. It often models the contact area as a perfect rectangle (for line contact) or an ellipse (for point contact), leading to a constant semi-contact width along the potential contact line. Furthermore, many existing approaches treat the load distribution as uniform or derived from simplified load-sharing models. These assumptions can introduce significant inaccuracies for herringbone gears under misalignment, where the contact is neither purely line nor point contact, and the contact pressure and semi-width vary dramatically along the face width due to the induced偏载 (biased load). This necessitates a shift from Hertzian-based analysis to a more general non-Hertzian contact framework that can accurately resolve the two-dimensional pressure distribution and the variable contact geometry under complex edge conditions caused by misalignment.
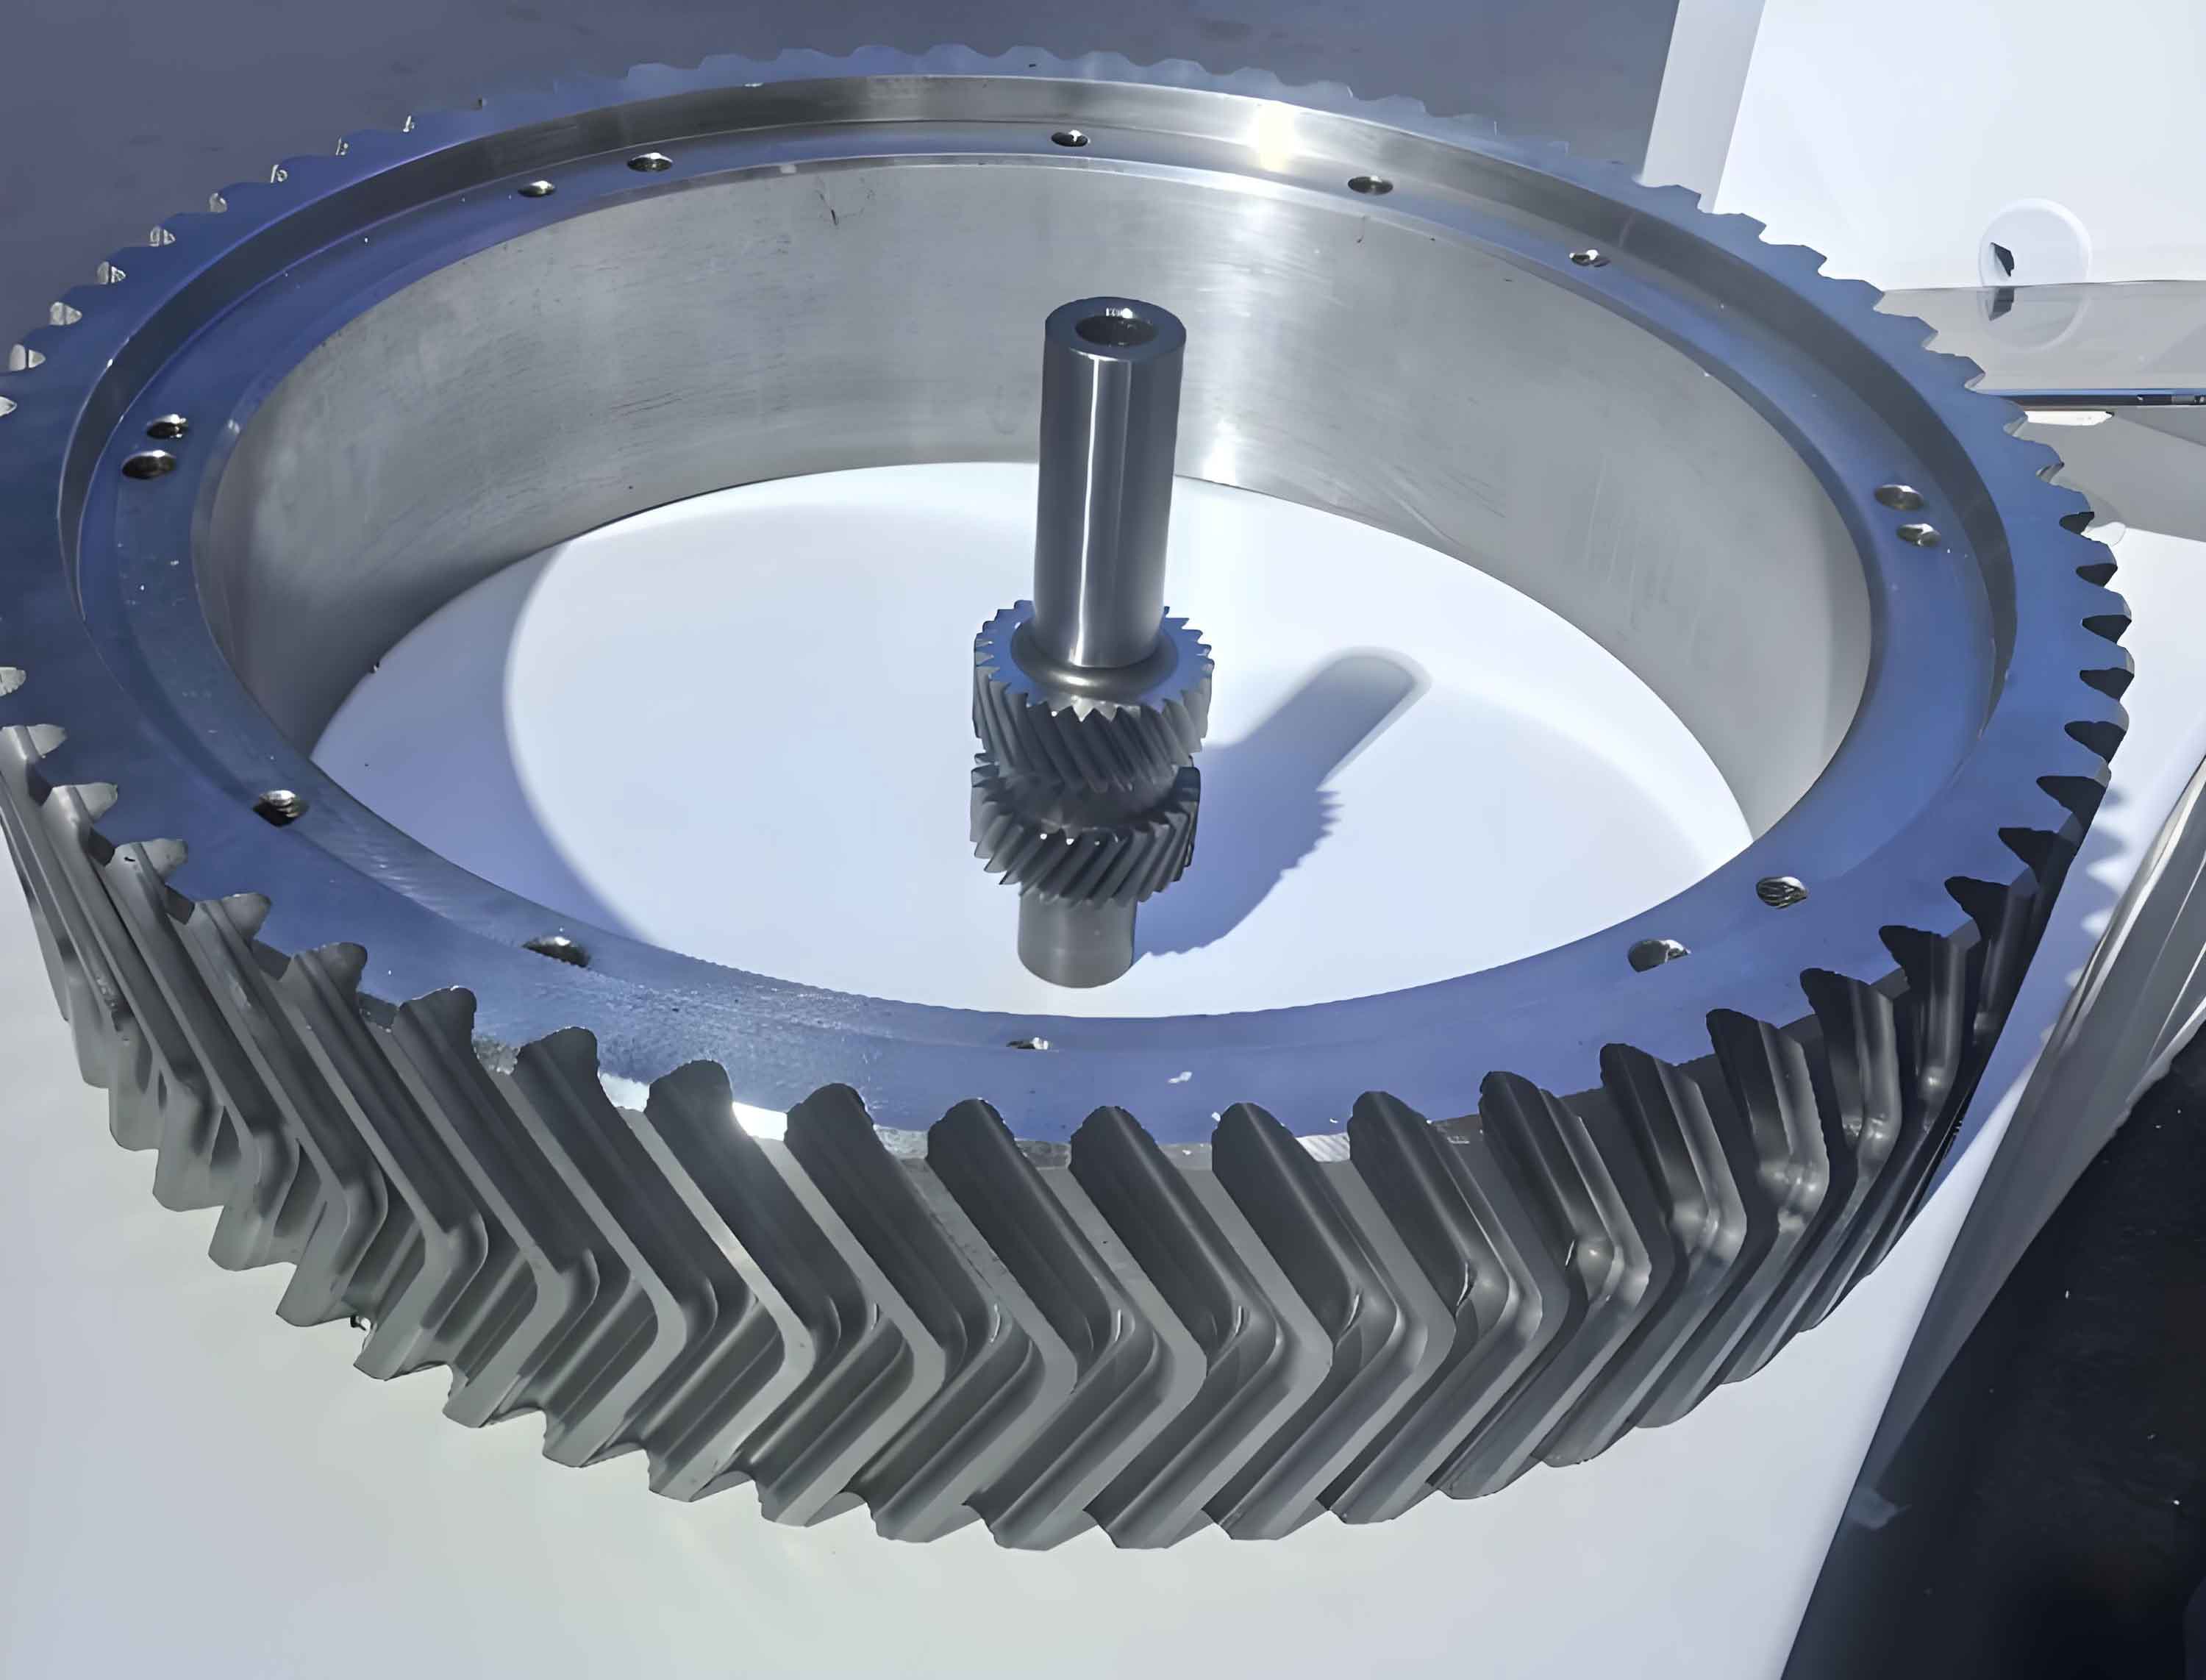
This article presents a comprehensive methodology for the dynamic calculation of flash temperature in herringbone gears, explicitly accounting for crossed axes malposition. The core of the method is a discrete non-Hertzian contact analysis model that accurately computes the load distribution and contact patch dimensions. This is coupled with a refined Blok flash temperature formula that utilizes the locally computed contact parameters. The model begins by establishing the geometric and kinematic conditions of the meshing herringbone gears, including the computation of the initial unloaded tooth gap that is perturbed by both geometric transmission error and the misalignment error. The subsequent sections detail the numerical contact model, the flash temperature calculation procedure, and a thorough analysis of the results for a representative high-speed, high-torque herringbone gear pair.
1. Mathematical Foundation for Non-Hertzian Contact Under Misalignment
The accurate prediction of contact stresses in herringbone gears under misalignment requires abandoning the classical Hertzian ellipse/rectangle assumption. Instead, we adopt a discretized influence coefficient method that can handle arbitrary contact geometries. The first step is to define the initial separation between the mating tooth surfaces before any load is applied, as this gap directly influences which parts of the tooth will come into contact and how the load is distributed.
1.1. Initial Contact Gap with Crossed Axes Error
Consider a herringbone gear pair where the pinion and gear axes are not perfectly parallel but are skewed by a small crossed axes angle, denoted as Δφ. This misalignment, often arising from manufacturing tolerances, bearing clearance, and housing deflection, modifies the relative orientation of the mating tooth surfaces. To model this, we define a fixed global coordinate system S. The pinion and gear tooth surfaces, Σ₁ and Σ₂, are represented mathematically within this system, with Σ₂’s orientation adjusted by the misalignment angle Δφ. The equations for these surfaces can be derived using standard gear geometry and coordinate transformation techniques from the literature on tooth contact analysis (TCA).
The initial gap at any potential contact point is composed of two parts: the kinematic displacement due to geometric transmission error and the geometric gap due to surface topography and misalignment. The geometric transmission error, ψ, represents the deviation of the driven gear’s angular position from its ideal location for a given pinion rotation:
$$ \psi = (\varphi_2 – \varphi_2^0) – (\varphi_1 – \varphi_1^0) \frac{z_1}{z_2} $$
where φ₁, φ₂ are the instantaneous rotation angles of the pinion and gear, φ₁⁰, φ₂⁰ are their initial angles, and z₁, z₂ are the numbers of teeth.
At a chosen initial contact point M₀ on the path of contact, this angular error translates into a normal separation δ_{M₀}:
$$ \delta_{M_0} = \mathbf{r}_{M_0} \cdot \mathbf{n}_{M_0} \psi_{M_0} $$
where $\mathbf{r}_{M_0}$ and $\mathbf{n}_{M_0}$ are the position vector and unit normal vector at point M₀, respectively.
To find the geometric gap at any other point Mᵢ in the vicinity of M₀, we project along the common normal direction $\mathbf{n}_{M_0}$. The coordinates of points M_{i1} and M_{i2}—the intersections of this normal line with surfaces Σ₁ and Σ₂—are found by solving a system of equations combining the line equation and the surface equations. The geometric normal gap b_{Mᵢ} is then the distance between these two points:
$$ b_{M_i} = \sqrt{(x_{i1} – x_{i2})^2 + (y_{i1} – y_{i2})^2 + (z_{i1} – z_{i2})^2} $$
Consequently, the total initial unloaded gap w_{Mᵢ} at any discrete point Mᵢ is:
$$ w_{M_i} = \delta_{M_0} + b_{M_i} $$
This w_{Mᵢ} matrix is the fundamental input that defines the contact problem before elastic deformation occurs.
1.2. Discrete Non-Hertzian Contact Analysis Model
The contact region on the tooth flank is discretized into a grid of n small rectangular elements of area s = Δx × Δy. The core idea of the influence coefficient method is that the total elastic deformation at any point k is the superposition of deformations caused by loads acting at all points i within the potential contact zone. For herringbone gears, the deformation compatibility must be enforced simultaneously for the left-hand (L) and right-hand (R) flank pairs that are in mesh at a given instant (typically two pairs for double-contact intervals).
The deformation at point k due to a unit load at point i is given by the influence coefficient D_{ki}:
$$ D_{ki} = f_{H,ki} + f_{B,ki} $$
Here, $f_{H,ki}$ is the contact (local) deformation coefficient, calculated using the Boussinesq solution for a semi-infinite body, and $f_{B,ki}$ is the bending (global) deformation coefficient of the gear tooth, which can be obtained from cantilever beam models or finite element-based flexibility calculations (e.g., using methods like those proposed by Linke).
For a herringbone gear pair under load, the following system of equations governs the contact:
- Deformation Compatibility: The sum of the initial gap and the elastic deformation at any point in the actual contact area must equal the rigid body approach u of the two gears. Outside the contact area, the gap must be greater than or equal to u.
- Equilibrium Condition: The sum of all discrete contact forces must equal the total transmitted normal load F_n.
- Unilateral Contact Condition: Contact pressure can only be positive (compressive).
This leads to a linear complementarity problem. For numerical solution, it is often formulated by iteratively identifying the active contact zone. The system for two simultaneous meshing tooth pairs (j=1,2) on left and right flanks can be represented in matrix form. The contact pressure distribution $\mathbf{P}^j_{L/R}$ for each flank is solved from:
$$ \mathbf{Q}^j_{L/R} \mathbf{P}^j_{L/R} + \mathbf{w}^j_{L/R} – u \mathbf{I} = 0 $$
subject to $P^j_{i, L/R} \ge 0$ and the equilibrium constraint:
$$ s \sum_{j=1}^{2} \left( \sum_{i=1}^{n^j_L} P^j_{i,L} + \sum_{i=1}^{n^j_R} P^j_{i,R} \right) = F_n $$
Here, $\mathbf{Q}^j_{L/R}$ is the matrix of influence coefficients for the j-th pair, $\mathbf{w}^j_{L/R}$ is the vector of initial gaps, and $\mathbf{I}$ is a column vector of ones. Solving this system yields the detailed 2D contact pressure distribution $P(x,y)$ for both the left and right flanks of the herringbone gears, clearly showing the effects of misalignment-induced偏载.
A key output from this non-Hertzian analysis, which is unavailable from classical Hertz theory, is the varying contact semi-width along the face width. For any slice across the tooth (constant y-coordinate), the contact semi-width B(y) is determined from the computed pressure profile P(x,y) across that slice. It is defined as the half-length of the segment where the contact pressure is greater than zero. This variable B(y) is a critical input for an accurate flash temperature calculation.
2. Dynamic Flash Temperature Calculation Model
The classical Blok flash temperature formula provides a good foundation but requires adaptation to incorporate the detailed outputs from the non-Hertzian contact analysis. The flash temperature rise is assumed to occur in a very thin surface layer during the brief moment of asperity interaction.
2.1. Kinematics and Friction at Discrete Points
For any discrete contact point Mᵢ, the surface velocities of the pinion and gear are essential. The tangential velocity vectors $\mathbf{V}_{M_{i1}}$ and $\mathbf{V}_{M_{i2}}$ at the corresponding points on the two surfaces are calculated by subtracting the component normal to the surface from the rigid body velocity:
$$ \mathbf{V}_{M_{i1}} = \boldsymbol{\omega}_1 \times \mathbf{r}_{M_{i1}} – [(\boldsymbol{\omega}_1 \times \mathbf{r}_{M_{i1}}) \cdot \mathbf{n}_{M_{i1}}] \mathbf{n}_{M_{i1}} $$
$$ \mathbf{V}_{M_{i2}} = \boldsymbol{\omega}_2 \times \mathbf{r}_{M_{i2}} – [(\boldsymbol{\omega}_2 \times \mathbf{r}_{M_{i2}}) \cdot \mathbf{n}_{M_{i2}}] \mathbf{n}_{M_{i2}} $$
The sliding velocity $\mathbf{V}_{s, M_i}$, whose magnitude is critical for frictional heat generation, is:
$$ \mathbf{V}_{s, M_i} = \mathbf{V}_{M_{i1}} – \mathbf{V}_{M_{i2}} $$
The friction coefficient µ_{m,i} at point Mᵢ is not constant but depends on the local contact pressure, sliding speed, radii of curvature, surface roughness, and most importantly, the lubricant viscosity, which itself is a function of temperature. An empirical relationship often used in gear tribology is:
$$ \mu_{m,i} = \alpha \left[ \frac{P_i |V_{s,i}|}{(1/\rho_{1,i} + 1/\rho_{2,i})} \right]^{0.2} \eta^{-0.05} \left( \frac{R_{a1}+R_{a2}}{2} \right)^{0.25} X_L $$
where α is an empirical constant, η is the dynamic viscosity, ρ are the effective radii of curvature, R_a are surface roughness values, and X_L is a lubricant factor. The viscosity η is strongly temperature-dependent, often modeled by the Vogel-like equation:
$$ \log(\nu + c) = p – q \log(T + 273.15) $$
where ν is the kinematic viscosity, c, p, q are constants, and T is the temperature in °C. This coupling necessitates an iterative solution for consistency between friction heat generation and surface temperature.
2.2. Refined Blok Formula with Non-Hertzian Parameters
The standard Blok formula calculates the peak flash temperature rise. We refine it by applying it locally to each discrete contact element using its specific operating conditions from the non-Hertzian solution. The instantaneous flash temperature rise T_{f,i} at a discrete point i is given by:
$$ T_{f,i} = \frac{\phi \, \mu_{m,i} \, P_i \, |V_{s,i}|}{ \left[ \sqrt{\rho_1 c_1 k_1 V_{1,t}} + \sqrt{\rho_2 c_2 k_2 V_{2,t}} \right] \sqrt{2 B_i} } $$
In this adapted formula:
- φ is a heat partition factor (often taken as 1.11).
- µ_{m,i} is the local friction coefficient.
- P_i is the local contact pressure from the non-Hertzian analysis.
- |V_{s,i}| is the magnitude of the local sliding velocity.
- ρ, c, k are the density, specific heat, and thermal conductivity of the pinion (1) and gear (2) materials.
- V_{1,t}, V_{2,t} are the magnitudes of the tangential surface velocities (rolling components) in the direction of motion.
- B_i is the local contact semi-width at point i’s location along the face width, obtained directly from the non-Hertzian pressure distribution profile. This replaces the constant semi-width assumption of Hertzian theory.
By calculating T_{f,i} for all active contact points across the flanks of all meshing tooth pairs throughout the gear rotation cycle, a dynamic map of the flash temperature distribution on the tooth surfaces of the herringbone gears is constructed.
3. Analysis of Results for a High-Power Herringbone Gear Set
To demonstrate the application and insights provided by this methodology, we analyze a case study of a high-speed, high-torque herringbone gear pair. The basic parameters are summarized in Table 1.
| Parameter | Pinion | Gear |
|---|---|---|
| Number of Teeth, z | 21 | 37 |
| Normal Module, m_n (mm) | 15 | 15 |
| Normal Pressure Angle, α_n (°) | 20 | 20 |
| Helix Angle, β (°) | 8 | 8 |
| Face Width per Helix (mm) | 180 | 180 |
| Young’s Modulus, E (GPa) | 207 | 207 |
| Specific Heat Capacity, c (J/kg·K) | 490 | 490 |
| Input Torque, T (N·m) | 5000 | – |
| Pinion Speed, n (rpm) | 1000 | – |
We investigate the effects of increasing crossed axes misalignment angles: Δφ₀ = 0°, Δφ₁ = 0.00094°, Δφ₂ = 0.00188°, Δφ₃ = 0.00376°.
3.1. Validation of Non-Hertzian Contact Pressure Model
First, the non-Hertzian contact model was validated for the perfectly aligned case (Δφ=0°) at the pitch point. The calculated 2D contact pressure distribution showed excellent qualitative agreement with results from established commercial software (Romax) and traditional LTCA methods. The pressure was highest at the center of the contact ellipse and decreased smoothly towards the edges. Crucially, for the aligned case, the pressure distributions and maximum values for the left and right flanks were nearly identical, confirming symmetric load sharing in herringbone gears without misalignment.
The significant advantage of the proposed method became evident when misalignment was introduced. Figure 5(d) in the reference material illustrates the dramatic change. Under a misalignment of Δφ₃, the contact patterns on the left and right flanks become distinctly different in size, shape, and peak pressure. The heavily loaded flank (e.g., the left flank in this example) experiences a higher peak contact stress and a potentially shifted contact pattern, while the lightly loaded flank sees a reduction. The model successfully captures this complex, non-elliptical contact area, which cannot be predicted by standard Hertzian theory.
3.2. Load Sharing and偏载 Phenomena
The load sharing coefficient, γ_M, defined as the fraction of total normal load carried by a single meshing tooth pair, was analyzed over the roll angle (from mesh-in to mesh-out). Figure 6 from the reference material clearly shows the effect of misalignment. For Δφ=0°, the curves for the left and right flanks are superimposed, indicating perfect load sharing. As Δφ increases, the curves diverge. The load sharing coefficient increases for the heavily loaded flank and decreases for the lightly loaded flank over most of the meshing cycle.
Quantitatively, at the peak of the load sharing curve, the heavily loaded flank’s coefficient increased by up to 56.37% for the maximum misalignment Δφ₃, while the lightly loaded flank’s coefficient decreased by up to 44.98%. This represents a severe偏载 condition. Furthermore, the peaks of the load sharing curves shift slightly in roll angle with increasing misalignment, indicating a change in the precise timing of maximum load.
3.3. Flash Temperature Distribution and Evolution
The flash temperature distribution across the tooth surface at the pitch point, calculated using the refined model, is highly non-uniform. The temperature is highest along the central band of the contact area where the product of pressure and sliding velocity is greatest, and decreases towards the edges of the contact patch.
Tracking the maximum flash temperature along the path of contact (Figure 8) reveals the characteristic “bathtub” shape: temperatures are highest near the mesh-in and mesh-out points where sliding velocities are maximal, and lowest around the pitch point where pure rolling occurs. The proposed model quantifies this effectively.
The most critical insight comes from comparing the flash temperatures on the left and right flanks under misalignment. As shown conceptually in Figures 9 and 10, when Δφ > 0°, a persistent temperature difference develops between the two flanks. The heavily loaded flank (e.g., left) experiences a global increase in flash temperature across the roll angle, while the lightly loaded flank (right) experiences a decrease. The temperature difference ΔT_f between corresponding points on the mid-section of the left and right flanks is plotted in Figure 11.
Key Observations on Flash Temperature Difference (ΔT_f):
- Trend along Roll Angle: ΔT_f is not constant. It generally decreases as the contact moves from mesh-in towards the pitch point, reaches a minimum (often near zero, but not always exactly at the pitch point depending on misalignment), and then increases again towards mesh-out. This correlates with the changing intensity of偏载 during the mesh.
- Effect of Misalignment Magnitude: The magnitude of ΔT_f increases substantially with the crossed axes angle Δφ. Larger misalignment causes more severe偏载, leading to a greater disparity in contact pressures and frictional heat generation between the two sides of the herringbone gears.
- Effect of Rotational Speed: An increase in rotational speed (input rpm) amplifies the flash temperature difference ΔT_f at all roll angles except precisely at the pitch point (where sliding is zero). This amplification is non-linear and more pronounced near the mesh-in and mesh-out regions, as illustrated in Figure 12. The rate of increase of ΔT_f with speed is fastest at these high-sliding locations.
- Pitch Point Behavior: At the theoretical pitch point, the sliding velocity is zero. Therefore, even if there is a pressure difference due to misalignment, the frictional heat generation is zero, leading to a flash temperature rise of zero on both flanks. Consequently, ΔT_f at the exact pitch point remains zero regardless of misalignment or speed, as confirmed by the model.
4. Discussion and Implications for Design
The developed methodology provides a powerful tool for the anti-scuffing design of herringbone gears. By moving beyond Hertzian assumptions, it allows for a much more accurate prediction of the actual thermal loading on tooth flanks under realistic imperfect mounting conditions. The explicit calculation of the variable contact semi-width B(y) is a significant improvement over previous methods, as it directly influences the heat flux density in the Blok formula.
The results clearly demonstrate that even small crossed axes misalignations, on the order of a few hundredths of a degree, can induce significant偏载 in herringbone gears. This偏载 manifests not only as uneven stress distribution but, perhaps more critically for failure prediction, as a substantial asymmetry in flash temperature. The heavily loaded flank operates at a consistently higher risk of scuffing initiation, particularly near the entry and exit regions of the mesh where flash temperatures peak. The model’s ability to predict how this temperature difference scales with both misalignment magnitude and rotational speed is vital for setting manufacturing tolerances, specifying alignment procedures, and establishing safe operating envelopes for high-power herringbone gear transmissions.
Furthermore, the model establishes a direct link between system-level errors (shaft misalignment) and component-level failure modes (tooth surface scuffing). This enables a more holistic design approach where gear macro-geometry, micro-geometry modifications (profile and lead crowning), and system stiffness/alignment targets can be optimized concurrently to minimize the maximum flash temperature and equalize thermal load across both helical halves of the herringbone gears.
5. Conclusion
This article has presented an advanced, integrated methodology for analyzing the non-Hertzian contact and predicting the dynamic flash temperature of herringbone gears operating under crossed axes misalignment. The key contributions are:
- Development of a Discrete Non-Hertzian Contact Solver: A model based on the influence coefficient method was formulated to solve the contact problem for herringbone gears, explicitly incorporating the effects of geometric transmission error and shaft misalignment on the initial tooth gap. This model accurately computes the two-dimensional contact pressure distribution and, importantly, the contact semi-width that varies along the face width.
- Refinement of the Flash Temperature Calculation: The classical Blok formula was enhanced by integrating the locally computed parameters—specifically the variable contact semi-width B_i and the detailed pressure distribution P_i—from the non-Hertzian analysis. This allows for a precise, point-wise calculation of flash temperature rise across the tooth flank.
- Comprehensive Analysis of Misalignment Effects: The application of the methodology revealed critical insights:
- Increasing crossed axes misalignment角 causes severe and asymmetric偏载 between the left and right flanks of herringbone gears.
- The flash temperature difference between the heavily loaded and lightly loaded flanks follows a “V” shape along the roll angle, minimized near the pitch point.
- This temperature difference amplifies with both increasing misalignment magnitude and increasing rotational speed, with the most rapid increase occurring near the mesh-in and mesh-out points.
The proposed framework provides a superior theoretical foundation for the anti-scuffing design of high-performance herringbone gear transmissions. It enables designers to quantitatively assess the thermal safety margin under expected misalignment conditions and to guide the development of compensatory tooth modifications. Future work will focus on experimental validation through dedicated test rigs equipped with temperature and strain measurement capabilities to further corroborate the model’s predictions and refine its empirical parameters.