
Fatigue life assessment is an indispensable cornerstone in the design and validation of high-performance power transmission components. For spiral bevel gears, which are critical elements in aerospace, defense, and heavy-duty automotive applications, bending fatigue failure at the tooth root represents a primary mode of catastrophic failure. Traditional validation relies heavily on physical durability testing. However, conducting full-scale bending fatigue tests for spiral bevel gears is notoriously time-consuming, expensive, and yields limited data, leading to significant uncertainties in the design process and potentially conservative, overweight designs. This necessitates the development of robust methodologies that combine high-fidelity simulation with accelerated physical testing to efficiently and reliably predict service life. This article presents a comprehensive framework for evaluating the bending fatigue life of spiral bevel gears, integrating material characterization, detailed finite element analysis (FEA)-based life simulation, and accelerated testing protocols validated on a specialized rig.
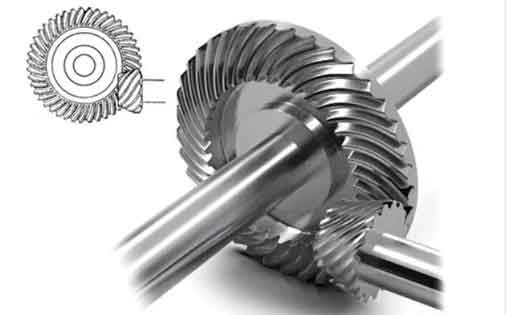
The core challenge in predicting the fatigue life of spiral bevel gears stems from their complex, spatially varying geometry and the resultant multi-axial, non-proportional stress states at the tooth root. The load sharing between multiple tooth pairs, influenced by the face contact pattern and machine settings, further complicates the stress history. While international standards like ISO 10300 provide calculation methods, they often rely on simplified models and empirical factors. Computational fatigue life simulation, based on transient stress results from finite element analysis and material S-N data, offers a powerful alternative. When coupled with a scientifically designed accelerated testing strategy, it enables a significant reduction in validation time and cost while providing high-confidence life predictions. The methodology detailed herein demonstrates this integrated approach, from fundamental material testing to final test correlation, specifically for case-hardened spiral bevel gears.
1. Material Characterization and S-N Curve Development
The accuracy of any fatigue life prediction is fundamentally tied to the quality of the material property data. For gear applications, the material’s response to cyclic loading is best characterized by its S-N (Stress vs. Number of cycles to failure) curve. In this study, the spiral bevel gears were manufactured from a high-strength, low-alloy case-hardening steel, analogous to SAE 9310 or 20CrNiMo. To establish a reliable material database, test coupons were extracted from the same batch of bar stock and subjected to identical heat treatment (carburizing, quenching, and tempering) as the actual spiral bevel gears.
Firstly, monotonic tensile tests were conducted to determine basic mechanical properties. The material exhibited a high ultimate tensile strength (UTS) with a mean value of approximately 1665 MPa, consistent with high-grade gear steels. The failure mode was predominantly brittle with minimal necking, indicative of a high-strength, case-hardened structure.
Subsequently, axial fatigue tests were performed on a high-frequency fatigue testing machine. A total of 18 polished specimens were tested under tension-tension loading with a stress ratio of R = 0.05. The testing followed a standard protocol to generate data points in both the low-cycle and high-cycle fatigue regimes. The failure origins were typically at surface inclusions or microstructural features, with fractures showing a characteristic pattern: a brittle, intergranular fracture in the high-hardness case region transitioning to a ductile, dimpled fracture in the softer core.
The raw fatigue data (stress amplitude, σ_a, vs. cycles to failure, N_f) was processed using statistical methods. For design purposes, an S-N curve with a specific survival probability (reliability) is required. The median S-N curve (50% survival probability) was first established by fitting the data to the Basquin equation:
$$ \sigma_a = \sigma_f’ (2N_f)^b $$
where \(\sigma_f’\) is the fatigue strength coefficient and \(b\) is the fatigue strength exponent (or Basquin exponent). A more conservative curve is needed for component life prediction. Assuming a statistical distribution (e.g., Weibull or Log-Normal) for life at a given stress, the S-N curve can be shifted downward to represent a higher reliability. For a spiral bevel gear with \(z\) teeth, if one tooth failure is considered a functional failure of the gear, the required survival probability for the gear tooth is \((z-1)/z\). For a pinion with 16 teeth, this corresponds to a 93.75% survival probability for an individual tooth. The material S-N data was thus analyzed to generate curves for both 50% and 93.75% reliability. The high-cycle fatigue strength at \(3 \times 10^6\) cycles for the 93.75% curve serves as a critical input for the subsequent simulation of the spiral bevel gears.
| Survival Probability | Fatigue Strength at N=3e6 (MPa) | Basquin Exponent (k or b) | Notes |
|---|---|---|---|
| 50% | ~884 | -0.03 (Example) | Median life estimate |
| 93.75% | ~795 | -0.03 (Assumed constant slope) | Design curve for gear tooth life prediction |
2. High-Fidelity Finite Element Modeling and Life Simulation
The bending fatigue life simulation of spiral bevel gears requires an accurate digital twin of the physical gear pair. The process involves three main stages: generation of a precise geometric model, performing a transient dynamic stress analysis, and executing a fatigue post-processing calculation.
2.1 Geometric Modeling and Meshing
The geometry of the spiral bevel gears is not defined by simple primitives but is generated based on the kinematic simulation of the manufacturing process (face-milling or face-hobbing). Using machine tool settings (cutter geometry, machine angles, ratios), a numerical tooth surface model is computed. Critically, the fillet profile is generated by the tool tip, ensuring an accurate representation of the stress-critical root region. The model for this study was based on a face-milled spiral bevel gearset with the following key parameters:
| Parameter | Pinion | Gear |
|---|---|---|
| Number of Teeth | 16 | 27 |
| Module (mm) | 4.25 | |
| Face Width (mm) | 17 | |
| Shaft Angle (°) | 90 | |
| Mean Spiral Angle (°) | 35 | |
| Hand of Spiral | Left | Right |
This numerical model was imported into a commercial FEA pre-processor. A sector model containing multiple teeth (typically 3-5 teeth on both gears) was created to account for load sharing. The meshing strategy is paramount: a globally fine mesh with significant local refinement in the tooth root fillet area. Second-order tetrahedral or hexahedral elements are recommended. A mesh sensitivity study was performed to ensure that the maximum principal stress in the fillet converged.
2.2 Transient Nonlinear Contact Analysis
A dynamic implicit analysis was set up to simulate one complete mesh cycle. The following conditions were applied:
- Material Model: Linear elastic, with E = 210 GPa and ν = 0.3.
- Contacts: Surface-to-surface contact pairs were defined between potentially engaging tooth flanks. A coefficient of friction (µ ≈ 0.05-0.10) was specified.
- Boundary Conditions: The pinion shaft was driven with a prescribed rotational velocity (e.g., 900 rpm). The gear shaft was constrained against rotation, and a constant braking torque (T2) was applied, representing the load. The magnitude of T2 was varied in different simulation runs to correlate with target fatigue life levels.
- Solution: The analysis solves for the stresses and deformations through small, incremental time steps as the teeth roll through contact.
The primary output of interest is the time-history of stress tensor components at every node in the model, particularly in the pinion tooth fillets. For bending fatigue, the maximum principal stress or the von Mises stress history at the root is typically extracted.
2.3 Fatigue Life Calculation
The stress histories from FEA and the material S-N curve are integrated within a fatigue analysis software (e.g., nCode DesignLife, FE-Safe). The process follows these steps:
- Input Stress: The transient stress solution from the FEA is loaded.
- Define Material Data: The 93.75% reliability S-N curve obtained from material testing is assigned to the gear components.
- Mean Stress Correction: The nominal S-N curve is usually for fully reversed loading (R=-1). The actual loading in gears is pulsating (R~0). Corrections using models like Gerber, Goodman, or Soderberg are applied:
$$ \sigma_{eq} = \frac{\sigma_a}{1 – \left(\frac{\sigma_m}{\sigma_u}\right)^2} \quad \text{(Gerber)} $$
$$ \sigma_{eq} = \frac{\sigma_a}{1 – \left(\frac{\sigma_m}{\sigma_u}\right)} \quad \text{(Goodman)} $$
where \(\sigma_{eq}\) is the equivalent fully reversed stress amplitude, \(\sigma_a\) is the applied stress amplitude, \(\sigma_m\) is the mean stress, and \(\sigma_u\) is the ultimate tensile strength. - Cycle Counting: The complex, non-proportional stress history is reduced to a set of stress reversals using a method like Rainflow counting.
- Damage Accumulation: Palmgren-Miner’s linear damage rule is applied to sum the fractional damage from each stress cycle:
$$ D = \sum_{i=1}^{k} \frac{n_i}{N_i} $$
where \(n_i\) is the number of cycles at a given stress level, and \(N_i\) is the life to failure at that level from the S-N curve. Failure is predicted when D ≥ 1. - Life Output: The software calculates and outputs a contour plot of life (in cycles) for the entire model. The node with the minimum predicted life identifies the most probable failure location and the predicted life of the component under the applied load.
By iterating this process with different applied torques (T2), a simulated S-N curve for the spiral bevel gear pair can be constructed. For instance, simulations were run targeting lives of \(1 \times 10^6\) and \(3 \times 10^6\) cycles. The corresponding root stresses were also calculated using the ISO 10300 standard for comparison.
| Target Life (Cycles) | Applied Gear Torque T2 (Nm) | FEA Max Principal Root Stress (MPa) | Predicted Life from Simulation (Cycles) | ISO 10300 Calculated Stress (MPa) |
|---|---|---|---|---|
| 1.0 × 10⁶ | 570 | 826.9 | ~1.0 × 10⁶ | 728.0 |
| 3.0 × 10⁶ | 499 | 745.5 | ~3.0 × 10⁶ | 637.3 |
3. Accelerated Fatigue Testing Methodology
Physical testing remains the ultimate validation. Accelerated life testing (ALT) aims to obtain life data in a fraction of the time required under normal operating conditions by testing at elevated stress levels. The core principle is the extrapolation of life from high-stress/short-life tests to lower-stress/long-life service conditions using a known damage model.
3.1 Theoretical Basis and Accelerated Factor
The S-N relationship in the high-cycle fatigue regime for metals is often described by a power law (Basquin’s equation), which appears as a straight line on a log-log plot:
$$ \sigma^m \cdot N = C \quad \text{or} \quad \log(\sigma) = \frac{1}{m} \log(C) – \frac{1}{m} \log(N) $$
This can be written as:
$$ \log(\sigma) = k \cdot \log(N) + b $$
where \(k = -1/m\) is the slope of the S-N line on a log-log scale.
Consider two stress levels, \(\sigma_x > \sigma_y\), corresponding to lives \(N_x\) and \(N_y\) respectively, lying on the same S-N line. From the equation above:
$$ \frac{\sigma_x}{\sigma_y} = \left( \frac{N_y}{N_x} \right)^{-k} = \left( \frac{N_x}{N_y} \right)^{k} $$
We define the stress acceleration factor, \(a\), as the ratio of the high test stress to the target service stress:
$$ a = \frac{\sigma_x}{\sigma_y} $$
Therefore, the relationship between the accelerated test life and the target life is:
$$ N_y = N_x \cdot a^{1/k} \quad \text{or conversely} \quad a = \left( \frac{N_y}{N_x} \right)^{-k} $$
If the slope \(k\) of the S-N curve is known (from material data or initial simulation), one can calculate the stress required to achieve a life of \(N_x\) in the test that corresponds to a desired service life \(N_y\). For example, to use a \(1 \times 10^6\)-cycle test to qualify a \(3 \times 10^6\)-cycle life target, the acceleration factor is:
$$ a = \left( \frac{3 \times 10^6}{1 \times 10^6} \right)^{-k} = 3^{-k} $$
3.2 Application to Spiral Bevel Gears and Test Design
For the spiral bevel gears in this study, the slope \(k\) was derived from the simulation S-N curve (using either FEA or ISO stress). Using a value of \(k \approx -0.12\), the acceleration factor for a 3x life acceleration is:
$$ a = 3^{-(-0.12)} = 3^{0.12} \approx 1.15 $$
This means testing at a stress level about 15% higher than the nominal service stress should theoretically produce failures in 1/3 of the target service life cycles. In terms of torque, since bending stress is approximately proportional to applied torque, the test torque can be increased by the same factor.
Thus, the accelerated test protocol was defined as:
- Level 1 (Accelerated): Test at Torque T2 = 570 Nm, target observed life ~\(1 \times 10^6\) cycles.
- Level 2 (Validation): Test at the nominal torque T2 = 499 Nm, expecting life ≥ \(3 \times 10^6\) cycles.
The tests were conducted on a mechanical closed-loop (closed power flow) spiral bevel gear test rig. This type of rig uses a circulating power system, requiring only enough motor power to overcome losses, making it energy-efficient for long-duration durability tests. The test gears were mounted in a stiff housing, and the contact pattern was carefully set to a predefined optimal location before testing. A run-in procedure under progressively increasing loads was performed to stabilize the contact pattern and wear-in the surfaces. Testing was conducted under controlled lubrication with a dedicated gear oil.
4. Integration of Results and Correlation
The final step is to correlate the simulation predictions with the accelerated and validation test results. Multiple spiral bevel gear sets were tested at both torque levels.
At the accelerated level (570 Nm): The test gears failed by classical tooth bending fatigue. The fracture origin was consistently at the root fillet on the pinion, towards the heel end. The recorded lives clustered around \(1.27 \times 10^6\) cycles, which was in excellent agreement with the simulation target of \(1.0 \times 10^6\) cycles (well within typical statistical scatter for fatigue data).
At the nominal level (499 Nm): Testing at this lower stress level produced failures at an average life of approximately \(3.48 \times 10^6\) cycles. This validated the core premise: the life at the lower stress was indeed roughly three times longer than at the accelerated stress, following the S-N power law. Furthermore, the predicted life from the simulation for this torque level was \(3.0 \times 10^6\) cycles, showing a high degree of correlation with the physical test (a difference of about 16% in life, which is considered very good in fatigue analysis).
| Test Condition | Applied Torque (Nm) | Simulation Predicted Life (Cycles) | Average Tested Life (Cycles) | Error / Scatter | Comments |
|---|---|---|---|---|---|
| Accelerated | 570 | 1.00 × 10⁶ | 1.27 × 10⁶ | +27% | Within expected statistical scatter. |
| Nominal / Validation | 499 | 3.00 × 10⁶ | 3.48 × 10⁶ | +16% | Excellent correlation, validates the S-N slope and method. |
The stress values deduced from the tests, when plotted against cycles, formed an S-N curve whose slope was consistent with the one used for designing the accelerated test. The successful prediction of failure location (pinion root at the heel) also confirmed the accuracy of the finite element model in capturing the critical stress concentration.
5. Discussion and Implications
The integrated framework presented—material S-N data generation, high-fidelity FEA-based fatigue simulation, and physics-based accelerated testing—provides a robust and efficient pathway for evaluating the bending fatigue performance of spiral bevel gears. The key advantages are:
- Reduced Testing Time and Cost: The ability to derive a 3 million-cycle design life from a 1 million-cycle test represents a significant acceleration factor, reducing test duration and associated costs by more than half.
- Enhanced Design Insight: The simulation pinpoints the exact failure location and reveals the complete stress history, offering insights that are difficult to obtain from testing alone. This can guide design improvements in fillet geometry, case depth, or shot peening treatment.
- Quantitative Reliability: By basing the simulation on a statistically derived high-reliability material S-N curve, the life prediction incorporates probabilistic margins, moving beyond deterministic safe-life approaches.
- Methodology Generalizability: While demonstrated on a specific spiral bevel gearset, the approach is universally applicable to other gear types and complex mechanical components subject to fatigue.
A critical consideration is the assumption of a constant S-N slope from the accelerated to the nominal regime. For high-strength steels in the high-cycle regime, this is generally valid. However, for very high cycles or in the presence of material discontinuities, a fatigue limit or a change in slope (duplex S-N curve) might need to be considered. Furthermore, the linear Palmgren-Miner rule, while practical, has known limitations for variable amplitude loading; for spectrum loading analysis, more sophisticated non-linear damage accumulation models may be integrated into the framework.
6. Conclusion
This work has detailed a comprehensive and validated methodology for assessing the bending fatigue life of spiral bevel gears. The process begins with the foundational step of characterizing the gear material through coupon testing to obtain statistically significant S-N curves. This material data is then used within a high-fidelity computational workflow, where a precise finite element model of the spiral bevel gears undergoes transient contact analysis to determine the tooth root stress history. A fatigue post-processor synthesizes this stress history with the material properties to predict component life. Crucially, the slope of the resulting gear S-N curve enables the design of scientifically grounded accelerated life tests. By testing at an elevated stress level defined by a calculated acceleration factor, long-service life requirements can be validated in a fraction of the time.
The close correlation achieved between the simulated life predictions and the physical test results—for both accelerated and nominal load levels—confirms the validity and accuracy of this integrated approach. For engineers developing critical applications involving spiral bevel gears, such as in aerospace transmissions or advanced vehicular drivetrains, this methodology offers a powerful tool to reduce development cycle times, optimize designs with greater confidence, and ensure structural reliability while mitigating the traditional burdens of extensive physical prototyping and testing. The future lies in further refining these digital tools and integrating them with advanced manufacturing process simulations and real-time condition monitoring data for even more predictive and resilient engineering of spiral bevel gears and similar complex components.