
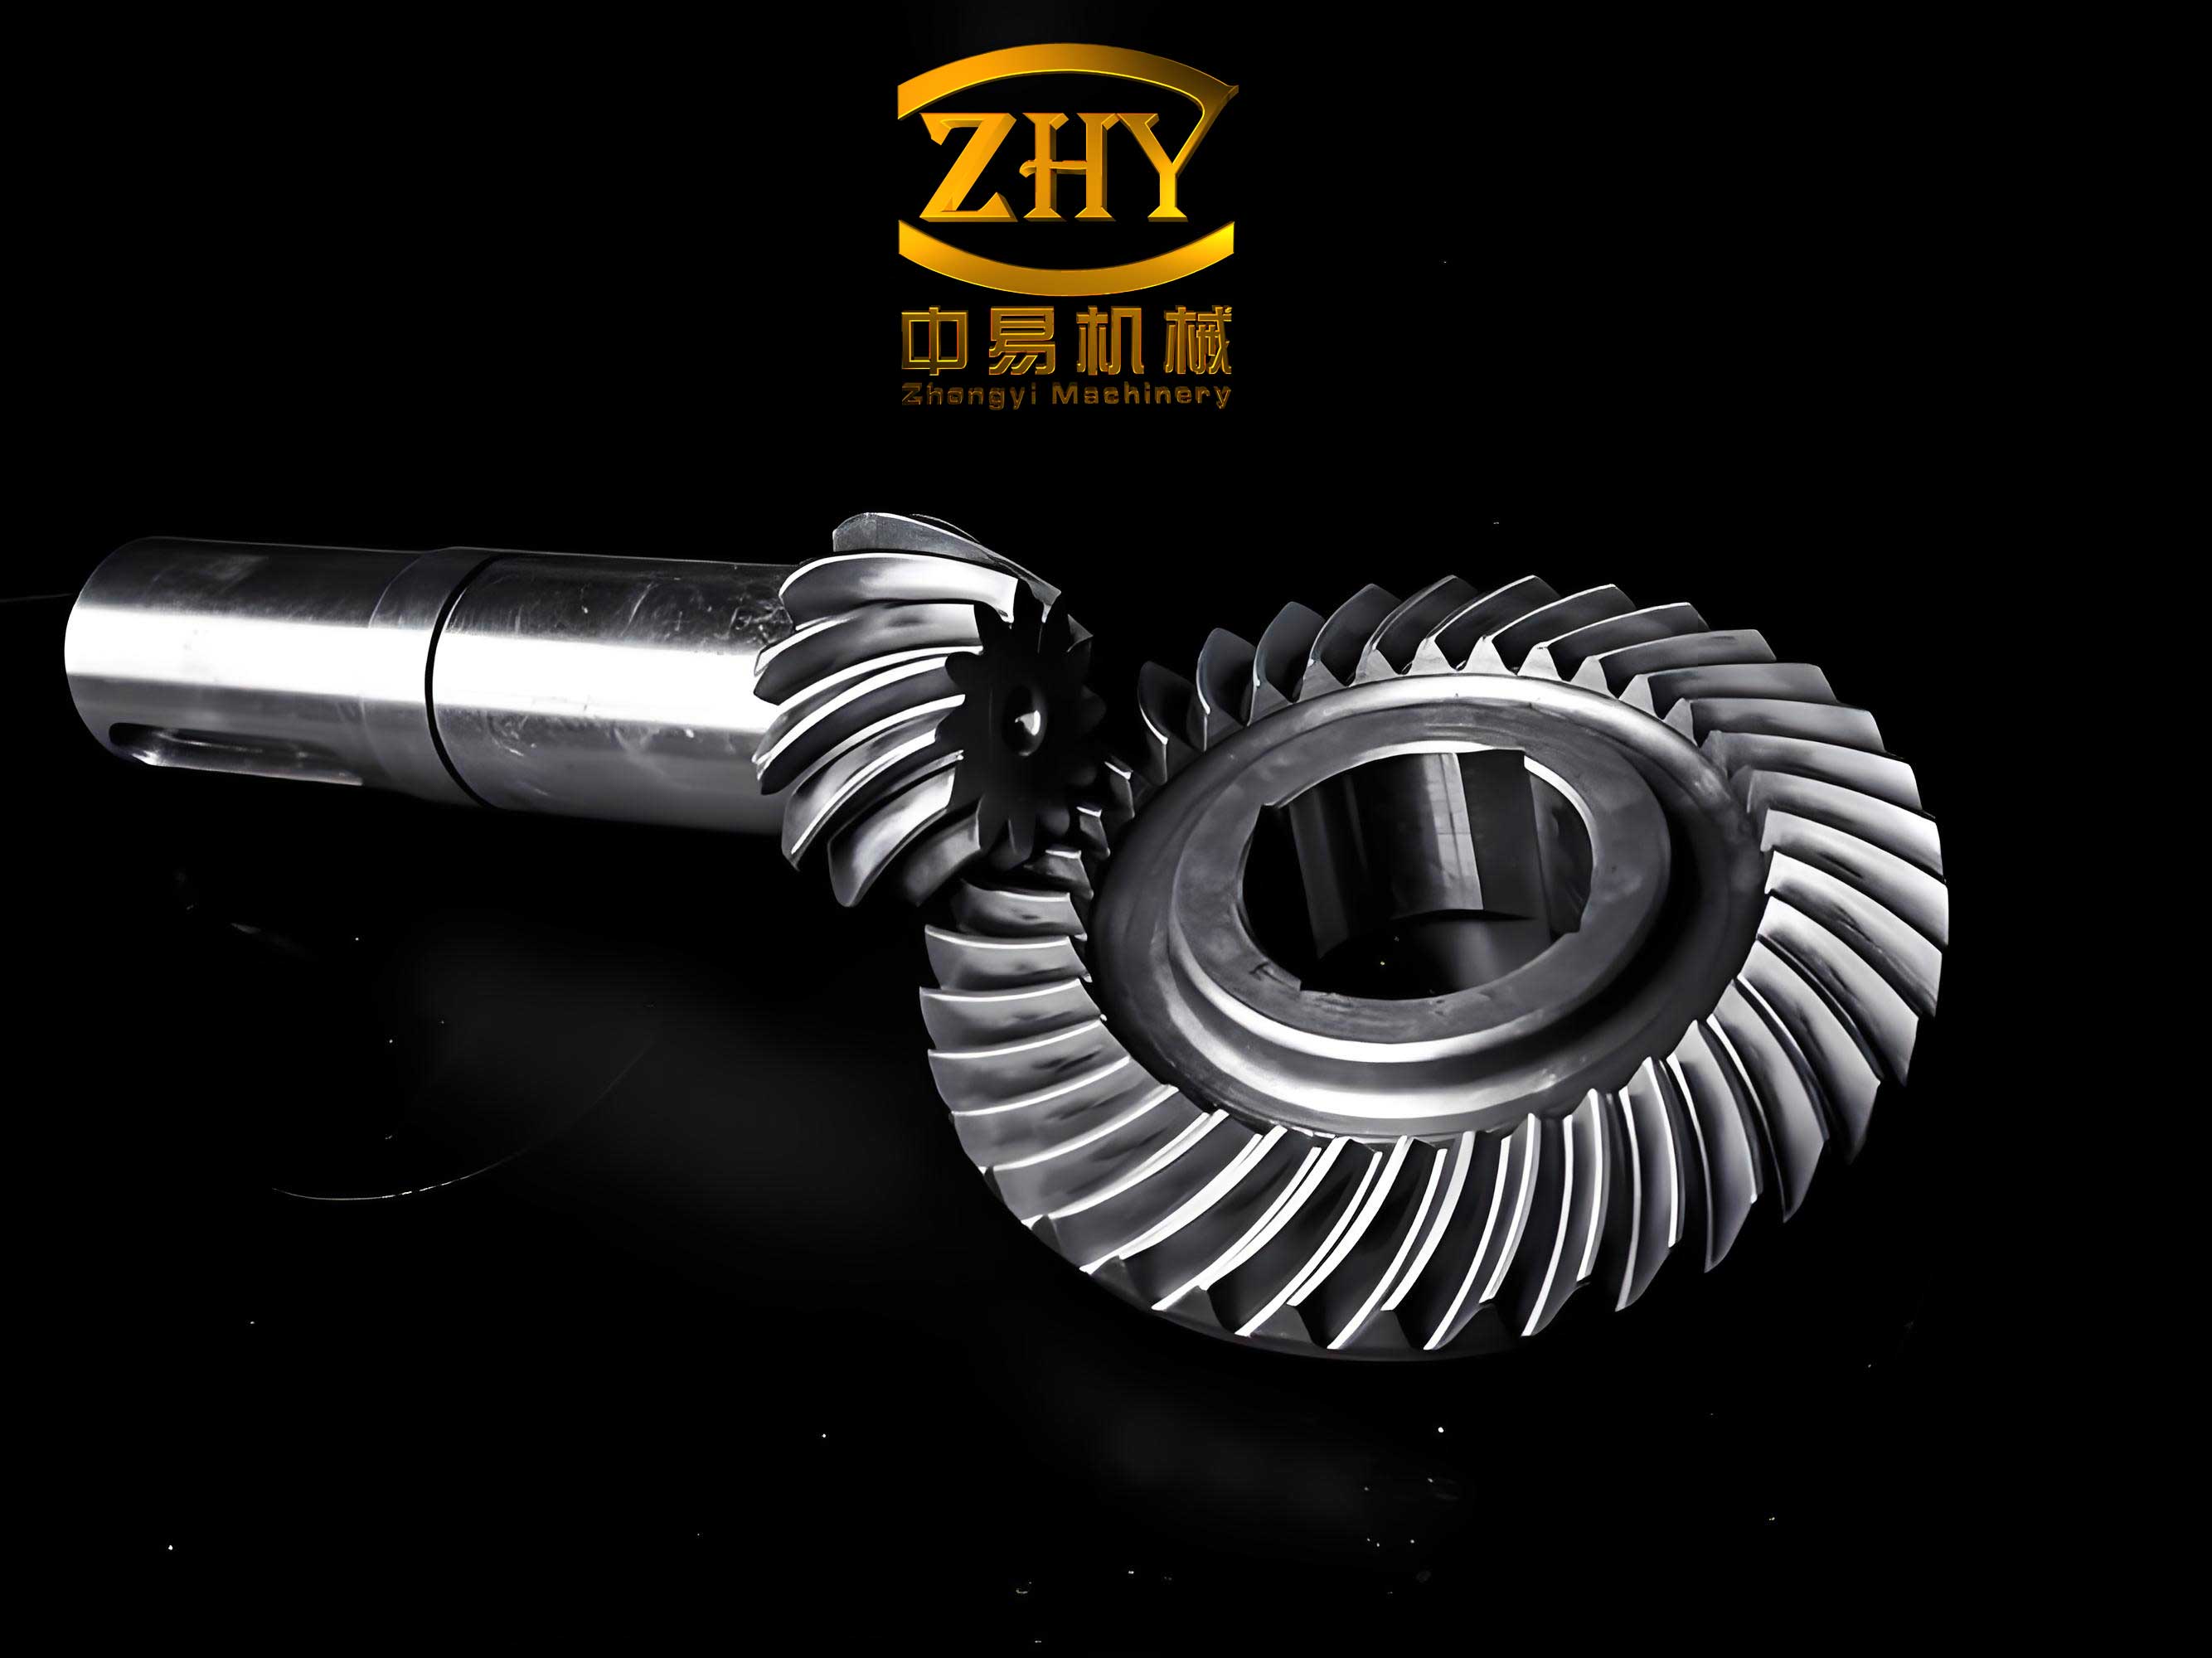
In mechanical transmission systems, spiral bevel gears are critical components due to their high load capacity, smooth operation, and increased overlap ratio. These gears are extensively used in aerospace, automotive, and heavy machinery applications. The performance and longevity of spiral bevel gears are heavily influenced by the tooth contact pattern, which is the area where mating teeth interact under load. The location of this contact area—whether near the toe, heel, or center of the tooth—can significantly affect the distribution of contact stress and root bending stress, ultimately impacting gear life and reliability. In this study, I investigate how varying the contact area location along the tooth face of spiral bevel gears influences their working stresses through computational modeling and finite element analysis. By systematically adjusting the contact pattern and analyzing the resultant stress histories, I aim to provide insights for optimizing gear design and assembly to enhance performance.
The tooth surface of a spiral bevel gear is complex and non-developable, requiring precise mathematical modeling for accurate analysis. I begin by deriving the tooth surface geometry based on the generating principle of spiral bevel gears. Using MATLAB software, I programmed an algorithm to compute the coordinates of grid points on both the pinion and gear tooth surfaces. The discretization density was set at 0.1 mm × 0.1 mm to ensure high fidelity in the geometric representation. The basic geometric parameters of the spiral bevel gear pair used in this study are summarized in Table 1.
| Parameter | Pinion | Gear |
|---|---|---|
| Number of teeth, z | 16 | 27 |
| Module at large end (mm) | 4.25 | 4.25 |
| Pressure angle (°) | 20 | 20 |
| Mean spiral angle (°) | 35 | 35 |
| Face width (mm) | 17 | 17 |
| Outer cone distance (mm) | 66.6925 | 66.6925 |
| Pitch cone angle (°) | 30.65 | 59.35 |
| Face cone angle (°) | 35.89 | 62.77 |
| Root cone angle (°) | 27.23 | 54.11 |
The machining parameters for generating the spiral bevel gear teeth, including machine tool settings and cutter geometry, are provided in Table 2. These parameters are essential for replicating the exact tooth surface topography in the modeling process.
| Parameter | Gear | Pinion (Concave) | Pinion (Convex) |
|---|---|---|---|
| Blank inclination angle (°) | 54.08 | 27.26 | 27.26 |
| Machine center to back (mm) | 0 | -0.494 | 0.176 |
| Vertical offset (mm) | 0 | 2.400 | -2.752 |
| Horizontal offset (mm) | 0 | 1.077 | -0.383 |
| Angular cutter position (mm) | 77.149 | -82.642 | -68.965 |
| Radial cutter position (mm) | 64.026 | 69.492 | 59.042 |
| Cutter radius (mm) | 76.20 | 80.69 | 72.43 |
| Ratio of roll | 1.157 | 2.028 | 1.902 |
| Cutter pressure angle (°) | 18 / -22 | 18 | -22 |
The computed point cloud from MATLAB is imported into UG NX software to construct a precise three-dimensional solid model of the spiral bevel gear pair. In UG, I assemble the pinion and gear according to their theoretical mounting positions. To simulate the rolling test and visualize the contact pattern, I apply assembly constraints aligning the gear axes with a reference coordinate system and set a slight interference distance of 0.006 mm between the mating tooth surfaces, representing the thickness of the marking compound used in physical tests. The contact pattern observed in this initial assembly is considered the “central” contact location. Subsequently, I adjust the contact area towards the toe and heel of the tooth by modifying the relative positions of the gears along the vertical (V), horizontal (H), and axial (J) directions, as per the V/H rolling test methodology. The adjustment displacements for achieving toe, central, and heel contact areas are listed in Table 3.
| Contact Area Location | V Adjustment (mm) | H Adjustment (mm) | J Adjustment (mm) |
|---|---|---|---|
| Toe | -0.15 | +0.05 | -0.02 |
| Central | 0 | 0 | 0 |
| Heel | +0.15 | -0.05 | +0.02 |
These adjustments shift the contact ellipse path by approximately one-quarter of the face width towards the desired end. The resulting three assembly configurations—with contact areas predominantly at the toe, center, and heel—are then prepared for finite element analysis. The complexity of spiral bevel gear tooth geometry necessitates advanced simulation techniques to evaluate stress distributions under dynamic loading conditions.
To perform transient dynamic analysis, I export the three UG assembly models to ANSYS Workbench. For computational efficiency, each model is simplified by retaining only five teeth on both the pinion and gear, ensuring at least one complete meshing cycle is captured. Each tooth is partitioned into six volumes to facilitate high-quality hexahedral meshing. The finite element model setup involves defining material properties—typically alloy steel with a Young’s modulus of 210 GPa and Poisson’s ratio of 0.3—and generating a mesh using the multi-zone sweeping method. This approach yields predominantly hexahedral elements, which provide better accuracy and convergence for contact problems. The final mesh contains approximately 272,628 nodes and 61,996 elements, with local refinement at the tooth fillets to capture stress gradients accurately.
Contact pairs are established between all tooth surfaces of the pinion and gear, with a frictional coefficient of 0.03. Revolute joints are applied to the inner cylindrical surfaces of both gears to simulate rotation. The pinion is assigned a rotational velocity of 150 rpm (equivalent to 15.708 rad/s), while the gear is subjected to a constant torque of 170 N·m. The transient analysis is configured for a duration of 0.1 seconds with 100 time steps, allowing observation of stress variations throughout the engagement period. The output variables include equivalent (von Mises) stress on the tooth surface for contact stress evaluation and on the pinion’s concave-side tooth root for bending stress assessment.
The contact stress distribution on the pinion tooth surface for the three contact area locations is visualized through contour plots at the time step of maximum loading. Qualitatively, the stress concentration follows the contact ellipse pattern. To quantify the differences, I extract the time-history of maximum contact stress and root bending stress from the third pinion tooth, which experiences the most severe loading during the analyzed cycle. The stress values over 20 consecutive time points around the peak engagement are compiled and plotted. The statistical measures—maximum value, range (amplitude), mean, and standard deviation—are calculated for both stress types and each contact location, as summarized in Table 4.
| Stress Type | Contact Location | Maximum (MPa) | Amplitude (MPa) | Mean (MPa) | Standard Deviation (MPa) |
|---|---|---|---|---|---|
| Contact Stress | Toe | 714.42 | 179.96 | 615.09 | 44.95 |
| Central | 709.33 | 223.03 | 603.26 | 68.55 | |
| Heel | 799.47 | 194.52 | 677.75 | 66.05 | |
| Bending Stress | Toe | 199.99 | 53.53 | 177.64 | 16.97 |
| Central | 204.66 | 75.28 | 167.66 | 27.18 | |
| Heel | 208.88 | 34.73 | 196.01 | 10.84 |
The data reveals distinct trends. For contact stress, the heel contact condition produces the highest mean and maximum stresses (677.75 MPa and 799.47 MPa, respectively), indicating a less favorable load distribution. The central contact yields the lowest mean contact stress (603.26 MPa), while the toe contact shows a slightly higher mean (615.09 MPa) but the smallest standard deviation (44.95 MPa), suggesting more stable stress fluctuations over time. For bending stress at the tooth root, the heel contact again results in the highest mean stress (196.01 MPa), whereas the central contact gives the lowest mean (167.66 MPa). The toe contact exhibits the lowest maximum bending stress (199.99 MPa) and the smallest amplitude (53.53 MPa), denoting a relatively steady bending stress history.
To interpret these results, I consider the mechanical behavior of spiral bevel gears. The contact stress is related to the Hertzian contact pressure, which depends on the local curvature of the contacting surfaces and the applied load. The general Hertzian contact stress formula for two curved bodies can be expressed as:
$$ \sigma_H = \sqrt{ \frac{F}{\pi} \cdot \frac{1}{ \left( \frac{1-\nu_1^2}{E_1} + \frac{1-\nu_2^2}{E_2} \right) } \cdot \frac{1}{ \rho } } $$
where \( F \) is the normal load per unit width, \( \nu \) and \( E \) are Poisson’s ratio and Young’s modulus, and \( \rho \) is the equivalent radius of curvature. In spiral bevel gears, the radius of curvature varies along the tooth profile and length. When the contact area is near the heel (large end), the teeth are thicker and have a larger radius of curvature, but the contact ellipse may be located in a region with higher sliding velocities and less favorable conformity, leading to elevated contact pressures. Conversely, near the toe (small end), the teeth are thinner and more compliant, allowing for better load sharing and damping of impacts, which can reduce peak stresses and fluctuations.
The bending stress at the tooth root is governed by the cantilever beam theory, modified for gear geometry. The nominal bending stress can be estimated using the Lewis formula:
$$ \sigma_b = \frac{F_t}{b m_n} \cdot Y $$
where \( F_t \) is the tangential load, \( b \) is the face width, \( m_n \) is the normal module, and \( Y \) is the Lewis form factor. However, for spiral bevel gears, the load distribution along the face width is non-uniform due to the spiral angle and contact pattern. A contact area biased towards the heel places the highest bending moment arm at the thicker root section near the large end, potentially increasing bending stress. Meanwhile, a toe-biased contact area loads the thinner root section near the small end, but the lower stiffness there might allow more deflection and stress redistribution, resulting in lower peak bending stresses as observed.
The standard deviation of the stress histories is a key indicator of dynamic stability. Lower standard deviation implies smoother stress variation, which is beneficial for fatigue life. For contact stress, the toe contact shows the smallest standard deviation (44.95 MPa), indicating the most stable contact conditions. For bending stress, the heel contact has the smallest standard deviation (10.84 MPa), but this comes with a higher mean stress, which could be detrimental. The central contact exhibits higher fluctuations in both stress types, as seen from its larger standard deviations.
Combining these observations, I conclude that while the central contact area location provides the lowest mean contact stress, the toe contact offers a better compromise with relatively low mean stresses and significantly reduced stress fluctuations. This is particularly important for spiral bevel gears operating under dynamic loads, where stress cycles and impact forces can accelerate fatigue failure. The toe contact location leverages the flexibility of the thin tooth end to absorb shocks and distribute load more evenly over time. Furthermore, from a kinematic perspective, the toe region has a smaller pitch diameter, resulting in lower sliding velocities and potentially less wear and heat generation.
In practical applications, spiral bevel gears are often assembled with a slight bias of the contact pattern towards the toe to account for deflections under load. Under light loads, the contact ellipse is near the toe; as load increases, tooth bending and shaft deflections cause the contact to shift toward the center, optimizing the load distribution across the full face width. This study computationally validates that practice, showing that a toe-biased contact area indeed creates a more favorable stress environment. It is worth noting that extreme toe contact might risk edge loading at the thin end, so a moderate shift from the center towards the toe is recommended.
To further generalize these findings, I can express the relationship between contact area position and working stress through a dimensionless parameter, such as the contact offset ratio \( \zeta \), defined as the distance from the tooth center to the contact ellipse center normalized by the face half-width. Then, the mean contact stress \( \bar{\sigma}_c \) and mean bending stress \( \bar{\sigma}_b \) might be approximated by quadratic functions:
$$ \bar{\sigma}_c = a_0 + a_1 \zeta + a_2 \zeta^2 $$
$$ \bar{\sigma}_b = b_0 + b_1 \zeta + b_2 \zeta^2 $$
where \( \zeta \) is negative for toe bias and positive for heel bias. The coefficients \( a_i \) and \( b_i \) depend on gear geometry, load, and material. From my data, \( \bar{\sigma}_c \) is minimized near \( \zeta = 0 \) (central) but increases more steeply for heel bias (\( \zeta > 0 \)), while \( \bar{\sigma}_b \) shows a minimum at a slightly negative \( \zeta \) (toe bias). This illustrates the trade-off and supports the optimal range being slightly toe-biased.
In summary, this investigation demonstrates the significant influence of contact area location on the working stresses of spiral bevel gears. Through detailed modeling and transient finite element analysis of three distinct contact patterns, I have quantified the differences in contact and bending stress histories. The results consistently show that a contact area positioned slightly towards the toe of the tooth provides lower stress fluctuations and a good balance between contact and bending stresses, leading to improved dynamic performance and potential for extended service life. These insights can guide the assembly adjustment and design modification of spiral bevel gears in various high-power transmission systems, ensuring reliability and efficiency. Future work could explore the effects of different load levels, misalignments, and surface modifications on the contact behavior and stress states of spiral bevel gears.