
In engineering practice, a significant proportion of component failures, ranging from 50% to 90%, are attributed to material fatigue. For involute cylindrical gears, a primary and common mode of failure is contact fatigue, manifested as pitting, which predominantly occurs near the pitch line on the dedendum side of the tooth flank. Traditional design methodologies for power transmission components like gear shafts often rely on static strength and stiffness checks. However, in real-world applications, it is not uncommon for a gear shaft to meet all static design criteria yet fail prematurely due to fatigue, resulting in a service life far shorter than its theoretically calculated lifespan. This discrepancy underscores the critical need for a more comprehensive analysis that integrates dynamic loading conditions with detailed contact mechanics and fatigue life prediction.
This analysis presents a robust, multidisciplinary simulation framework for evaluating the contact fatigue performance of a critical gear shaft assembly. The methodology synergistically combines several powerful engineering software tools: Pro/E for precise geometric modeling, MATLAB for data processing and curve fitting, ADAMS for multibody dynamics simulation under realistic operating conditions, and ANSYS for advanced nonlinear finite element analysis (FEA) and fatigue life calculation. The core objective is to extract accurate dynamic loading from a virtual prototype of the complete system, apply it to a high-fidelity finite element model of the contacting gear teeth, identify stress concentrations and weak points through static contact analysis, and finally, predict the gear shaft’s fatigue life based on the calculated stress history.
1. Development of the Three-Dimensional Gear Shaft Model
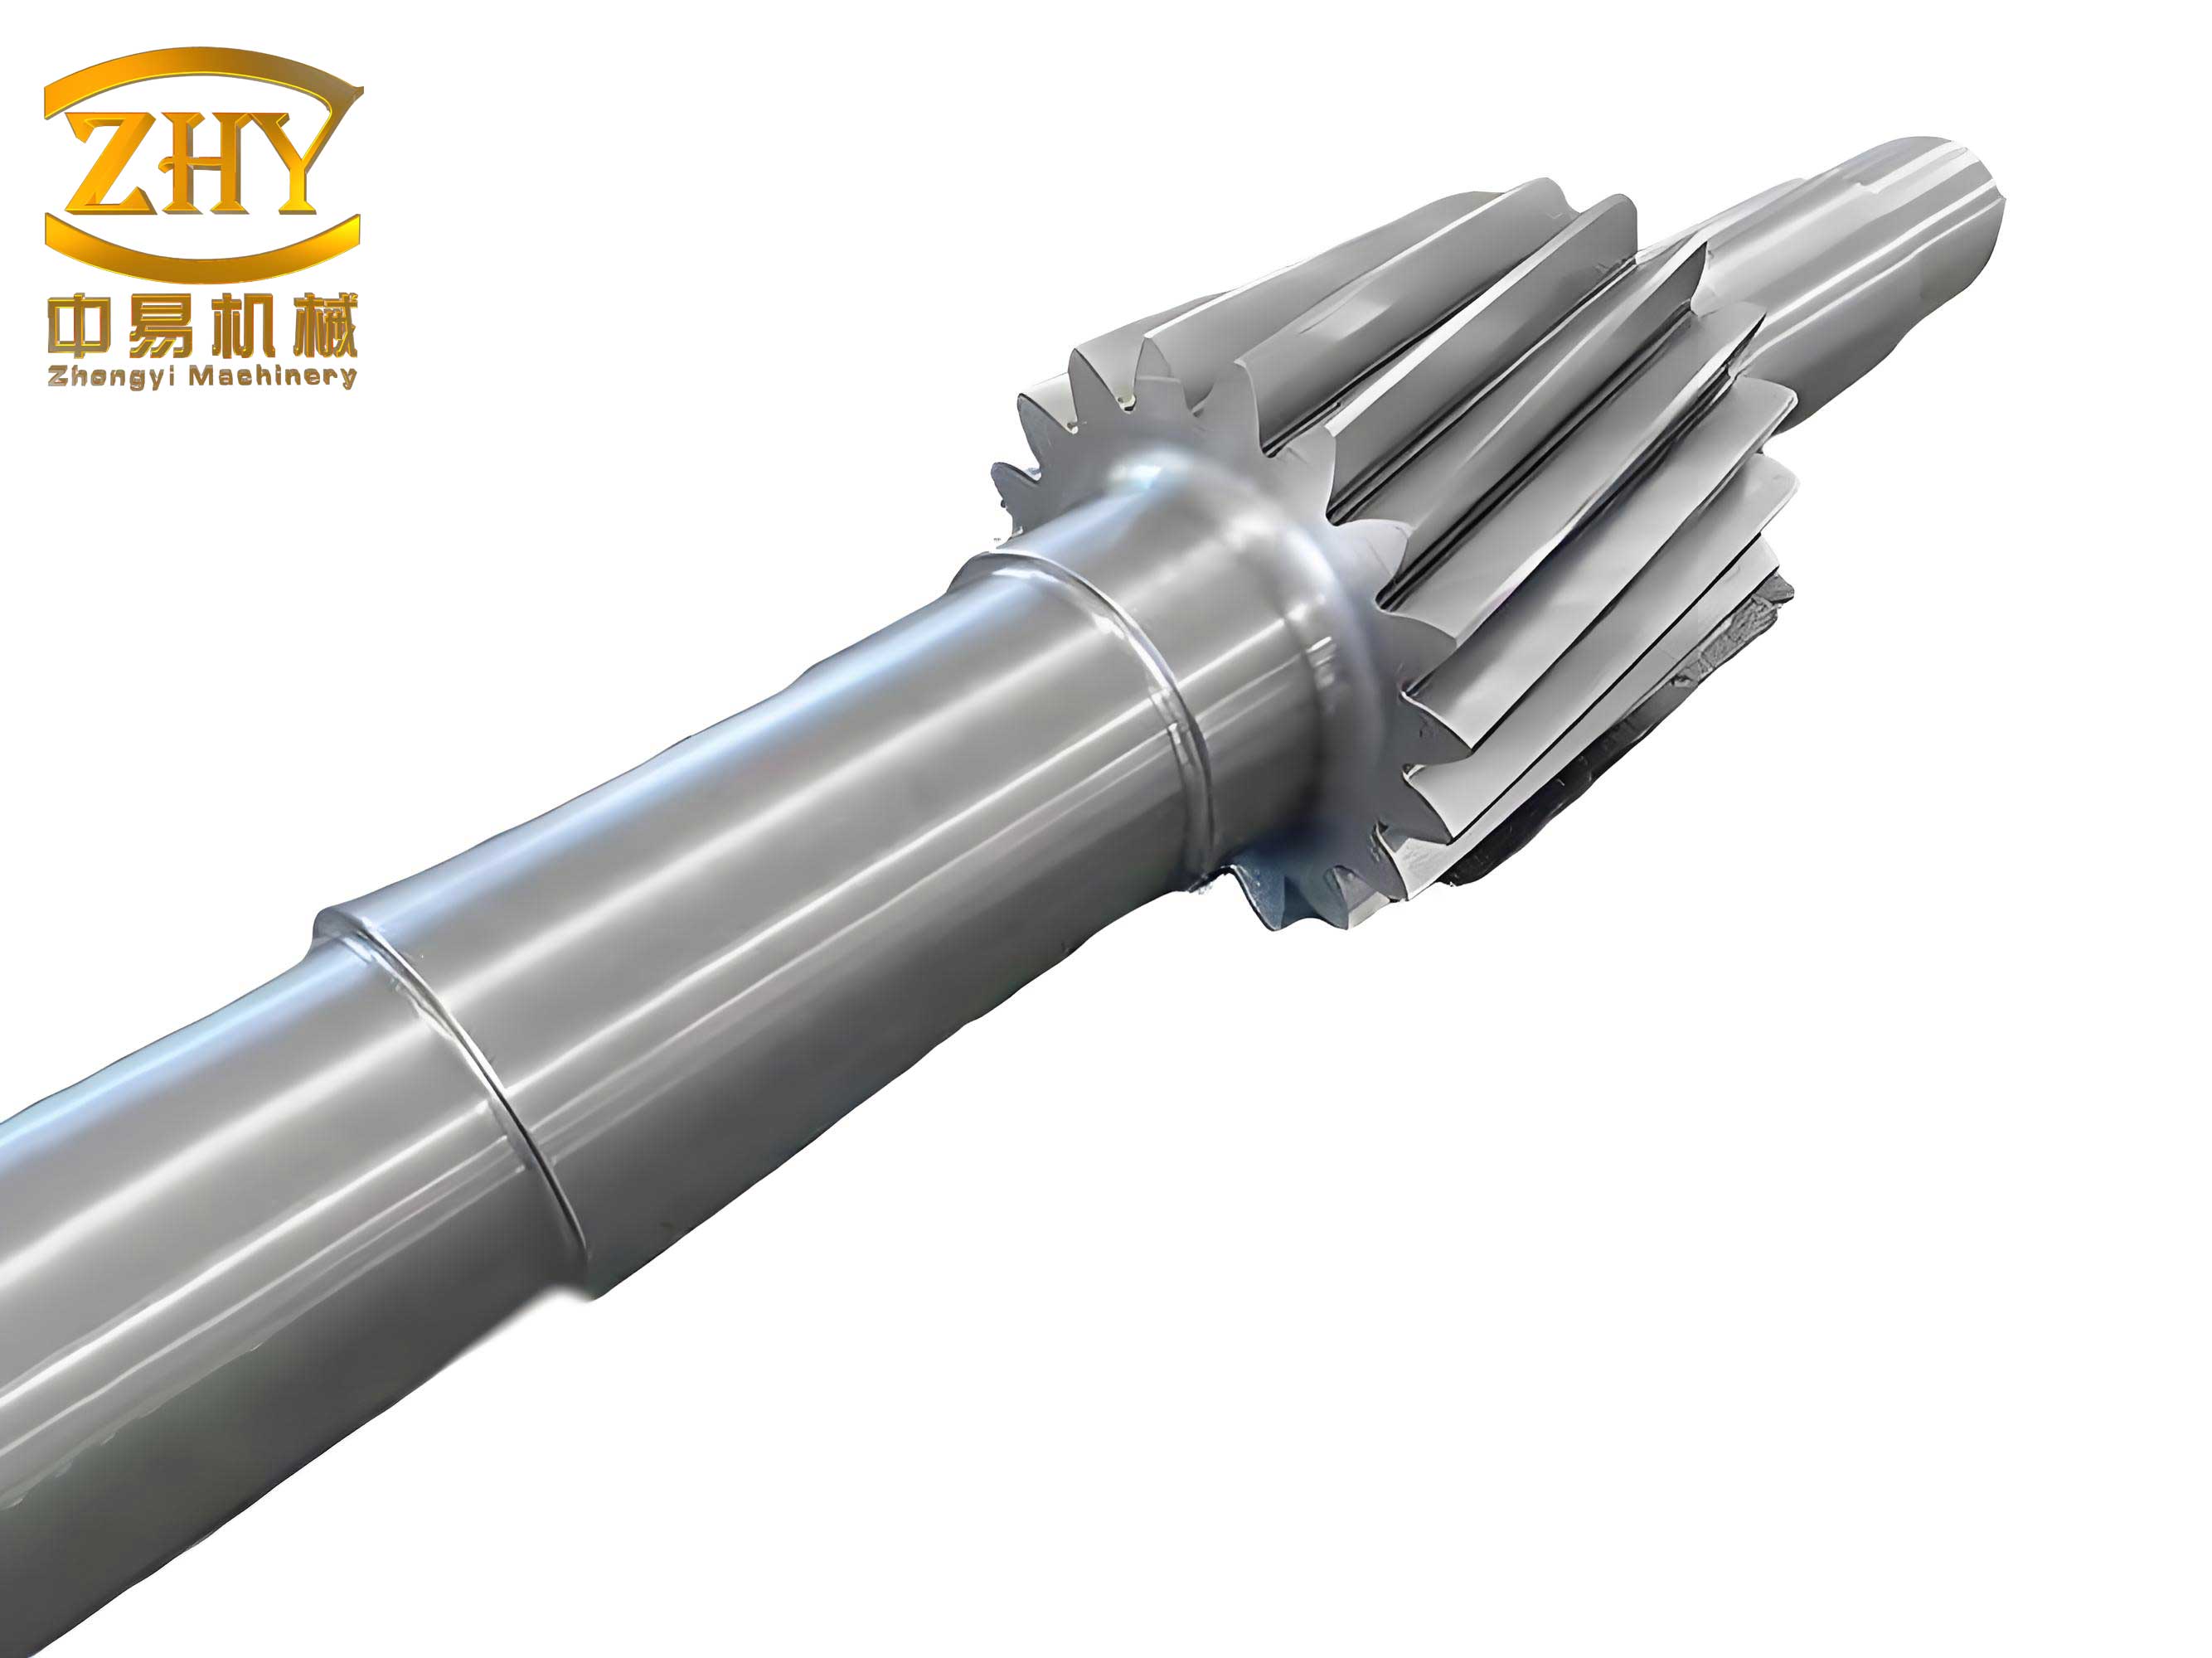
The foundation of any accurate finite element analysis is a geometrically precise model. The three-dimensional solid model of the gear shaft and its mating pinion is constructed in Pro/E based on fundamental gear design parameters. These parameters are summarized in the table below:
| Parameter | Symbol | Value/Description |
|---|---|---|
| Number of Teeth (Gear) | z | Design-specific |
| Number of Teeth (Pinion) | z_p | Design-specific |
| Module | m | Design-specific |
| Pressure Angle | α | 20° (typical) |
| Addendum Coefficient | h_a* | 1.0 (standard) |
| Dedendum Coefficient | h_f* | 1.25 (standard) |
| Profile Shift Coefficient | x | As per design |
| Face Width | w | Design-specific |
| Center Distance | a | Calculated |
The completed gear pair assembly model is shown conceptually. However, contact analysis is computationally intensive due to its highly nonlinear nature. To achieve an efficient yet mechanically representative simulation, the model is judiciously simplified according to Saint-Venant’s principle. A quarter-symmetry model is adopted, which significantly reduces the number of elements and computational cost while preserving the essential stress state in the critical contact region of the gear shaft.
2. Static Contact Analysis of the Gear Shaft Assembly
The simplified 3D model is seamlessly imported into ANSYS via a dedicated interface, preserving geometric integrity. The subsequent static contact analysis follows a systematic procedure to ensure accuracy and convergence.
2.1 Element Properties and Material Definition
The gear shaft and pinion are meshed with SOLID185 elements, an 8-node brick element suitable for plasticity, creep, large deflection, and large strain analyses. The material properties for the alloy steel gear shaft are defined as follows:
$$ E = 210 \, \text{GPa}, \quad \nu = 0.3, \quad \rho = 7850 \, \text{kg/m}^3 $$
The contact interface is modeled using a surface-to-surface contact pair. The gear tooth flank is defined as the “contact” surface using CONTA174 elements, while the mating pinion tooth flank is defined as the “target” surface using TARGE170 elements. A coefficient of friction, $\mu$, is specified for the interface.
2.2 Meshing Strategy
A balance between computational accuracy and cost is achieved through a strategic meshing plan. Areas anticipated to have high-stress gradients, namely the contact region on the tooth flanks and the fillet regions at the root of the gear shaft teeth, are seeded with a finer, denser mesh. Conversely, regions with relatively uniform stress are meshed more coarsely. This graded mesh ensures solution accuracy where it matters most without unnecessary computational overhead.
2.3 Defining Contact Pairs
Potential contact zones are identified on the gear shaft and pinion teeth. For a typical spur gear engagement, especially under load, two pairs of teeth are often in contact. Corresponding contact pairs are established in ANSYS using the contact wizard, ensuring proper kinematic interaction between the gear shaft and its counterpart during the simulation.
2.4 Applying Dynamic Loads and Boundary Conditions
This step is crucial for realism. The driving torque for the gear shaft is not an assumed constant value but is extracted from a dynamic simulation of the complete shearer cutting arm system. A multibody dynamics model of the transmission chain, from the 1000 kW cutting motor to the output gear shaft, is built in ADAMS. The model simulates a demanding operational scenario: cutting tough coal with a Protodyakonov strength coefficient of 3.11 at a haulage speed of 8 m/min.
From this dynamic simulation, the time-history of the normal force on the gear shaft teeth is obtained. The peak value of this force is used for the static worst-case analysis. The relationship between the transmitted torque $T$ and the tangential force $F_t$ on the gear shaft is:
$$ F_t = \frac{2T}{d} $$
where $d = m z$ is the pitch diameter. The normal force $F_n$ is related to the tangential force by the pressure angle:
$$ F_n = \frac{F_t}{\cos \alpha} $$
Applying a pure rotational moment in a static analysis using solid elements (which lack rotational degrees of freedom) requires a technique. The node coordinate systems on the inner bore surface of the driving gear shaft are rotated to a cylindrical coordinate system. The total driving torque $M$ is then applied as an equivalent set of tangential forces $F_Y$ on each node $i$ on that surface:
$$ F_{Y,i} = \frac{M}{r_0 \times N} $$
where $r_0$ is the inner bore radius and $N$ is the total number of nodes on the loaded surface. This creates the net driving moment on the gear shaft. Appropriate constraints are applied to the pinion hub and the gear shaft’s bore to prevent rigid body motion, replicating the reaction conditions.
2.5 Results of the Static Contact Analysis
The nonlinear contact problem is solved using the Newton-Raphson iterative scheme, and the solution convergence is monitored. The analysis successfully converges, revealing the stress distribution. The maximum von Mises stress is located at the contact region between the meshing teeth, validating the model’s setup. Due to the integrated design of the component (a gear with an integral shaft/spline), a stress concentration also appears at the transition between the gear body and the shaft spline on the gear shaft. The computed maximum von Mises stress $\sigma_{vM}^{max}$ is compared to the material’s yield strength $\sigma_y$.
For the analyzed gear shaft material with $\sigma_y = 835 \, \text{MPa}$, the calculated $\sigma_{vM}^{max} = 522.3 \, \text{MPa}$. The static safety factor $SF_{static}$ is:
$$ SF_{static} = \frac{\sigma_y}{\sigma_{vM}^{max}} \approx \frac{835}{522.3} \approx 1.60 $$
This confirms that the gear shaft assembly satisfies the static strength requirement under the peak dynamic load condition.
3. Fatigue Life Assessment of the Gear Shaft
Fatigue failure occurs under the cyclic application of stresses below the ultimate tensile strength. The stress-life (S-N) approach, based on Palmgren-Miner’s linear damage accumulation rule, is employed within ANSYS Fatigue Tool to predict the life of the gear shaft.
3.1 Generating the Material S-N Curve
The fatigue life calculation requires the S-N curve for the gear shaft material. Given the material’s ultimate tensile strength $\sigma_u = 1175 \, \text{MPa}$ and its fatigue strength $\sigma_f’ = 438 \, \text{MPa}$ at $N=10^7$ cycles (mean value), a probabilistic P-S-N curve is used for higher reliability. For a survival probability of 99%, the curve is expressed as:
$$ \log N_{99} = A – B \log \sigma_a $$
where $A$ and $B$ are material constants, and $\sigma_a$ is the stress amplitude. Using provided data, the constants are determined, and the equation becomes:
$$ \log N_{99} = 18.2666 – 4.8617 \log \sigma_a $$
This equation is used in MATLAB to generate the S-N data points, which are then tabulated and input into ANSYS to define the material’s fatigue properties.
| Stress Amplitude, S (MPa) | Cycles to Failure, N |
|---|---|
| 992 | 5,000 |
| 860 | 10,000 |
| 618 | 50,000 |
| 536 | 100,000 |
| 334 | 1,000,000 |
| 289 | 2,000,000 |
| 266 | 3,000,000 |
| 251 | 4,000,000 |
| 240 | 5,000,000 |
| 231 | 6,000,000 |
| 224 | 7,000,000 |
| 217 | 8,000,000 |
| 212 | 9,000,000 |
| 208 | 10,000,000 |
3.2 Defining Loading History for the Gear Shaft
The fatigue life is highly dependent on the load spectrum. The time-varying normal force on the gear shaft teeth, extracted from the ADAMS dynamics simulation, defines the loading history. This force fluctuates around a mean value due to the cutting action and transmission dynamics. Key turning points (peaks and valleys) from this force history are used to define the sequence of load steps in the fatigue analysis, creating a simplified yet representative block load cycle for the gear shaft.
3.3 Fatigue Life Calculation and Results
The fatigue analysis focuses on the critical location identified during the static contact analysis—the node with the maximum von Mises stress on the gear shaft. The stress state at this node, scaled according to the defined loading spectrum, is used for the life prediction. The Palmgren-Miner rule states that failure occurs when the cumulative damage index $D$ reaches 1:
$$ D = \sum_{i=1}^{k} \frac{n_i}{N_i} = 1 $$
where $n_i$ is the number of cycles applied at a given stress level $\sigma_{a,i}$, and $N_i$ is the number of cycles to failure at that stress level read from the S-N curve.
The analysis calculates the fatigue life of the gear shaft as approximately 433,600 cycles of the defined load block. To evaluate the design margin for a target life, the cumulative damage after a specified number of cycles (e.g., 100,000 cycles) is computed. The result yields a cumulative damage factor $D_{100k} = 0.23$. Since $D_{100k} < 1$, it indicates that after 100,000 operational cycles, only 23% of the gear shaft’s fatigue life is consumed, confirming a satisfactory fatigue resistance for the designed service life target.
4. Conclusion
This integrated simulation study successfully demonstrates a comprehensive methodology for analyzing the contact fatigue behavior of a heavily loaded gear shaft. The process begins with extracting realistic dynamic loads from a system-level multibody dynamics model of the machinery. This load is then applied to a detailed nonlinear finite element contact model of the gear shaft and pinion to determine precise stress distributions under worst-case static loading. The static analysis confirmed that the gear shaft’s maximum stress remains below the material’s yield limit with a safety factor of 1.6.
Most importantly, moving beyond static assessment, the fluctuating nature of the operational load was accounted for in a fatigue life prediction using the stress-life method. The analysis, based on the dynamic load history and the material’s S-N characteristics, predicted a total life of over 433,000 load cycles for the gear shaft. The low cumulative damage (0.23) after a significant portion of the target service life demonstrates robust fatigue performance. This multidisciplinary approach—coupling system dynamics, detailed contact mechanics, and fatigue theory—provides a high-fidelity and highly valuable reference for the structural integrity and anti-fatigue evaluation of similar power transmission components, especially complex gear shafts operating under harsh and variable loading conditions.