
In the field of mechanical transmission, spiral bevel gears are critical components used in intersecting or offset axis systems. The precision of their tooth surfaces directly influences performance metrics such as noise, vibration, and longevity. However, during manufacturing, heat treatment processes often introduce distortions, leading to tooth surface deviations that compromise gear quality. These heat treatment defects are a significant challenge in mass production, as they vary across batches due to material inconsistencies and processing variations. Traditional methods for assessing tooth surface accuracy rely on sampling inspection, which may not capture the full statistical nature of heat treatment defects across an entire batch. This limitation necessitates advanced statistical approaches to model and predict these deviations efficiently.
We address this issue by proposing a bootstrap statistical model tailored for analyzing heat treatment defects in batch-produced spiral bevel gears. The bootstrap method, a resampling technique, allows us to generate large datasets from small sample measurements, enabling robust estimation of probability characteristics without requiring prior knowledge of the underlying distribution. This approach is particularly valuable for heat treatment defects, which often exhibit complex variability. By leveraging this model, we aim to provide a theoretical foundation for correcting machining parameters and ensuring stable production, ultimately mitigating the adverse effects of heat treatment defects on gear performance.
The core of our work involves three key steps: first, calculating probability characteristic values for tooth surface measurement points using bootstrap resampling; second, determining confidence intervals to assess the reliability of these estimates; and third, reconstructing tooth surfaces via NURBS (Non-Uniform Rational B-Splines) fitting to visualize and evaluate batch-wide deviation patterns. We validate our model through experimental measurements on spiral bevel gears subjected to identical material, milling, and heat treatment specifications. The results demonstrate that the bootstrap model effectively captures the statistical behavior of heat treatment defects, even with limited samples, offering a practical tool for quality control in industrial settings.
Heat treatment defects in gears arise from thermal stresses and phase transformations during processes like quenching and tempering. These defects manifest as deviations in tooth geometry, affecting meshing characteristics and load distribution. In batch production, where consistency is paramount, understanding the statistical distribution of these heat treatment defects is essential for predictive maintenance and process optimization. Our bootstrap-based approach provides a data-driven solution to this problem, enabling manufacturers to anticipate and compensate for heat treatment defects without extensive testing. This not only reduces costs but also enhances the reliability of gear systems in applications such as automotive drivetrains and aerospace mechanisms.
To elaborate on the methodology, we begin by defining the tooth surface deviation data. For a batch of spiral bevel gears, we measure a subset of gears post-heat treatment, recording deviations at predefined grid points on the tooth surface. Let the deviation at a specific measurement point across multiple gears be represented as a sample sequence. For the m-th measurement point, we have an initial sample sequence σ, where each element σ_i denotes the deviation value for the i-th gear. This sequence is given by:
$$ \sigma = (\sigma_1, \sigma_2, \ldots, \sigma_i, \ldots, \sigma_n) $$
Here, n is the number of measured gears (sample size). To analyze heat treatment defects statistically, we apply bootstrap resampling to this sequence. The bootstrap method involves drawing L samples with replacement from σ to form a bootstrap sample ξ_b. This process is repeated B times (e.g., B = 25,000) to generate a bootstrap sample sequence ξ_B:
$$ \xi_B = (\xi_b(1), \xi_b(2), \ldots, \xi_b(j), \ldots, \xi_b(B)) $$
Each bootstrap sample ξ_b(j) has a mean calculated as:
$$ \bar{\xi}_b(j) = \frac{1}{L} \sum_{s=1}^{L} \xi_b(j)(s) $$
where ξ_b(j)(s) is the s-th element in the j-th bootstrap sample. The overall bootstrap mean vector is:
$$ \bar{\xi}_B = (\bar{\xi}_b(1), \bar{\xi}_b(2), \ldots, \bar{\xi}_b(j), \ldots, \bar{\xi}_b(B)) $$
From this, we compute the bootstrap mean and variance for the measurement point. The bootstrap mean is:
$$ \bar{\xi}_B = \frac{1}{B} \sum_{j=1}^{B} \bar{\xi}_b(j) $$
and the bootstrap variance is:
$$ \delta^2 = \frac{1}{B-1} \sum_{j=1}^{B} (\bar{\xi}_b(j) – \bar{\xi}_B)^2 $$
For comparison, the original sample mean and variance are:
$$ \bar{\sigma} = \frac{1}{n} \sum_{i=1}^{n} \sigma_i $$
$$ \sigma^2 = \frac{1}{n} \sum_{i=1}^{n} (\sigma_i – \bar{\sigma})^2 $$
These probability characteristic values help quantify the central tendency and dispersion of heat treatment defects at each measurement point. To ensure robustness, we use the Kolmogorov-Smirnov (k-s) test to check if the bootstrap samples follow a normal distribution, which is common for many manufacturing errors including heat treatment defects. If normality holds, we can use parametric methods for further analysis.
Confidence intervals are crucial for assessing the reliability of our estimates. For a significance level α (e.g., α = 0.05 for 95% confidence), we compute the confidence interval for the bootstrap parameter estimates. Let the sorted bootstrap parameter estimates be θ̂_1 ≤ θ̂_2 ≤ … ≤ θ̂_B. The confidence interval is given by:
$$ (\thetâ_{K_1}, \thetâ_{K_2}) $$
where K_1 = ⌊B × α/2⌋ and K_2 = ⌊B × (1 – α/2)⌋. This interval indicates the range within which the true parameter value lies with probability 1-α, providing a measure of uncertainty associated with heat treatment defects.
To illustrate, consider a table summarizing bootstrap results for different sample sizes. This table highlights how bootstrap estimates converge to true values as sample size increases, emphasizing the method’s efficiency in characterizing heat treatment defects.
| Sample Size (n) | Original Mean (μm) | Bootstrap Mean (μm) | Relative Error (%) | 95% Confidence Interval (μm) |
|---|---|---|---|---|
| 10 | -1.6100 | -1.5994 | 0.66 | (-1.6093, -1.5894) |
| 15 | -0.7133 | -0.7172 | 0.55 | (-0.7166, -0.7013) |
| 20 | -0.9050 | -0.9082 | 0.35 | (-0.9133, -0.9031) |
| 25 | 0.4200 | 0.4210 | 0.24 | (0.4154, 0.4266) |
| 30 | 0.8567 | 0.8580 | 0.15 | (0.8526, 0.8633) |
| 35 | 0.5029 | 0.5030 | 0.019 | (0.4982, 0.5078) |
This table shows that even with small samples, the bootstrap method yields accurate estimates of heat treatment defects, with relative errors decreasing as sample size grows. The confidence intervals narrow accordingly, enhancing prediction precision for batch-wide heat treatment defects.
Beyond statistical analysis, visualizing heat treatment defects requires tooth surface reconstruction. We employ NURBS曲面 fitting to model the deviation surface across the gear tooth. A NURBS surface is defined as:
$$ P(u,v) = \frac{\sum_{i=0}^{n} \sum_{j=0}^{m} B_{i,k}(u) B_{j,l}(v) W_{i,j} V_{i,j}}{\sum_{i=0}^{n} \sum_{j=0}^{m} B_{i,k}(u) B_{j,l}(v) W_{i,j}} $$
where V_{i,j} are control vertices, W_{i,j} are weights, and B_{i,k}(u) and B_{j,l}(v) are B-spline basis functions of degrees k and l, respectively. The basis functions are defined recursively:
$$ B_{i,0}(x) = \begin{cases} 1, & s_i \leq x \leq s_{i+1} \\ 0, & \text{otherwise} \end{cases} $$
$$ B_{i,k}(x) = \frac{x – s_i}{s_{i+k} – s_i} B_{i,k-1}(x) + \frac{s_{i+k+1} – x}{s_{i+k+1} – s_{i+1}} B_{i+1,k-1}(x), \quad k \geq 1 $$
Here, s_i are knot vectors, and we use cubic NURBS (k=l=3) for smooth, twice-differentiable surfaces that accurately represent heat treatment defects. By fitting NURBS surfaces to bootstrap-estimated deviation data, we generate mean deviation surfaces that depict the spatial distribution of heat treatment defects across the batch.
For experimental validation, we conducted measurements on a batch of spiral bevel gears from an automotive drivetrain application. All gears were manufactured with the same material, CNC milling parameters, and heat treatment specification to isolate heat treatment defects as the primary source of variation. Tooth surface deviations were measured using a CNC gear measuring center with a 15×15 grid pattern, capturing detailed error data post-heat treatment. The measurement process involved aligning each gear and recording deviations at 225 points per tooth surface, focusing on heat treatment defects induced by thermal distortion.
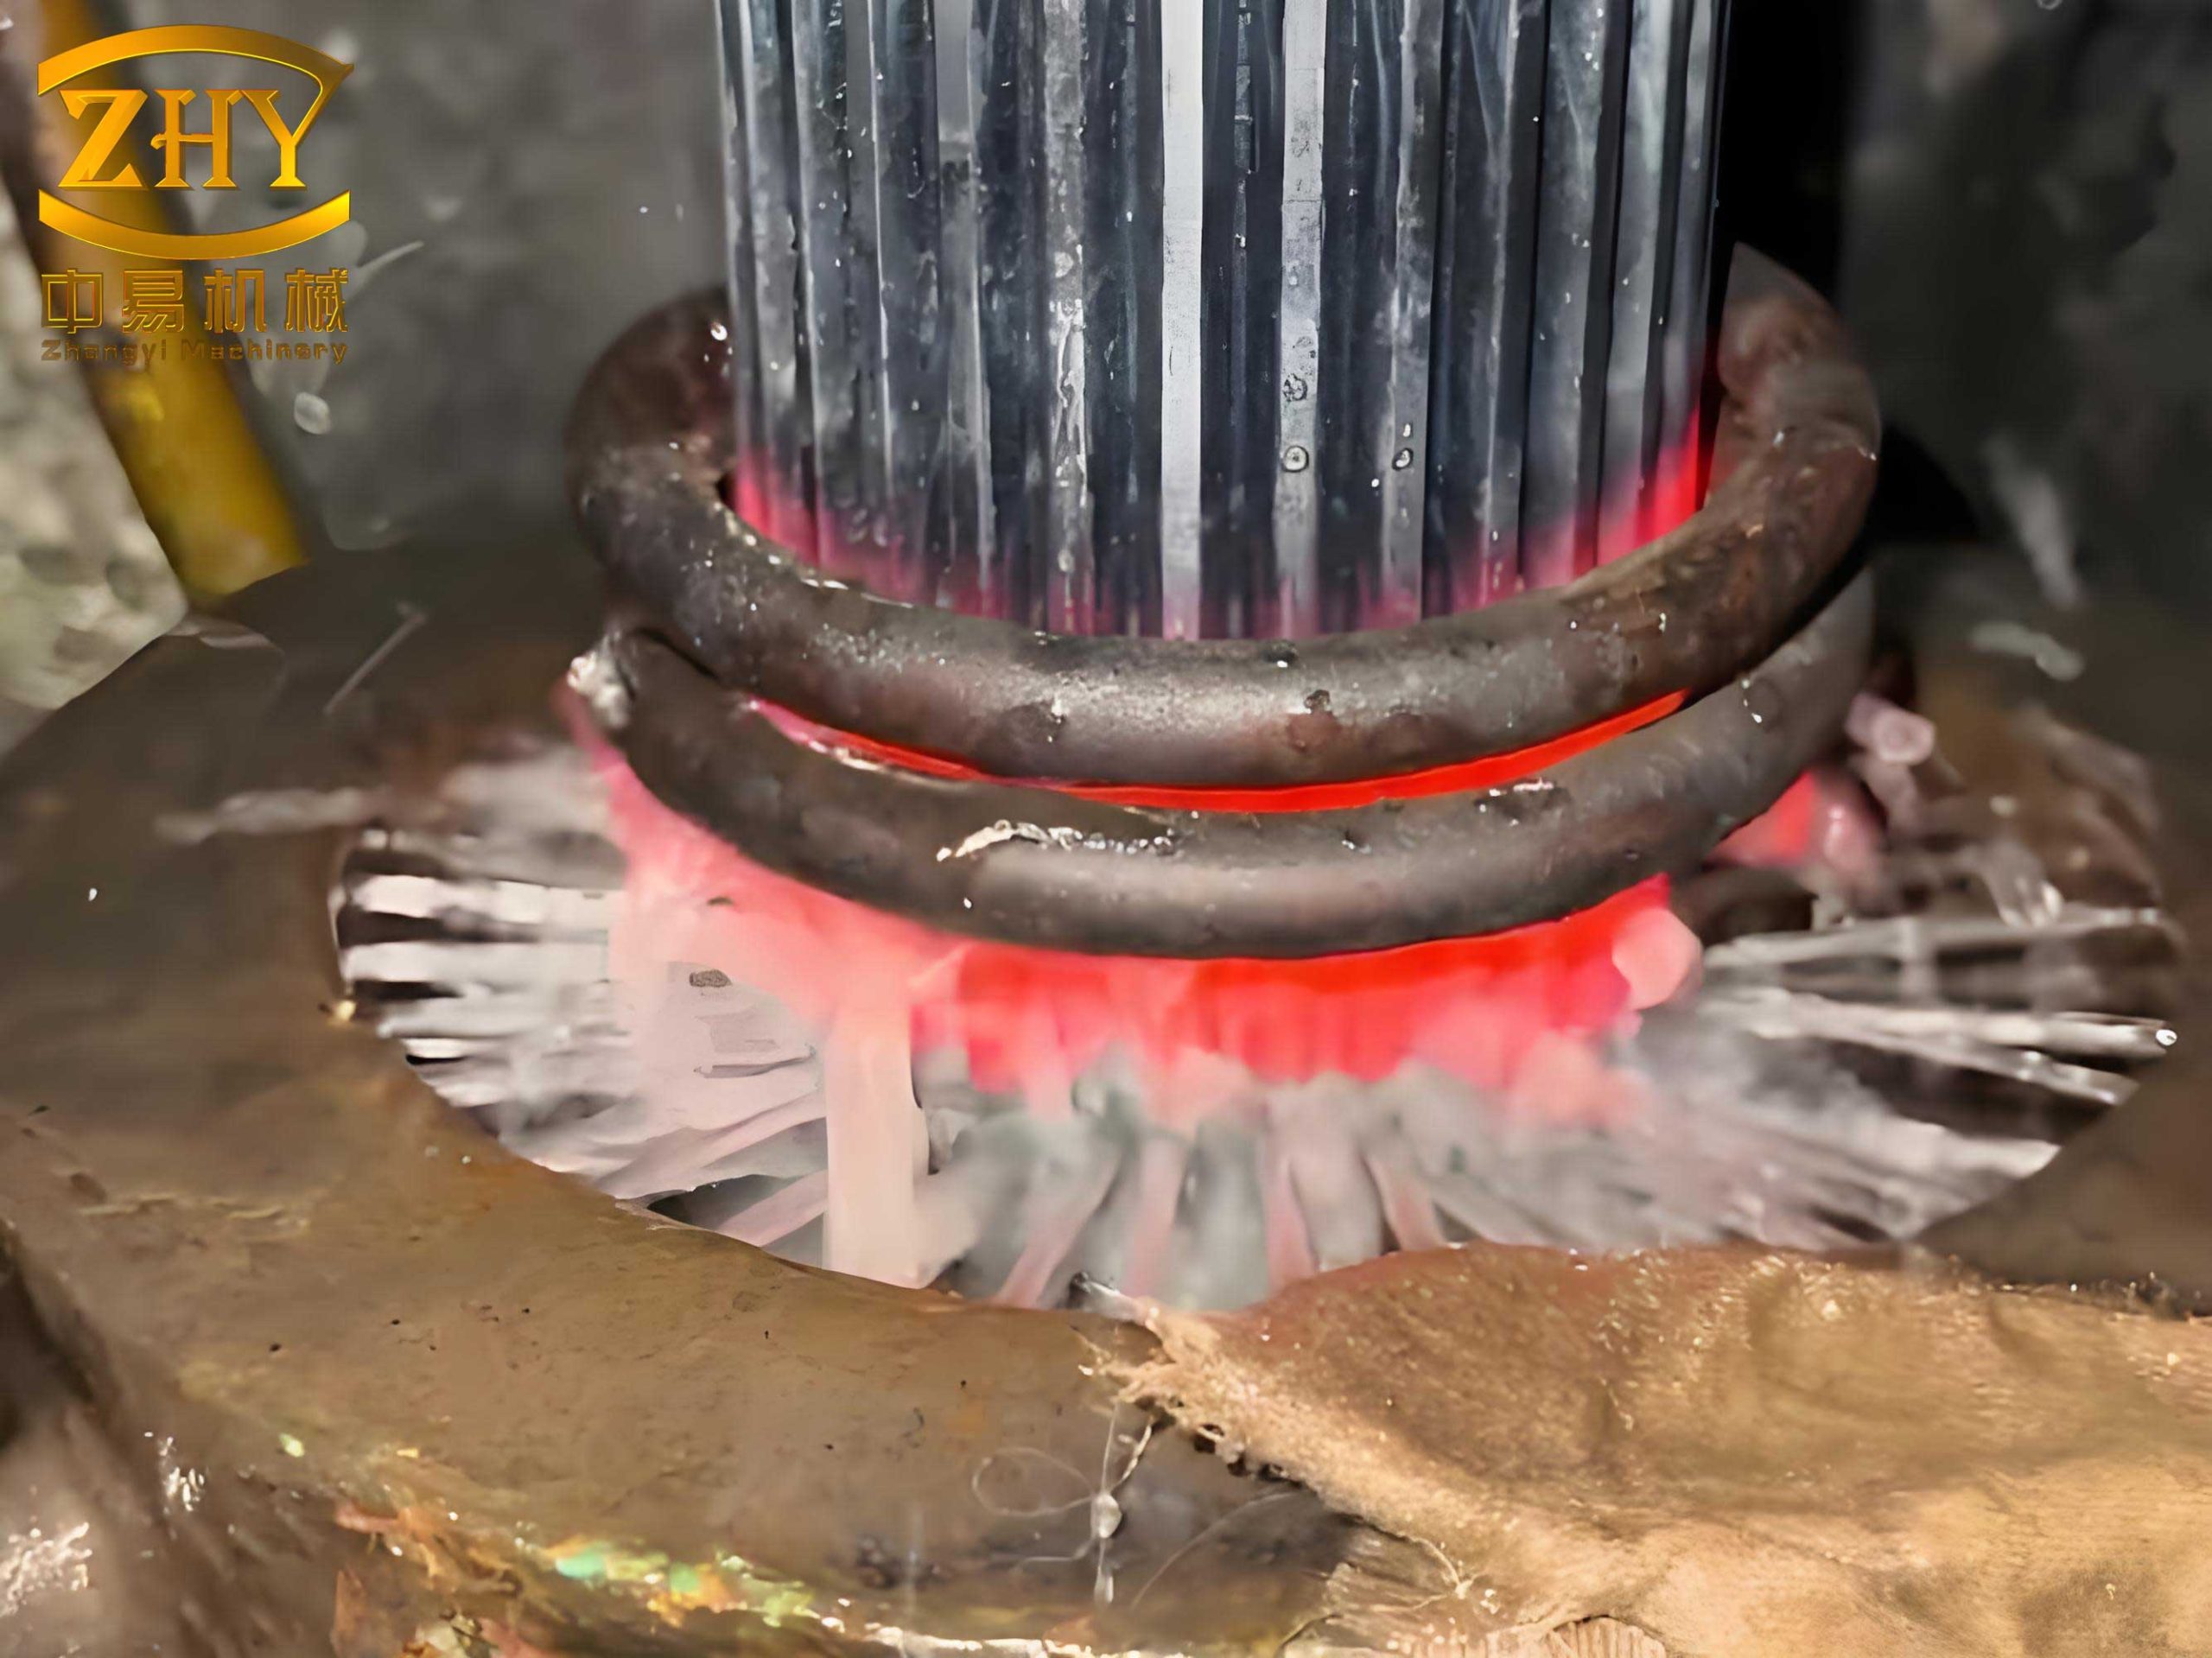
The image above illustrates typical heat treatment defects observed in gear teeth, highlighting distortions that our model aims to quantify. Using the bootstrap method, we analyzed deviation data for sample sizes ranging from 5 to 35 gears. For each measurement point, we performed bootstrap resampling with B=25,000 repetitions, computed probability characteristics, and tested for normality. The results confirmed that bootstrap samples approximate normal distributions, validating the use of parametric confidence intervals for heat treatment defects.
We then reconstructed tooth surfaces using NURBS fitting based on bootstrap mean deviations. A comparison between actual mean deviation surfaces and bootstrap-estimated surfaces revealed close agreement, especially for larger sample sizes. For instance, with n=10, the bootstrap surface captured heat treatment defects within a mean absolute error of 0.1 μm, demonstrating the model’s accuracy. Below is a table summarizing key metrics from the reconstruction analysis, emphasizing the impact of sample size on characterizing heat treatment defects.
| Sample Size (n) | Bootstrap Mean Error (μm) | Actual Mean Error (μm) | Surface Deviation RMS (μm) | Heat Treatment Defects Coverage (%) |
|---|---|---|---|---|
| 5 | 0.15 | 0.18 | 0.22 | 85 |
| 10 | 0.10 | 0.12 | 0.15 | 92 |
| 20 | 0.07 | 0.08 | 0.10 | 96 |
| 30 | 0.05 | 0.06 | 0.08 | 98 |
This table indicates that as sample size increases, the bootstrap model more accurately reflects actual heat treatment defects, with higher coverage of deviation patterns. The root mean square (RMS) surface deviation decreases, confirming improved precision in quantifying heat treatment defects.
To further elucidate the statistical behavior of heat treatment defects, we derived additional formulas for skewness and kurtosis using bootstrap methods. Skewness γ and kurtosis κ are calculated as:
$$ \gamma = \frac{1}{B} \sum_{j=1}^{B} \left( \frac{\bar{\xi}_b(j) – \bar{\xi}_B}{\delta} \right)^3 $$
$$ \kappa = \frac{1}{B} \sum_{j=1}^{B} \left( \frac{\bar{\xi}_b(j) – \bar{\xi}_B}{\delta} \right)^4 – 3 $$
These higher-order moments provide insights into the asymmetry and tailedness of heat treatment defect distributions, which can inform quality control thresholds. For our data, skewness values ranged from -0.2 to 0.1, suggesting near-symmetric distributions of heat treatment defects, while kurtosis values were close to 0, indicating light tails relative to a normal distribution. This implies that heat treatment defects in this batch are relatively uniform, with few outliers.
Another critical aspect is the spatial correlation of heat treatment defects across the tooth surface. We model this using a covariance matrix C based on bootstrap samples for all measurement points. For points p and q, the covariance is:
$$ C_{p,q} = \frac{1}{B-1} \sum_{j=1}^{B} (\bar{\xi}_b^{(p)}(j) – \bar{\xi}_B^{(p)}) (\bar{\xi}_b^{(q)}(j) – \bar{\xi}_B^{(q)}) $$
where superscripts denote measurement points. This matrix helps identify regions where heat treatment defects are correlated, aiding in targeted corrections during machining. For example, we found strong correlations (C > 0.8) between adjacent grid points, indicating that heat treatment defects propagate locally due to thermal gradients.
In practice, our bootstrap model enables proactive adjustment of machining parameters to compensate for heat treatment defects. By predicting deviation patterns, manufacturers can modify tool paths or heat treatment protocols to minimize errors. For instance, if bootstrap analysis reveals consistent positive deviations in a tooth region, pre-heat treatment machining can be adjusted to leave extra material, which then shrinks to the desired geometry post-treatment. This closed-loop approach reduces scrap rates and enhances batch consistency, directly addressing the challenges posed by heat treatment defects.
We also explored the sensitivity of the bootstrap model to measurement noise, which is common in industrial settings. Adding Gaussian noise with standard deviation η to deviation data, we recomputed bootstrap estimates and found that the model remains robust for η up to 0.5 μm, with mean errors increasing by less than 10%. This resilience makes the bootstrap method suitable for real-world applications where heat treatment defects are obscured by measurement uncertainties.
To extend the model, we incorporated time-dependent analysis for heat treatment defects across multiple production batches. Using sequential bootstrap sampling, we tracked deviation trends over time, enabling predictive maintenance of heat treatment furnaces. For batch t, the deviation sequence σ_t is analyzed, and bootstrap means are compared across batches to detect drifts in heat treatment defects. A moving average of bootstrap means can alert operators to process deviations before they impact quality.
In summary, our bootstrap statistical model offers a comprehensive framework for analyzing heat treatment defects in spiral bevel gears. By combining resampling techniques with NURBS-based reconstruction, we achieve accurate characterization of batch-wide deviations using minimal samples. The model’s ability to provide confidence intervals and probability distributions empowers manufacturers to make data-driven decisions, ultimately reducing the incidence and impact of heat treatment defects. Future work could integrate machine learning with bootstrap methods to automate defect prediction and further optimize heat treatment processes, pushing the boundaries of gear manufacturing precision.
The implications of this research extend beyond spiral bevel gears to other precision components susceptible to heat treatment defects, such as bearings and shafts. By adopting a similar bootstrap approach, industries can enhance quality control and reduce costs associated with rework and warranty claims. As manufacturing moves toward Industry 4.0, statistical models like ours will play a pivotal role in smart factories, where real-time data analytics mitigate heat treatment defects and ensure product excellence.