
In my extensive experience with automotive drivetrain design, particularly for final drives, the design of the hyperboloid gear pair (often referred to as hypoid gear) in the main reducer has always presented a significant challenge. The traditional methodology relies heavily on empirical knowledge and iterative “trial-and-error” calculations to establish basic geometric parameters. This process is not only time-consuming but also often fails to guarantee an optimal balance between competing design objectives such as strength, durability, noise, and compactness. The complex, non-linear interdependencies among the numerous parameters governing a hyperboloid gear set demand a more robust and systematic design framework. This is where the Three-Stage Design method, rooted in the principles of robust design and quality engineering, becomes an indispensable tool.
The core challenge in traditional hyperboloid gear design stems from its computational complexity. The governing equations for a Gleason system hypoid gear set can exceed 40, with at least three of these formulas requiring multiple iterations (often three or more) to converge on a solution. Basic parameters such as the gear and pinion tooth counts ($z_2$, $z_1$), the pinion offset ($E$), the ring gear pitch diameter ($d_2$), and the face width ($b$) are profoundly interdependent. Selecting an initial set of values based solely on experience can lead to a sub-optimal design that may barely pass strength checks but could exhibit poor performance in noise, efficiency, or size. My goal was to transition from this heuristic approach to a principled one that systematically explores the design space and identifies parameter combinations that deliver robust performance.
System Design: Defining the Functional Requirements
The first stage, System Design, is about defining the product’s architecture and its core functional objectives. For a main reducer hyperboloid gear set, I defined three primary, and often conflicting, target characteristics:
- High Strength and Durability (Smaller-the-Better Characteristic): The gear teeth must withstand bending and contact stresses under various loading conditions without failure.
- Smooth Operation and Low Noise (Larger-the-Better Characteristic): The transmission error should be minimized to ensure quiet and vibration-free operation. A key metric here is the transverse contact ratio ($\epsilon_{\alpha}$).
- Compactness and Light Weight (Smaller-the-Better Characteristic): The overall volume and mass of the gear set should be minimized to save space, material, and reduce inertia.
To formalize this, I constructed a composite objective function $Y$ that encapsulates these multi-target requirements across different operating conditions (e.g., maximum torque and average torque). For the $k$-th operating condition, the system’s output $y_k$ is a function of the controllable design parameters $\mathbf{x} = (x_1, x_2, …, x_n)$:
$$
y_k = f_k(d_2, z_2, z_1, E, b, …)
$$
The overall quality characteristic $Y$ to be optimized is then a vector combining these individual targets. For instance, a combined objective for a single condition might weight different aspects:
$$
Y = \omega_1 \cdot \sigma_{F1} + \omega_2 \cdot \sigma_{F2} + \omega_3 \cdot \sigma_H – \omega_4 \cdot \epsilon_{\alpha} + \omega_5 \cdot (V_1 + V_2)
$$
where $\sigma_{F1}$, $\sigma_{F2}$ are the pinion and gear bending stresses, $\sigma_H$ is the contact stress, $\epsilon_{\alpha}$ is the transverse contact ratio, $V_1$, $V_2$ are the approximate gear volumes, and $\omega_i$ are weighting factors reflecting the design priorities. The goal of robust design is to find the parameter set $\mathbf{x}$ that minimizes the variance of $Y$ while bringing its mean on target, making the performance insensitive to noise factors.
Parameter Design: The Core of Robust Optimization
Parameter Design is the most critical phase. Its purpose is to determine the nominal values of the controllable factors (the basic hyperboloid gear parameters) so that the system’s performance is least sensitive to the inevitable variations in manufacturing, assembly, and operating environment (noise factors). The primary tool for this is Design of Experiments (DOE), specifically using orthogonal arrays.
I will illustrate the process with a case study based on a light-duty passenger vehicle. The key vehicle data is summarized below:
| Parameter | Symbol | Value |
|---|---|---|
| Engine Max Torque | $T_{e-max}$ | 158 N·m |
| Transmission Max Ratio | $i_g$ | 5.8 |
| Vehicle Curb Weight | $G_a$ | 1880 kg |
| Final Drive Ratio | $i_0$ | 5.857 |
| Tire Rolling Radius | $r_r$ | 0.275 m |
Step 1: Selecting Controllable Factors and Levels
I selected five primary controllable factors for the hyperboloid gear design. To efficiently explore their effects, three levels were chosen for each factor, with the central level representing a typical or initial design value. Levels for $d_2$ and $b$ were treated as “flexible,” meaning their range was widened to fully capture their influence. The factors and levels are shown in Table 1.
| Factor | Symbol | Level 1 | Level 2 (Nominal) | Level 3 |
|---|---|---|---|---|
| Ring Gear Pitch Diameter (mm) | $d_2$ | 228 | 240 | 252 |
| Ring Gear Tooth Count | $z_2$ | 39 | 41 | 43 |
| Pinion Tooth Count | $z_1$ | 6 | 7 | 8 |
| Pinion Offset (mm) | $E$ | 18 | 22 | 26 |
| Face Width (mm) | $b$ | 32 | 38 | 44 |
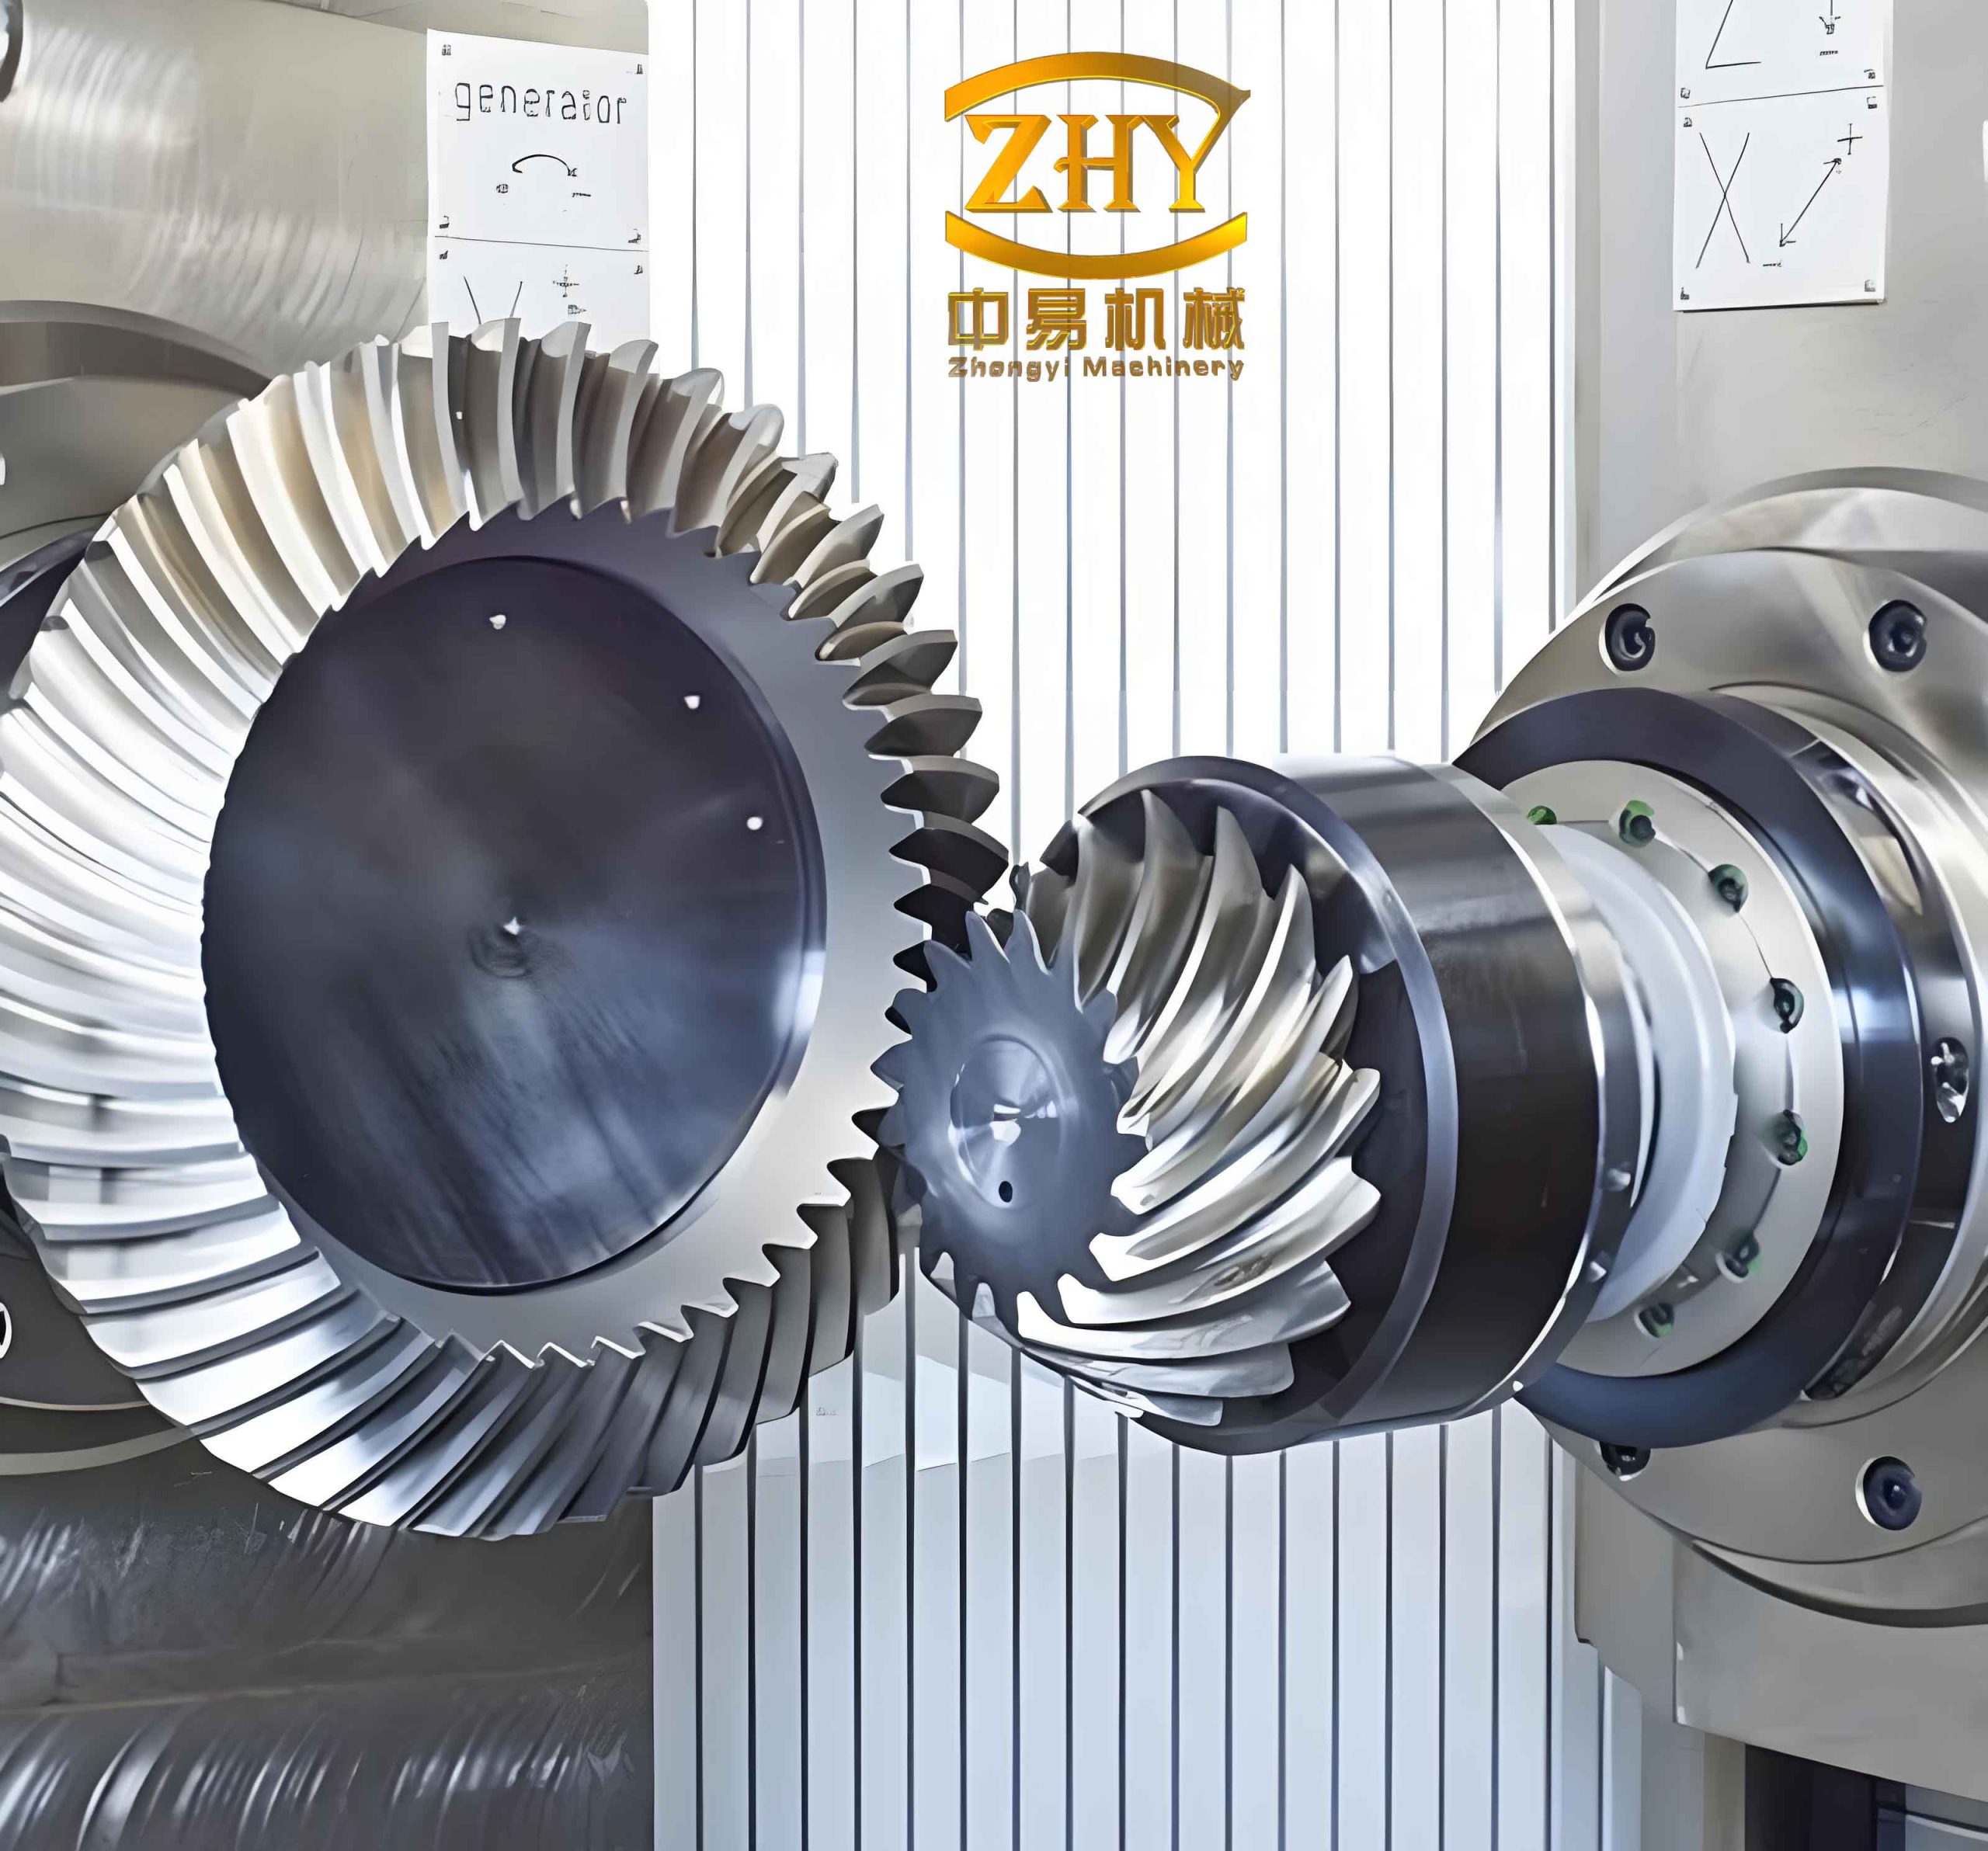
The unique geometry of a hyperboloid gear set, characterized by the offset between the pinion and gear axes, is what allows for a lower pinion placement and higher gear reduction in a compact package. This offset also introduces complex sliding actions that must be carefully managed through parameter selection.
Step 2: Constructing the Inner Array (Control Factors)
An $L_{18}$ orthogonal array was chosen as the “inner array” to arrange the trials for the controllable factors. This array efficiently accommodates the five 3-level factors, requiring only 18 computational runs instead of the full $3^5=243$ factorial experiments. Factors $d_2$ and $b$ were assigned to specific columns based on the interaction properties of the $L_{18}$ array.
Step 3: Selecting Noise Factors and Outer Array
Noise factors are sources of variation that the design should be made robust against. For this hyperboloid gear study, I considered variations in material properties (hardness) and operating load as key noise factors. Three levels were chosen for each: nominal, low, and high, as shown in Table 2.
| Noise Factor | Symbol | Level 1 (-) | Level 2 (0) | Level 3 (+) |
|---|---|---|---|---|
| Gear Hardness Variation | $N_1$ | Nominal – 1 HRC | Nominal Hardness | Nominal + 1 HRC |
| Applied Torque Variation | $N_2$ | 95% of Design Torque | 100% Design Torque | 105% of Design Torque |
An $L_4$ orthogonal array was used as the “outer array” to systematically combine these noise factors for each run of the inner array. This means for each of the 18 control factor combinations, the gear stresses and contact ratio were calculated under 4 different noise conditions.
Step 4: Calculating the Signal-to-Noise (S/N) Ratio
The S/N ratio ($\eta$) is the metric that quantifies robustness. For “Smaller-the-Better” characteristics like stress ($\sigma$), it is calculated as follows (for the $i$-th inner array run, across $j=1$ to $4$ outer array runs):
$$
\eta_i = -10 \log_{10} \left( \frac{1}{4} \sum_{j=1}^{4} \sigma_{ij}^2 \right)
$$
For “Larger-the-Better” characteristics like contact ratio ($\epsilon$):
$$
\eta_i = -10 \log_{10} \left( \frac{1}{4} \sum_{j=1}^{4} \frac{1}{\epsilon_{ij}^2} \right)
$$
A higher S/N ratio always indicates better robustness—lower sensitivity to noise. For the multi-objective optimization, I calculated a weighted composite S/N ratio for each of the 18 trials, considering both maximum torque and average torque conditions.
Step 5: Statistical Analysis of Variance (ANOVA)
Performing ANOVA on the S/N ratios from the inner array allows me to objectively determine which controllable factors have a statistically significant effect on the overall robustness of the hyperboloid gear design. The key steps in ANOVA are:
a. Calculate Sum of Squares:
Total Sum of Squares: $S_T = \sum_{i=1}^{18} \eta_i^2 – CF$, where $CF = (\sum \eta_i)^2 / 18$.
Factor Sum of Squares (for a 3-level factor in an $L_{18}$ column): For factor $A$,
$S_A = \frac{(K_{A1})^2 + (K_{A2})^2 + (K_{A3})^2}{6} – CF$
where $K_{A1}, K_{A2}, K_{A3}$ are the sums of $\eta$ for trials where factor $A$ is at level 1, 2, and 3 respectively.
b. Calculate Degrees of Freedom, Mean Square, and Pure Sum of Squares:
Degrees of Freedom for a factor: $f_A = (\text{number of levels} – 1) = 2$.
Mean Square: $V_A = S_A / f_A$.
Error Variance: $V_e = S_e / f_e$.
Pure Sum of Squares: $S’_A = S_A – (f_A \times V_e)$.
c. Calculate Contribution Ratio ($\rho$):
This indicates the percentage contribution of each factor to the total variation in S/N ratio.
$$
\rho_A = \frac{S’_A}{S_T} \times 100\%
$$
The ANOVA results for the average torque condition are summarized in Table 3.
| Factor | Symbol | Sum of Sq. (S) | Deg. of Free. (f) | Mean Sq. (V) | Pure Sum (S’) | Contribution Ratio $\rho$ (%) |
|---|---|---|---|---|---|---|
| Pinion Offset | $E$ | 43.21 | 2 | 21.60 | 42.87 | 52.1 |
| Ring Gear Diameter | $d_2$ | 18.95 | 2 | 9.48 | 18.61 | 22.6 |
| Face Width | $b$ | 8.74 | 2 | 4.37 | 8.40 | 10.2 |
| Pinion Tooth Count | $z_1$ | 5.32 | 2 | 2.66 | 4.98 | 6.1 |
| Ring Gear Tooth Count | $z_2$ | 4.88 | 2 | 2.44 | 4.54 | 5.5 |
| Error | $e$ | 1.02 | 7 | 0.15 | 3.04 | 3.7 |
| Total | $T$ | 82.12 | 17 | – | 82.12 | 100.0 |
Step 6: Selecting the Optimal Parameter Combination
The ANOVA clearly shows that the pinion offset ($E$) is the most influential parameter, contributing over 50% to the variation in robustness. The ring gear diameter ($d_2$) is the second most significant factor. The analysis provides the average S/N ratio for each level of every factor. The optimal combination is typically the one with the highest S/N ratio for each factor.
- For $E$: The S/N ratio increased with offset. However, excessive offset in a hyperboloid gear increases sliding velocity and the risk of scoring or wear. For light vehicles, $E$ should not exceed ~20% of the gear outer cone distance (or ~12% of $d_2$). Therefore, while Level 3 (26 mm) gave the best S/N, a slightly lower value of 24 mm was chosen as a practical optimum to balance robustness with durability.
- For $d_2$: Level 1 (228 mm) provided the best robustness for average torque, while a larger diameter was favorable for maximum torque. Considering the compactness objective, Level 1 (228 mm) was selected.
- For $z_1$ & $z_2$: The optimal combination $(z_1=7, z_2=41)$ provided both a good S/N ratio and a final drive ratio ($i_0 = z_2/z_1 = 5.857$) very close to the target. Prime number relationships were also checked to avoid repeated tooth contact patterns.
- For $b$: A medium level was found optimal. Level 2 (38 mm) was selected.
Thus, the final optimized parameter set for this hyperboloid gear design is: $d_2^* = 228 \text{ mm}, z_2^* = 41, z_1^* = 7, E^* = 24 \text{ mm}, b^* = 38 \text{ mm}$.
Discussion and Concluding Remarks
The application of the Three-Stage Design method to hyperboloid gear parameter selection offers profound advantages over traditional empirical approaches. Firstly, it transforms a subjective, experience-based process into an objective, data-driven optimization. The use of orthogonal arrays and S/N ratios allows for the efficient exploration of a vast multi-dimensional parameter space with a relatively small number of systematic evaluations.
Secondly, it provides deep insight into parameter interactions and sensitivities. The ANOVA table is a powerful diagnostic tool. Knowing that the pinion offset $E$ accounts for over half of the influence on the system’s robust performance guides where to focus design refinement efforts. This knowledge is as valuable as the optimal parameter set itself.
Thirdly, the methodology gracefully handles the multi-objective nature of gear design. By consolidating targets (stress, contact ratio, volume) into a composite S/N ratio, it finds a balanced compromise that a designer iterating manually might never consciously identify.
Finally, while the computational load for this approach is significant—involving 18 x 4 = 72 full gear meshing calculations for this case—it is perfectly suited for automation. The entire process, from generating orthogonal arrays to executing the complex Gleason gear geometry and stress formulas, can be programmed. This makes it a practical tool for modern engineering, moving the role of the designer from performing tedious calculations to interpreting sophisticated analyses and making high-level decisions based on clear statistical evidence. The robust hyperboloid gear set derived from this process is not only theoretically optimal but also far more likely to perform consistently well in the real world, where manufacturing tolerances and usage conditions are never ideal.