
In the field of automotive engineering, hyperboloid gears serve as critical components in drive axles, demanding high precision and smooth operation. Understanding their dynamic behavior is essential not only for designing gear systems with low noise and enhanced stability but also for improving reliability and lifespan by reducing dynamic stress levels. The complexity of real-world gear systems often involves coupled vibrations, making it necessary to analyze bending-torsional-axial-pendulum coupled vibrations in automotive hyperboloid gears. Furthermore, studying nonlinear dynamic characteristics considering time-varying mesh stiffness, transmission errors, and backlash is imperative for guiding the dynamic design of spiral bevel and hyperboloid gears. To complement theoretical analyses, experimental investigations are indispensable. In this study, we focus on the experimental analysis of hyperboloid gear transmission systems, utilizing experimental modal analysis to obtain natural frequencies and measuring vibration responses at bearing housings and gearbox surfaces. This provides a foundation for dynamic response calculations, stability analyses, and validation of theoretical models.
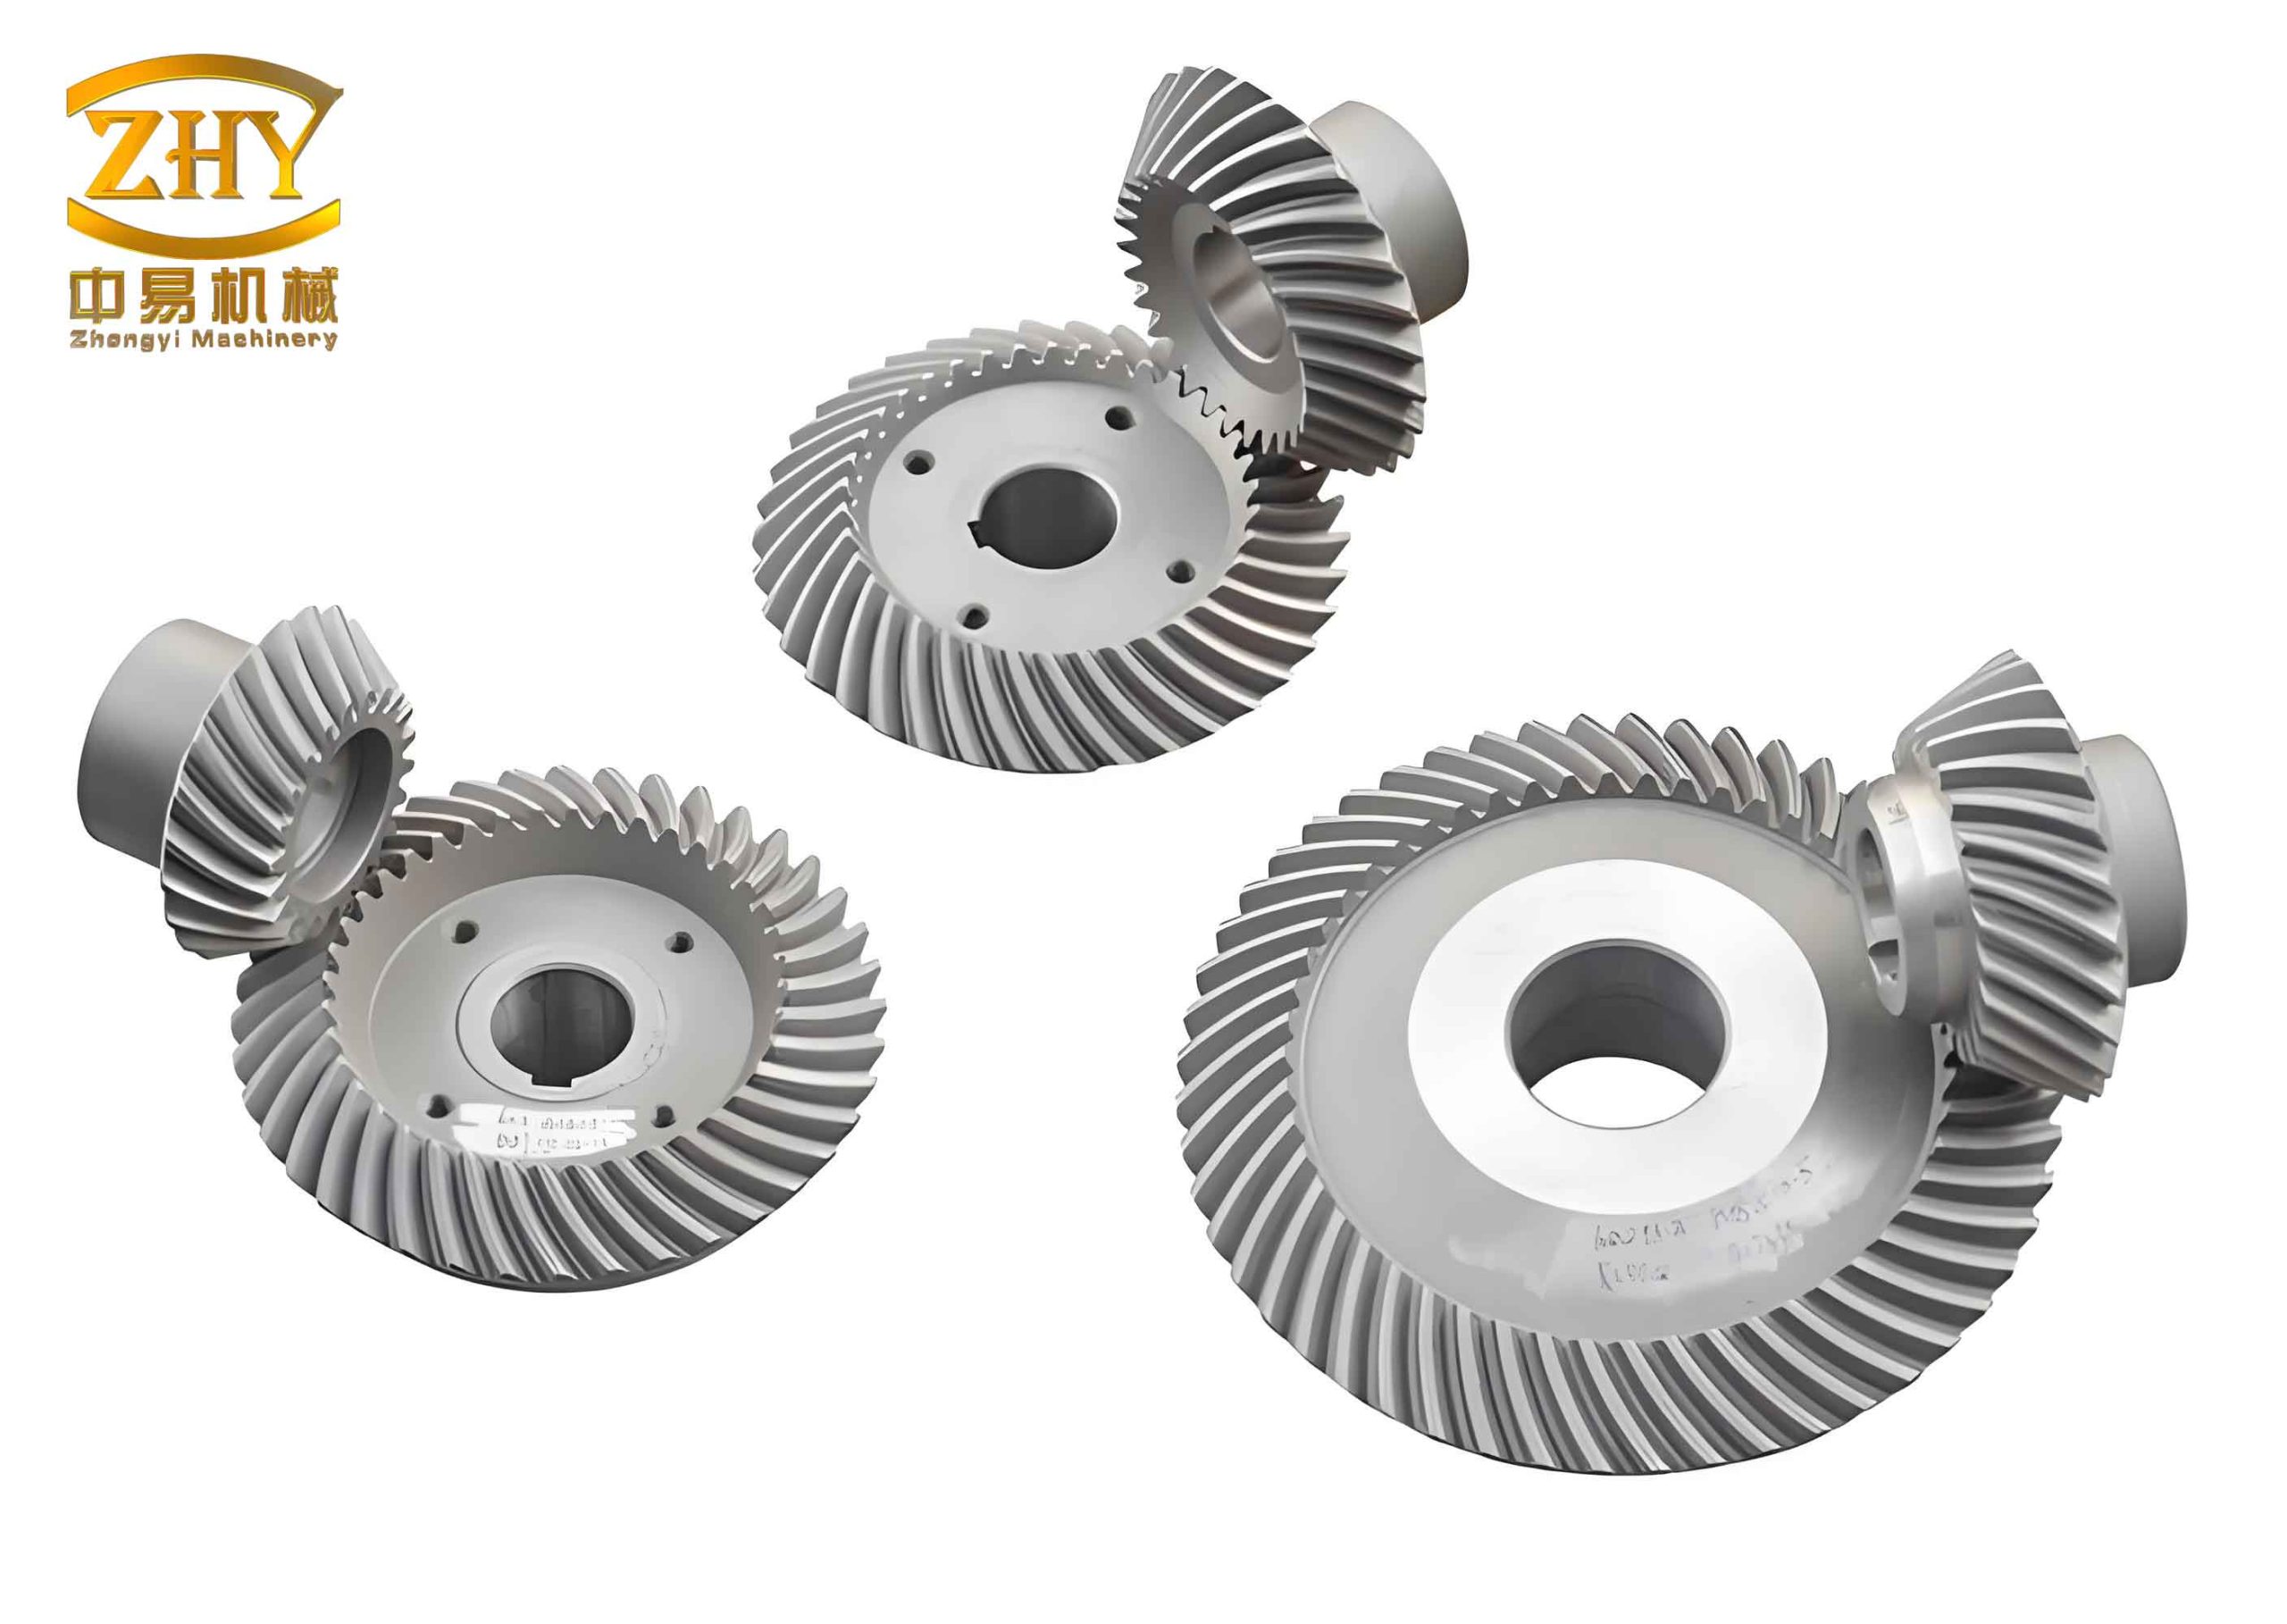
The hyperboloid gear pair under investigation features a pinion and gear with 7 and 39 teeth, respectively. Key parameters include a full tooth height of approximately 7.53 mm, an average spiral angle of 49°16’39” for the pinion and 30°46’25” for the gear, a pitch circle diameter of 51.7 mm for the pinion and 165.9 mm for the gear, a module of 4.254 mm, an average pressure angle of 21°15′, a face width of 25.7 mm, and an offset distance of 23 mm. The pinion is left-handed, while the gear is right-handed. An experimental platform was designed to test the dynamic characteristics of this hyperboloid gear pair, incorporating components such as a DC speed-regulating motor, torque-speed sensors, and magnetic powder brakes. Elastic couplings were used at both input and output ends to minimize external excitations from misalignment and load fluctuations, ensuring that the primary excitations stem from gear meshing impacts, tooth errors, stiffness variations, and bearing effects.
Experimental modal analysis was employed to determine the natural frequencies of the hyperboloid gear system. This method involves applying a pulse force excitation to the structure and measuring the response signals, which is reliable for obtaining low-frequency modal parameters. The testing system utilized a hammer for multi-point excitation and a single accelerometer for response measurement, with data acquired using an INV306D(F) intelligent signal acquisition and processing analyzer. The frequency response function \( H(\omega) \) and coherence function \( \gamma_{xy}^2(\omega) \) were derived from the power spectra of the force and response signals. The formulas are as follows:
$$ S_{FF}(\omega) = \text{auto-power spectrum of force signal} $$
$$ S_{XX}(\omega) = \text{auto-power spectrum of response signal} $$
$$ S_{FX}(\omega) = \text{cross-power spectrum of force and response} $$
$$ H(\omega) = \frac{S_{FX}(\omega)}{S_{FF}(\omega)} $$
$$ \gamma_{xy}^2(\omega) = \frac{|S_{FX}(\omega)|^2}{S_{FF}(\omega) S_{XX}(\omega)} $$
By averaging multiple impacts, signal-to-noise ratio was improved, and noise factors were mitigated. The accelerometer was fixed in the x-direction below the pinion shaft, and hammer impacts were applied sequentially to test points on the gearbox surface. The natural frequencies were identified from the frequency response functions in three coordinate directions (x, y, z). For frequencies excited in multiple directions, averages were taken, while those excited in only one direction were retained as system natural frequencies. The results for the first eight natural frequencies are summarized in Table 1, comparing experimental values with theoretical calculations. The theoretical model considered a finite element analysis of the gear system, but simplifications such as neglecting joint effects between gearbox covers and seats may account for discrepancies. The coherence coefficients at natural frequencies exceeded 0.8, indicating reliable measurements.
| Mode Number | 1 | 2 | 3 | 4 | 5 | 6 | 7 | 8 |
|---|---|---|---|---|---|---|---|---|
| Experimental Value (Hz) | 752 | 908 | — | — | 1382 | 1499 | 1533 | 1839 |
| Theoretical Value (Hz) | 785 | 909 | 1084 | 1272 | 1364 | 1427 | 1534 | 1775 |
| Error (%) | -4.2 | -0.11 | — | — | 1.32 | 5.04 | -0.07 | 3.61 |
The dynamic response of the hyperboloid gear system was tested under various operating conditions. Vibration acceleration responses were measured at bearing housings in transverse, longitudinal, and axial directions, as well as on the gearbox surface. For instance, at an input speed of 1000 rpm and a load of 200 N·m, acceleration spectra in the x, y, and z directions were obtained. The analysis revealed that significant peaks occurred near the mesh frequency \( f_m \), calculated as:
$$ f_m = \frac{n \times Z}{60} $$
where \( n \) is the input speed in rpm and \( Z \) is the number of pinion teeth. For \( n = 1000 \) rpm and \( Z = 7 \), \( f_m \approx 116.67 \) Hz. In the x-direction, a clear peak was observed around 117.2 Hz, corresponding to the mesh frequency, while y and z directions showed no prominent peaks at \( f_m \). However, the vibration spectra contained rich frequency components with strong signals at various frequencies, such as 546.875 Hz and 2285.156 Hz in the x-direction, 371.09 Hz and 595.7 Hz in the y-direction, and 224.6 Hz in the z-direction. This indicates modulation effects, where sidebands appear around the mesh frequency and its harmonics due to factors like gear errors and stiffness fluctuations. The absence of low-frequency signals below \( f_m \) suggests that external excitations from eccentricities and load variations were minimal, thanks to the elastic couplings used in the setup.
To quantify the vibration levels, root mean square (RMS) values of normal acceleration on the gearbox surface were calculated for representative measurement points. A comparison between experimental and theoretical values is shown in Table 2. The theoretical calculations were based on a dynamic model of the hyperboloid gear system, but discrepancies arise from simplifications in modeling complex joints and boundary conditions. Additionally, vibration displacement amplitudes at bearing housings were measured and compared with theoretical predictions, as summarized in Table 3. The errors generally fall within acceptable engineering limits, validating the theoretical approach for hyperboloid gears.
| Direction | x1 | x2 | y1 | y2 | z1 | z2 |
|---|---|---|---|---|---|---|
| Theoretical Value | 818.2 | 2309.8 | 747.59 | 786.42 | 989.77 | 1275.61 |
| Experimental Value | 915.9 | 2027.2 | 915.2 | 1020.2 | 1202.1 | 1165.1 |
| Relative Deviation (%) | 10.67 | -13.94 | 18.31 | 22.91 | 17.66 | -9.48 |
| Location | Direction | Theoretical Value | Experimental Value | Relative Deviation (%) |
|---|---|---|---|---|
| Right Bearing Housing | Horizontal (z) | -0.54 | -0.59 | 8.5 |
| Vertical (y) | 1.2 | 1.4 | 14.3 | |
| Axial (x) | 0.33 | 0.36 | 8.3 | |
| Front Bearing Housing | Horizontal (x) | -1.1 | -1.2 | 8.3 |
| Vertical (y) | 0.474 | 0.49 | 3.3 | |
| Axial (z) | -1.2 | -1.32 | 9.1 | |
| Rear Bearing Housing | Horizontal (x) | -1.6 | -1.89 | 15.3 |
| Vertical (y) | 0.087 | 0.10 | 13.0 | |
| Axial (z) | -0.456 | -0.51 | 10.6 |
Further analysis involved comparing acceleration spectra at different input speeds, such as 500 rpm and 1000 rpm. As speed increased, low-frequency components diminished while high-frequency components intensified, with no significant sub-mesh frequency peaks observed. At lower speeds, acceleration responses were dominated by harmonics of the mesh frequency, supporting the practicality of focusing on mesh frequency in dynamic analyses of hyperboloid gears. The modulation phenomena can be described mathematically by considering the vibration signal \( a(t) \) as a modulated form of the mesh frequency component:
$$ a(t) = A(t) \cos(2\pi f_m t + \phi(t)) $$
where \( A(t) \) and \( \phi(t) \) are amplitude and phase modulation functions due to time-varying parameters. The power spectral density \( S_a(f) \) then exhibits sidebands around \( f_m \) and its harmonics, which were evident in our experimental data for hyperboloid gears.
The experimental modal analysis confirmed that the natural frequencies of the hyperboloid gear system align closely with theoretical predictions, validating the finite element modeling approach when boundary conditions are appropriately handled. For instance, the first natural frequency at 752 Hz (experimental) versus 785 Hz (theoretical) shows a minor deviation, likely due to unmodeled damping or joint effects. The dynamic response tests underscored the importance of considering modulation effects in hyperboloid gear vibrations, as sidebands can influence noise and fatigue life. The use of elastic couplings effectively isolated external excitations, allowing us to attribute vibrations primarily to gear meshing dynamics, which is crucial for accurate modeling of hyperboloid gears in automotive applications.
In conclusion, this study successfully implemented experimental modal analysis and dynamic testing for hyperboloid gear transmission systems. We obtained natural frequencies and vibration responses that provide a robust database for refining theoretical models. The comparisons between experimental and theoretical values demonstrate reasonable agreement, with errors within engineering tolerances, highlighting the reliability of our methods for hyperboloid gears. Future work could involve extending the analysis to include nonlinear effects like backlash and time-varying stiffness in more detailed simulations, further enhancing the dynamic design of hyperboloid gear systems. The insights gained here contribute to the development of quieter, more durable hyperboloid gears for high-performance automotive drive axles.