
In modern automotive powertrains, particularly within drive axles, the demand for efficient, quiet, and high-load-capacity gear transmissions is paramount. Among the various gear types, hyperboloid gears (often referred to as hypoid gears) stand out due to their unique offset design between the pinion and gear axes. This configuration allows for lower mounting positions of the drive shaft, enhancing vehicle design flexibility and ground clearance. This article focuses on a specific variant: hyperboloid gears with an extended epicycloid tooth profile, commonly known as the Oerlikon or Spiroid type. Compared to the traditional Gleason circular arc design, extended epicycloid hyperboloid gears offer advantages in manufacturing efficiency and noise-vibration-harshness (NVH) performance, as roughing and finishing can be completed in a single process. The meshing behavior of these gears is the primary source of vibration and noise in a drive axle. Therefore, a deep understanding of their dynamic meshing characteristics—such as contact patterns, root bending stress, contact ratio, and transmission error—is crucial for optimal design and application. In this study, I employ a combined approach of finite element analysis (FEA) and experimental validation to comprehensively investigate these critical aspects of extended epicycloid hyperboloid gears.
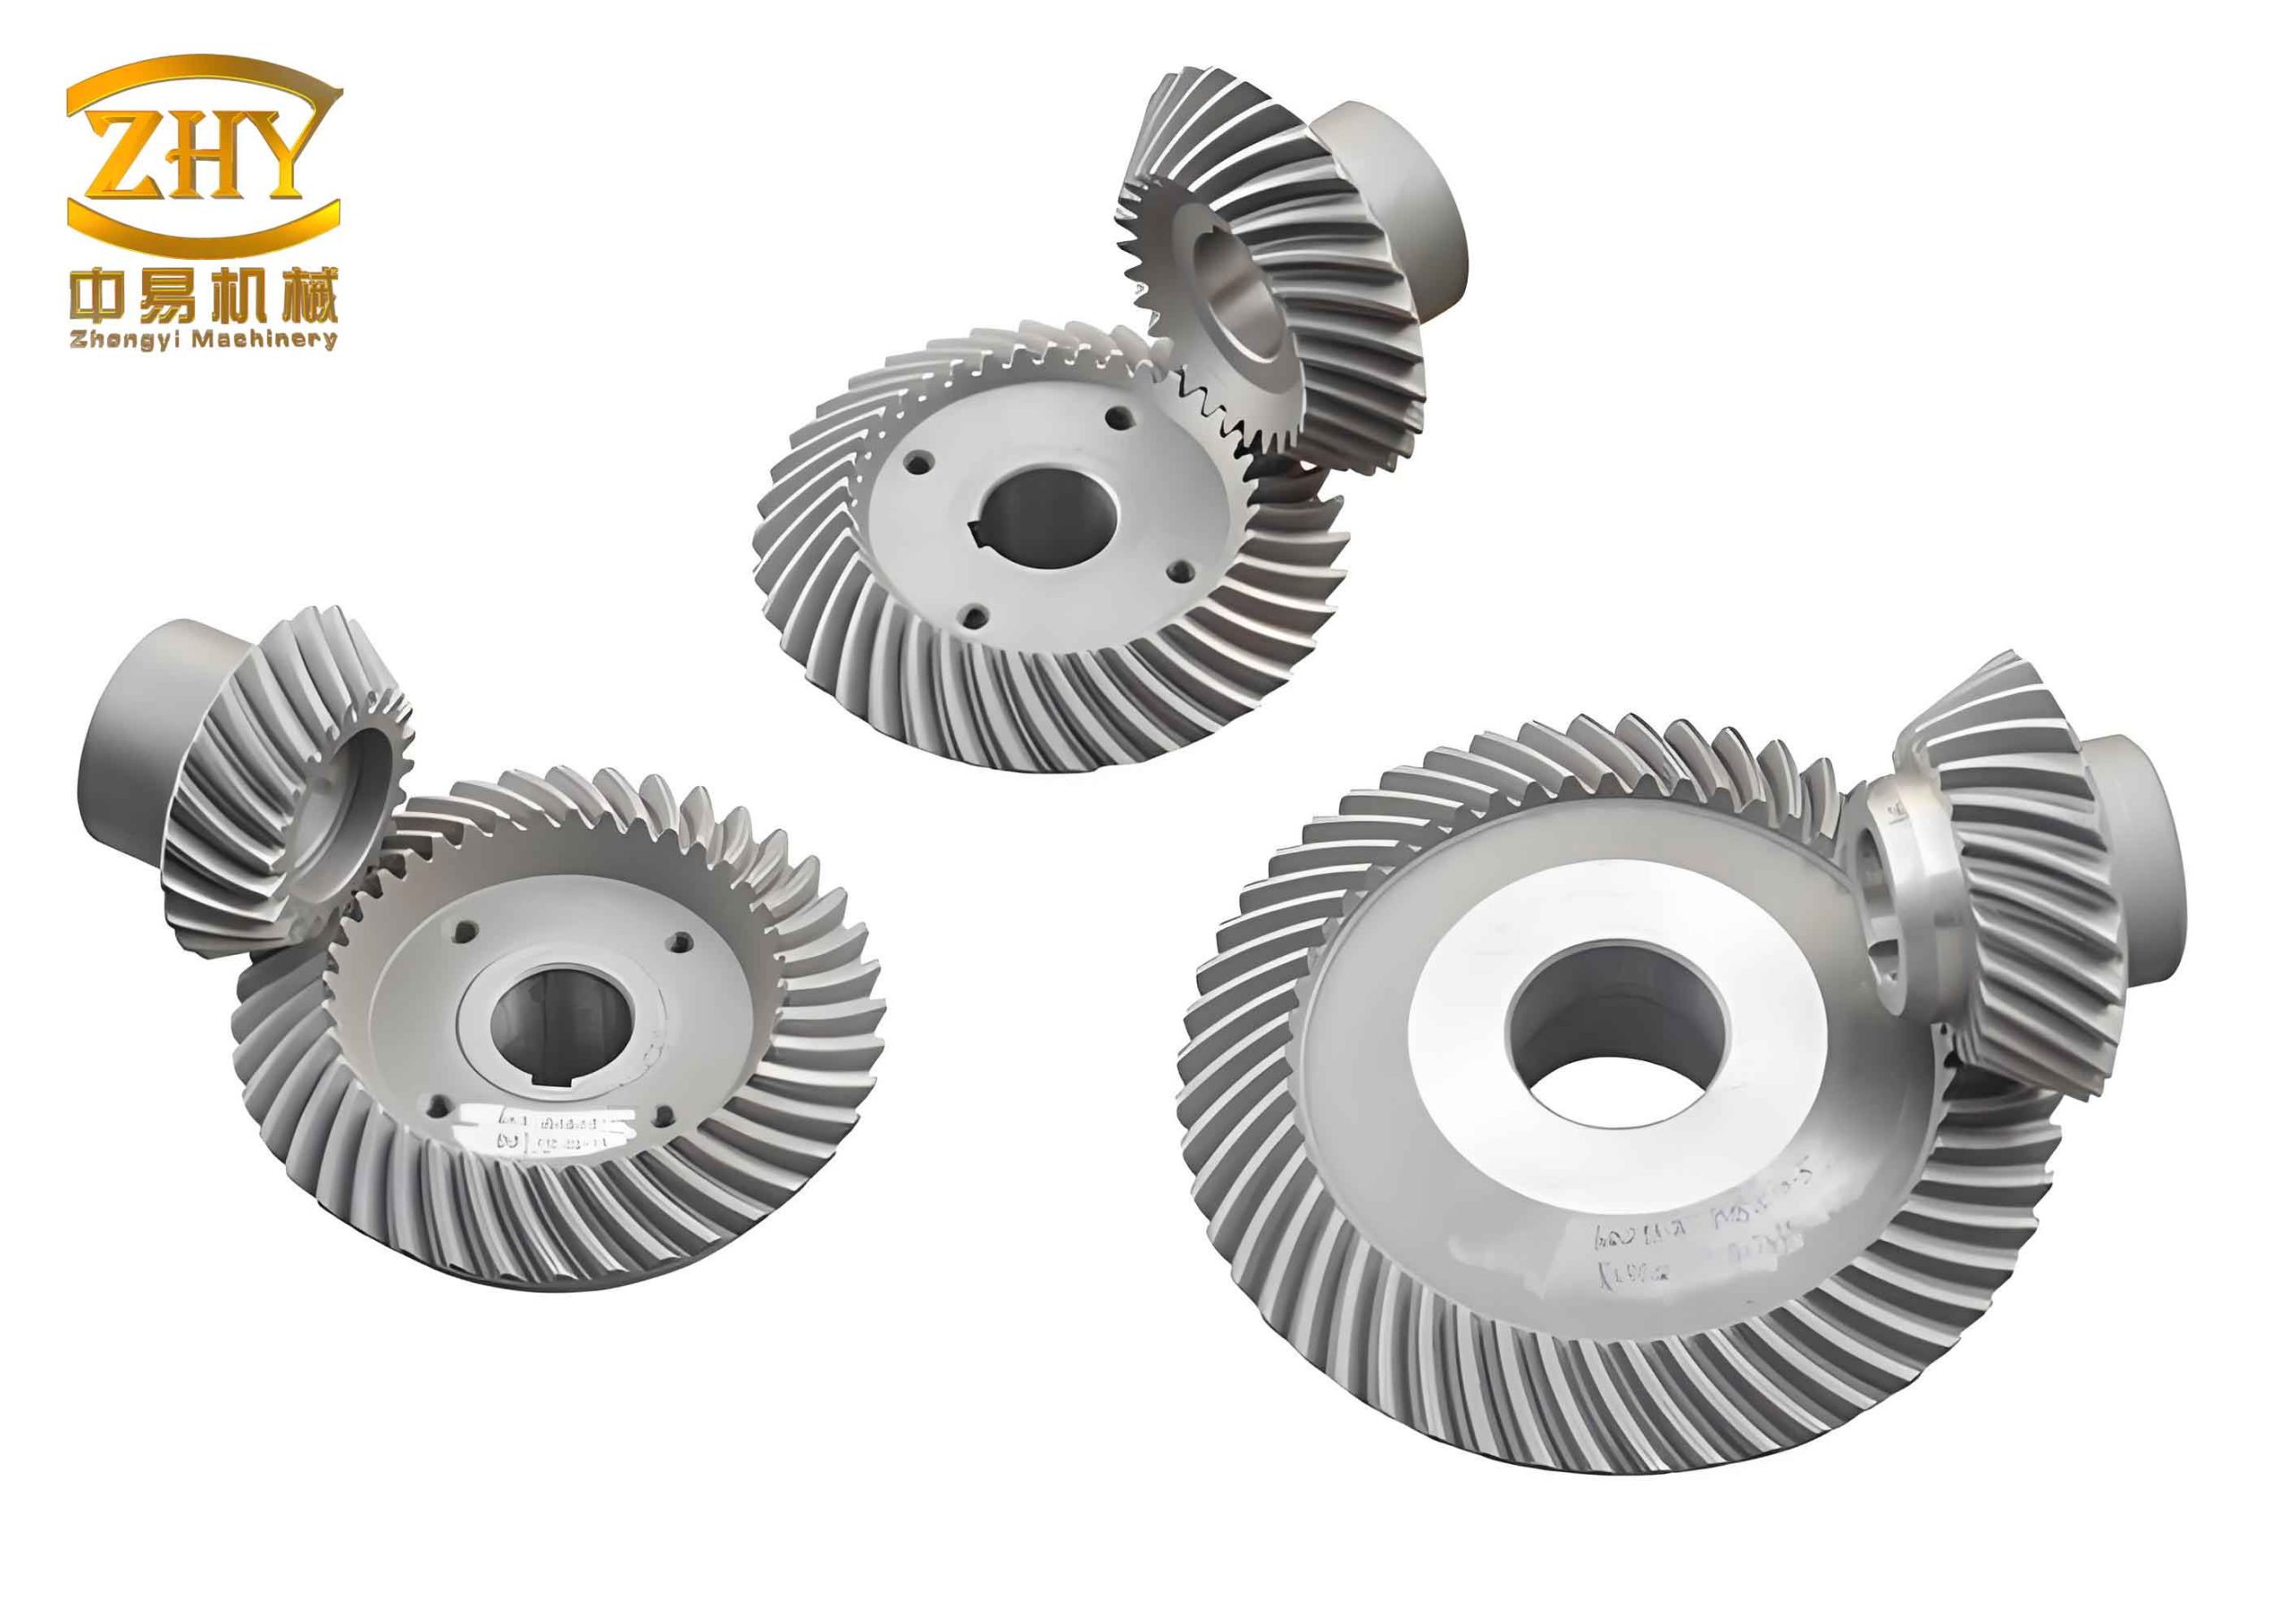
Finite Element Modeling of Hyperboloid Gears
The accuracy of a finite element simulation hinges on the quality of the model. For the analysis of hyperboloid gears, I developed a detailed three-dimensional model reflecting the complex geometry of an extended epicycloid tooth form.
Mesh Generation: Using specialized pre-processing software, I discretized the gear bodies with hexahedral (brick) elements. A critical balance was struck between mesh quality and computational cost. A fine mesh was applied in the contact regions near the tooth flanks and fillets to capture stress gradients accurately, while a coarser mesh was used in the gear hubs. Mesh quality metrics, particularly the Jacobian ratio, were checked and maintained above 0.7 to ensure numerical stability and result accuracy.
Material Properties and Boundary Conditions: The gear material was defined as a typical gear steel with linear elastic properties: Young’s modulus of 210 GPa and a Poisson’s ratio of 0.3. The model was set up to replicate a quasi-static loading condition. The gear (ring gear) was fully constrained at its bolt holes simulating its attachment to the differential housing. A rotational velocity was applied to the pinion shaft, and a resisting torque was applied to the gear shaft to simulate the load from the wheels. For dynamic characteristic analysis, the implicit dynamic solver in Abaqus was utilized due to its robustness in handling nonlinear contact problems with good convergence.
Contact Definition: Defining the interaction between the mating tooth flanks is the most critical step. A surface-to-surface contact discretization method was employed. For forward driving conditions (pinion driving the gear), the concave side of the pinion tooth and the convex side of the gear tooth were defined as the master and slave contact surfaces, respectively. The tangential behavior was modeled using a penalty friction formulation with a coefficient of 0.05-0.1, while the normal behavior was defined as “hard” contact, allowing for separation upon unloading.
| Parameter | Pinion | Gear (Ring Gear) |
|---|---|---|
| Number of Teeth | 13 | 43 |
| Module (mm) | — | — |
| Shaft Offset (mm) | 20 | |
| Hand of Spiral | Left Hand | Right Hand |
| Face Width (mm) | 38 | 36 |
| Pressure Angle | 20° | |
Analysis of Tooth Contact Pattern
The contact pattern, or the footprint of contact stress on the tooth surface under load, is a primary indicator of gear tooth alignment and load distribution. An ideal pattern is centered on the tooth flank, avoiding contact at the edges (toe, heel, top, or root).
Forward Drive (Concave/Convex Contact): The simulation results for forward driving are compiled in the figure below. The analysis reveals that at any given instant during meshing, the contact area on the tooth surface is approximately elliptical. As a single pair of teeth moves through the mesh, the area of this elliptical contact patch on the pinion’s concave surface and the gear’s convex surface increases to a maximum and then decreases. The engagement starts at the heel (larger end) of the teeth and progresses towards the toe (smaller end). This behavior is a direct consequence of the localized contact and bending deflections in hyperboloid gears. The simulated pattern aligns well with experimental patterns obtained using gear marking compound (e.g., Prussian blue), validating the contact definition in the FEA model. The evolution can be summarized as:
$$ A_{contact}(t) \approx \pi \cdot a(t) \cdot b(t) $$
where $A_{contact}(t)$ is the time-varying contact area, and $a(t)$ and $b(t)$ are the semi-major and semi-minor axes of the approximated ellipse, respectively.
Reverse Drive (Convex/Concave Contact): Under reverse driving conditions (simulating vehicle coasting or reversing), the contact flips to the opposite sides: the convex side of the pinion contacts the concave side of the gear. The simulation shows a reversal in the engagement path. The contact now initiates at the toe (small end) of the teeth and progresses towards the heel (large end). Furthermore, on the gear tooth, the contact path moves from the tip towards the root, while on the pinion, it moves from the root towards the tip. This asymmetrical behavior between forward and reverse drive is a fundamental characteristic of hyperboloid gears and significantly influences NVH performance in different driving scenarios.
Tooth Root Bending Stress Analysis
Tooth root bending fatigue is a primary failure mode for gears. Analyzing the stress state at the root fillet is therefore essential for durability assessment. Under a significant load torque (e.g., 1000 Nm), the FEA generates a detailed stress contour plot.
The results clearly show that the maximum tensile bending stress occurs at the root fillet on the side of the tooth that is not in contact (the “pull” side). The region directly under the contact zone experiences compressive stress. To understand the dynamic stress history, I tracked the principal stresses at the identified danger points (locations of peak stress) on both the pinion and gear roots over a complete mesh cycle.
The analysis reveals a distinct and opposite stress cycle for the pinion and gear:
- Pinion Root Danger Point: The stress cycle begins with a period of tensile stress as the tooth approaches the highest point of single pair contact. This is followed by a transition to compressive stress as the contact load shifts and the tooth approaches the end of engagement.
- Gear Root Danger Point: The cycle is essentially inverted. The danger point initially experiences compressive stress, which then transitions to tensile stress as the mesh cycle progresses.
This asymmetry stems from the complex combined bending and torsional loading induced by the offset shaft configuration of hyperboloid gears. The stress history can be critical for fatigue life calculation using models like:
$$ S_{eq} = \sqrt{ (\sigma_1)^2 + (\sigma_2)^2 + (\sigma_3)^2 – \sigma_1\sigma_2 – \sigma_2\sigma_3 – \sigma_3\sigma_1 } $$
where $S_{eq}$ is an equivalent (von Mises) stress and $\sigma_1, \sigma_2, \sigma_3$ are the principal stresses at the root.
| Component | Primary Stress at Danger Point | Stress Cycle Sequence | Governing Load Condition |
|---|---|---|---|
| Pinion | Tensile | Tensile → Compressive | Bending + Local Torsion |
| Gear | Tensile | Compressive → Tensile | Bending |
Loaded Contact Ratio
The contact ratio is a key metric for传动平稳性, indicating the average number of tooth pairs in contact simultaneously. A higher contact ratio generally leads to smoother operation and lower dynamic loads. For hyperboloid gears, the contact ratio is not constant but increases with applied load due to elastic deflections of the teeth and the gear bodies, which effectively elongate the contact path.
From the FEA, the time-varying normal contact forces on individual tooth pairs can be extracted. Figure 6 in the source material conceptually shows these forces. When only one pair is in contact, its force rises and falls. A contact ratio greater than 1 means a second pair comes into contact before the first pair disengages, leading to periods of dual- or even triple-pair contact, as seen in the force curves.
The loaded contact ratio ($\varepsilon_\gamma$) is calculated from the simulated contact force data:
$$ \varepsilon_\gamma = \frac{\Delta T}{\Delta t} $$
where $\Delta T$ is the duration of contact for a single tooth pair, and $\Delta t$ is the time interval between the start of engagement of successive tooth pairs.
Plotting $\varepsilon_\gamma$ against input torque reveals a clear trend. At near-zero load, the contact ratio is approximately 1. As torque increases, $\varepsilon_\gamma$ increases non-linearly, reaching values as high as 2.5 under high load. The rate of increase is steepest at lower loads and gradually tapers off at higher loads. This load-dependent behavior is a significant advantage of hyperboloid gears, contributing to their high load-carrying capacity and smooth power transmission under typical operating conditions.
| Input Torque Range (Nm) | Contact Ratio Trend | Approximate Value | Primary Mechanism |
|---|---|---|---|
| 0 – 200 | Rapid increase | 1.0 → 1.8 | Initial tooth bending and contact deflection |
| 200 – 800 | Moderate increase | 1.8 → 2.3 | Further local deflection and slight shaft/windup effects |
| 800+ | Slow increase / saturation | 2.3 → 2.5 | Saturation of elastic deformation in contact zone |
Transmission Error Analysis and Validation
Transmission error (TE) is considered the primary excitation mechanism for gear noise. It is defined as the deviation of the actual angular position of the driven gear from its theoretical position for a given angular position of the driver gear.
Definition and Significance: The mathematical expression for TE is:
$$ TE(\phi_1) = \phi_2 – \phi_{2,theory} = \phi_2 – \left( \phi_2^{(0)} – \frac{Z_1}{Z_2} (\phi_1 – \phi_1^{(0)}) \right) $$
where:
- $\phi_1, \phi_2$ are the instantaneous rotations of the pinion and gear.
- $\phi_1^{(0)}, \phi_2^{(0)}$ are their initial rotations.
- $Z_1, Z_2$ are the numbers of teeth.
A perfectly conjugate gear pair would have zero TE. In reality, manufacturing errors, intentional modifications (tip/root relief), and elastic deflections under load cause TE. The design goal is to achieve a low and smoothly varying TE curve, often with a specific parabolic shape (“design amplitude”) to optimize performance across a load range.
Finite Element Simulation Results: Simulating TE across a wide load range produces a family of curves. Key observations include:
- At very low torque (e.g., 10 Nm), the TE curve shows a pronounced parabolic profile with a peak for each mesh cycle (per pinion tooth). The amplitude is high.
- As load increases (up to ~400 Nm), the entire TE curve shifts downward, and its amplitude decreases significantly. This is due to elastic deflections compensating for initial tooth separations and errors, making meshing smoother.
- Beyond ~500 Nm, the TE amplitude reaches a minimum and then begins to increase again, forming a local maximum around ±1000 Nm. This is likely due to non-linear stiffening effects and changes in the effective contact line. At even higher loads, the amplitude slowly decreases and stabilizes.
- A clear asymmetry exists between forward and reverse drive TE amplitudes, with reverse drive generally exhibiting larger TE. This correlates with the different contact patterns and explains why vehicle coasting/rewinding noise can be more pronounced.
The relationship between TE amplitude and load is non-monotonic and can be described in phases:
| Phase | Load Range (Approx.) | TE Amplitude Trend | Dominant Physical Mechanism |
|---|---|---|---|
| I | Very Low (0-200 Nm) | Very High, Decreasing rapidly | Uncompensated manufacturing errors and tooth spacing. Deflections begin to take up slack. |
| II | Low-Medium (200-500 Nm) | Minimum (Optimum Range) | Elastic deflections optimally compensate for tooth geometry, achieving best conjugate action. |
| III | Medium-High (500-1000 Nm) | Increasing to a local peak | Non-linear contact deformation, load sharing shifts, potential mild edge contact initiation. |
| IV | High (1000+ Nm) | Slow decrease and stabilization | Full flank contact established, system behaves more linearly, deflections dominate the kinematic error. |
Experimental Validation: To validate the FEA findings, a transmission error test was conducted on a physical drive axle. The differential was locked (planetary gears welded to side gears) to ensure equal rotation of both output shafts, allowing for accurate TE measurement. Input speed and torque were controlled, and high-resolution encoders measured the angular positions of the input and output shafts. The tests were repeated at various oil temperatures to check for thermal effects, which were found to be negligible.
The experimental results for TE amplitude versus load closely match the simulation trends. The characteristic curve showing a minimum amplitude at moderate load, flanked by higher amplitudes at low and very high loads, was clearly reproduced. The agreement between the FEA and experimental data confirms the accuracy of the finite element model in capturing the complex, load-dependent meshing behavior of extended epicycloid hyperboloid gears.
Conclusion
Through a detailed finite element analysis complemented by experimental validation, this investigation has provided comprehensive insights into the meshing characteristics of extended epicycloid hyperboloid gears. The key findings are:
- Contact Pattern: The instantaneous contact area is elliptical. Its size on a single tooth flank varies during meshing, increasing to a maximum and then decreasing. The path of contact is asymmetric between forward and reverse drive, initiating at the heel and toe, respectively. This fundamental behavior must be considered in tooth flank modification design.
- Root Bending Stress: The critical failure point at the tooth root is primarily subjected to tensile stress. However, the pinion and gear experience opposite stress cycles (tensile-to-compressive vs. compressive-to-tensile), a direct result of the offset shaft geometry and complex loading in hyperboloid gears. This asymmetry should inform fatigue life calculations.
- Loaded Contact Ratio: The contact ratio is highly load-dependent, increasing from a nominal value of 1 at no load to over 2.3 under high load. This increase enhances load sharing and contributes to the smooth, high-capacity performance of hyperboloid gears.
- Transmission Error: TE is the most load-sensitive characteristic. Its amplitude exhibits a non-monotonic relationship with torque: high at very low load, reaching a minimum at a moderate “design” load, increasing slightly to a local peak, and then stabilizing at high load. Reverse drive typically produces higher TE amplitude than forward drive. This complex relationship underscores the importance of designing tooth modifications for a targeted load range to minimize NVH excitation.
The strong correlation between simulation and experimental results validates the employed finite element methodology. These findings provide crucial guidance for the design, application, and noise optimization of hyperboloid gears in automotive drive axles and other power transmission systems. Future work could integrate these meshing characteristics into system-level dynamic models to predict gear whine and rattle under real vehicle operating conditions.