
As a mechanical engineering researcher specializing in gear dynamics, I have always been fascinated by the critical role that spur and pinion gear pairs play in various transmission systems. These components are ubiquitous in reducers, increasers, and speed changers, where their performance directly dictates the efficiency, noise levels, and longevity of the entire machinery. In my recent work, I focused on investigating the dynamic characteristics of a specific spur and pinion gear transmission system through computational simulation. The primary challenge in such studies is the difficulty and high cost associated with physically measuring dynamic parameters like rotational speed and meshing force under operational conditions. Therefore, I turned to advanced multi-body dynamics software to create a virtual prototype, enabling a detailed analysis that would be impractical in a purely experimental setup. This article chronicles my methodology, findings, and insights from this simulation-based investigation into the behavior of spur and pinion gears.
The core of my study was a single-stage, speed-reducing spur and pinion gear pair. In this system, the smaller pinion acts as the driver, transmitting motion and power to the larger driven spur gear, thereby reducing rotational speed and increasing torque. To begin, I defined the precise geometrical parameters for both gears, which are summarized in Table 1. These parameters served as the foundation for all subsequent modeling and analysis steps.
| Component | Number of Teeth, \( z \) | Module, \( m \) (mm) | Pressure Angle, \( \alpha \) (°) | Face Width, \( b \) (mm) |
|---|---|---|---|---|
| Pinion (Driver) | 30 | 3 | 20 | 50 |
| Spur Gear (Driven) | 70 | 3 | 20 | 50 |
Using these values, fundamental gear geometry can be calculated. The pitch diameter \( d \) for each gear is given by \( d = m \cdot z \). Therefore, for the pinion, \( d_p = 3 \times 30 = 90 \) mm, and for the spur gear, \( d_g = 3 \times 70 = 210 \) mm. The theoretical gear ratio \( i \) is simply the ratio of the number of teeth: $$ i = \frac{z_g}{z_p} = \frac{70}{30} \approx 2.333 $$ This ratio predicts that the output speed of the spur gear will be approximately 2.333 times slower than the input speed of the pinion, while the output torque will be multiplied by the same factor, neglecting losses.
With the parameters established, I proceeded to create a detailed three-dimensional solid model. I utilized SolidWorks, a powerful CAD software, to model the pinion and spur gear individually based on the standard involute tooth profile defined by the module and pressure angle. The modeling process ensured accurate tooth geometry, which is paramount for realistic contact simulation. After modeling, I assembled the two gears with the correct center distance, which is half the sum of their pitch diameters: $$ a = \frac{d_p + d_g}{2} = \frac{90 + 210}{2} = 150 \text{ mm} $$. The assembled model visually represented the meshing engagement of the spur and pinion pair.
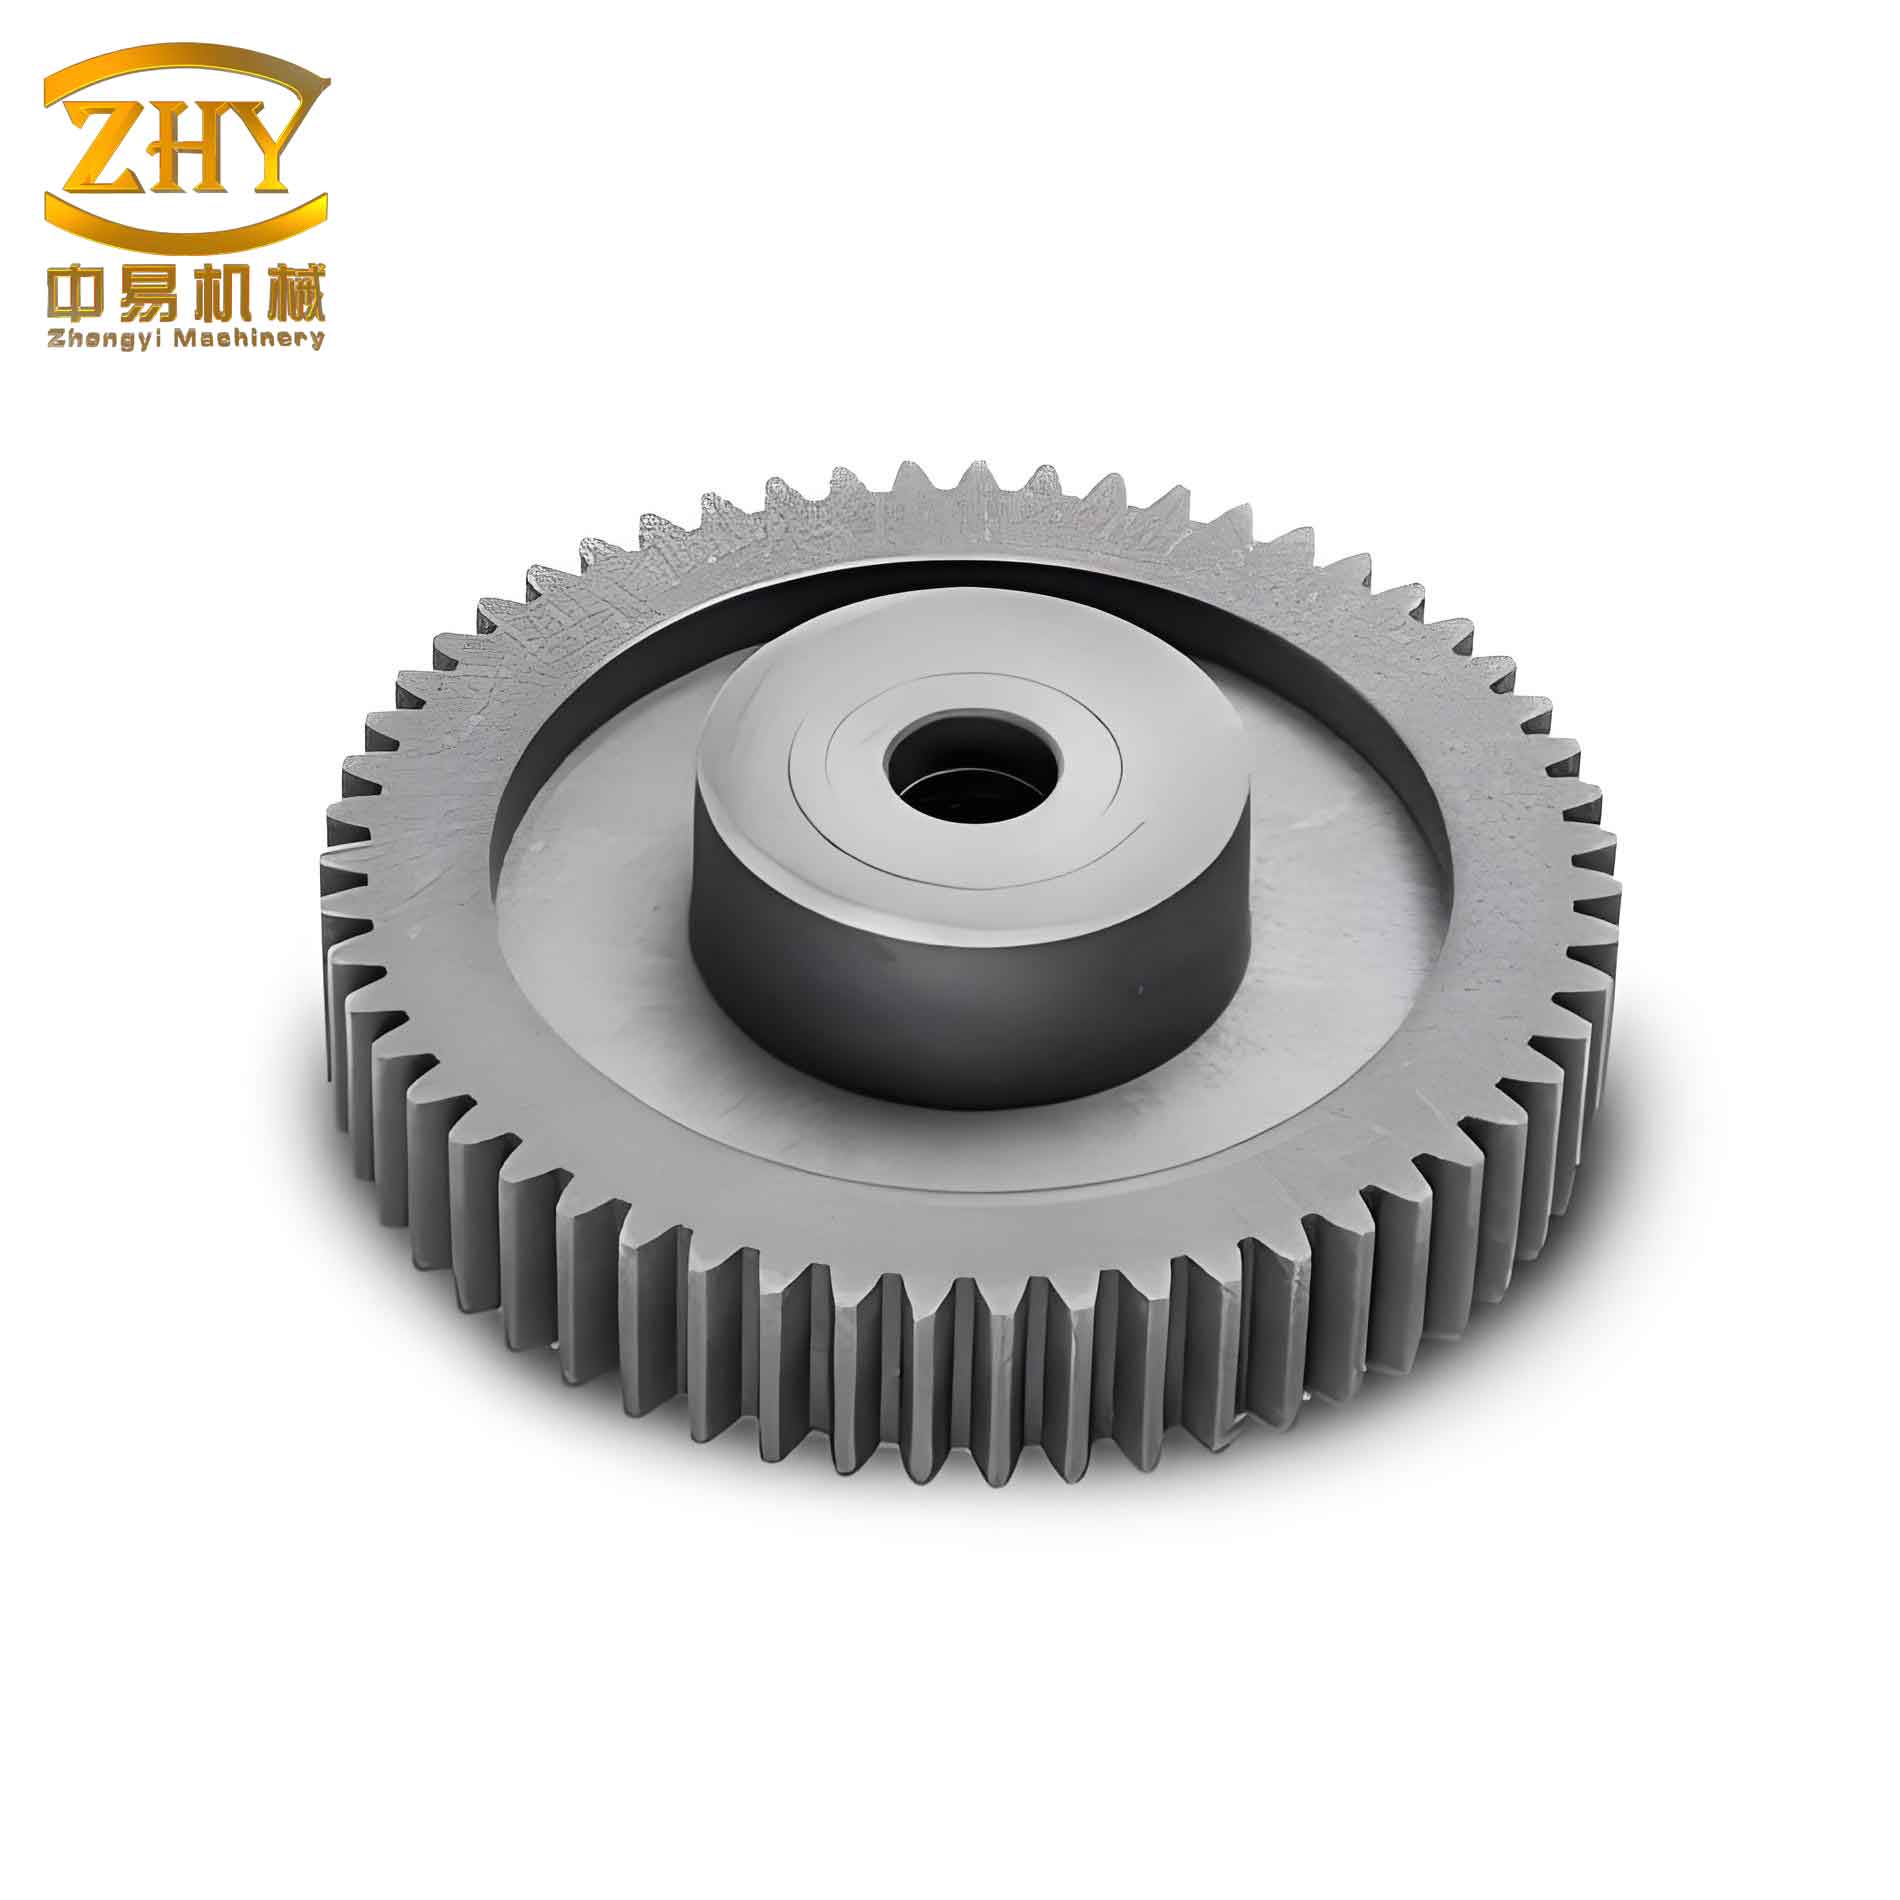
This visual representation underscores the fundamental interaction in a spur and pinion system. The next and most crucial step was to transform this geometric model into a dynamic one. I exported the assembly in Parasolid (X_T) format, a neutral format well-suited for data exchange, and imported it into ADAMS (Automatic Dynamic Analysis of Mechanical Systems), a leading multi-body dynamics software. In ADAMS, my goal was to build a simulation model that could replicate the physical dynamics of the spur and pinion gear pair under load.
Constructing an accurate dynamic model requires more than just geometry; it necessitates defining material properties, constraints, forces, and most importantly, the contact mechanism between the teeth. Both the pinion and spur gear were assigned material properties corresponding to 40Cr steel, a common alloy for high-strength gears. The key material properties I defined are listed in Table 2.
| Property | Value | Unit |
|---|---|---|
| Density, \( \rho \) | 7820 | kg/m³ |
| Young’s Modulus, \( E \) | 211 | GPa |
| Poisson’s Ratio, \( \nu \) | 0.3 | – |
| Stiffness Coefficient, \( k \) | 8.7 × 10⁵ | N/mm |
| Damping Coefficient, \( c \) | 12.5 | N·s/mm |
To simulate the tooth contact force, I employed the Impact function in ADAMS. This function calculates a normal force based on the penetration depth between two contacting geometries, combining a spring-like stiffness force and a damping force. The general form of the Impact force model is: $$ F_n = k \cdot \delta^e + \text{STEP}( \delta, 0, 0, d_{\text{max}}, c_{\text{max}}) \cdot \dot{\delta} $$ where \( F_n \) is the normal contact force, \( k \) is the stiffness coefficient, \( \delta \) is the penetration depth, \( e \) is the force exponent, \( \dot{\delta} \) is the penetration velocity, and the STEP function activates damping up to a maximum value \( c_{\text{max}} \) when penetration exceeds a threshold \( d_{\text{max}} \). For my spur and pinion model, I configured the contact parameters as follows: force exponent \( e = 6.5 \), penetration depth for full damping \( d_{\text{max}} = 0.1 \) mm, static friction coefficient = 0.08, dynamic friction coefficient = 0.05, stiction transition velocity = 0.1 mm/s, and friction transition velocity = 8.5 mm/s.
I applied the necessary kinematic constraints. The pinion was connected to the ground via a revolute joint at its center and was assigned rotational motion. The spur gear was also connected to the ground with a revolute joint at its center but was free to rotate under the driving action of the pinion. To simulate a realistic operational scenario, I applied both motion and load to the pinion. The input rotational speed was defined using a STEP function to ensure a smooth start-up, ramping from 0 to 2450 °/s (approximately 408.3 RPM or 42.75 rad/s) over 0.3 seconds and then remaining constant: $$ \omega_{\text{input}}(t) = \text{STEP}(time, 0, 0, 0.3, 2450) \, ^\circ/\text{s} $$. Simultaneously, a resistive torque (load) was applied to the pinion shaft, also using a STEP function to increase smoothly from 0 to 450 N·m over the same 0.3-second period: $$ T_{\text{load}}(t) = \text{STEP}(time, 0, 0, 0.3, 450) \, \text{N·m} $$. This gradual loading mimics real-world conditions and prevents numerical instabilities in the simulation.
The simulation was run for a total time of 0.4 seconds with 1500 steps, providing a high-resolution time history of the dynamic response. The results from this simulation form the core of my analysis. Let’s first examine the input conditions. Figure 1 shows the applied input speed to the pinion, and Figure 2 shows the applied load torque. The curves confirm the smooth, stepped increase to steady-state values, which is crucial for obtaining stable and meaningful dynamic data after the transient phase.
The primary output of interest was the rotational speed of the driven spur gear. According to the theoretical gear ratio \( i \), with a steady input speed of \( \omega_p = 2450 \, ^\circ/\text{s} \), the expected output speed should be $$ \omega_g^{\text{theoretical}} = \frac{\omega_p}{i} = \frac{2450}{70/30} = 1050 \, ^\circ/\text{s} $$. The simulation result for the spur gear’s angular velocity is plotted in Figure 3. As anticipated, it follows the input trend, rising smoothly and then stabilizing. The steady-state value oscillates around a mean of approximately 1051.4 °/s. This is in excellent agreement with the theoretical value of 1050 °/s, with a negligible error of about 0.13%. This close match validates the kinematic accuracy of my spur and pinion simulation model. However, the plot reveals a crucial dynamic characteristic: the output speed is not constant but exhibits periodic fluctuations. These fluctuations are intrinsic to the gear meshing process. As tooth pairs engage and disengage, and due to time-varying mesh stiffness and transmission error, slight variations in instantaneous velocity occur, leading to these oscillations. This phenomenon is a primary source of vibration and noise in spur and pinion drives.
The dynamic meshing force between the teeth of the spur and pinion is arguably the most critical parameter for assessing load capacity, wear, and noise generation. The theoretical static tangential force on the pinion can be estimated from the applied torque and its pitch radius \( r_p = d_p/2 = 45 \) mm: $$ F_t^{\text{theoretical}} = \frac{T_{\text{load}}}{r_p} = \frac{450}{0.045} = 10,000 \, \text{N} $$. However, this is a static calculation. The dynamic meshing force from the ADAMS simulation, which accounts for impact, inertia, and vibration, is presented in Figure 4. After the initial transient, the force stabilizes but shows significant periodic oscillations around a mean value of approximately 10,650 N. This mean value is about 6.5% higher than the simple static calculation, highlighting the importance of dynamic analysis. The oscillatory nature is even more pronounced than in the speed plot. Each peak corresponds to events in the meshing cycle, such as the engagement of a new tooth pair. The frequency of these oscillations is directly related to the gear rotational speed and the number of teeth. For a pinion rotating at \( \omega_p = 42.75 \) rad/s (or \( f_p = \omega_p / 2\pi \approx 6.8 \) Hz) with \( z_p = 30 \) teeth, the tooth meshing frequency (TMF) is: $$ f_{\text{mesh}} = f_p \cdot z_p = 6.8 \times 30 = 204 \, \text{Hz} $$. This fundamental meshing frequency and its harmonics are expected to dominate the dynamic response.
To delve deeper into the frequency-domain characteristics of the spur and pinion system, I performed a Fast Fourier Transform (FFT) on the steady-state portion of the dynamic meshing force signal. The resulting amplitude spectrum is shown in Figure 5. The spectrum confirms the presence of distinct peaks at specific frequencies. The largest peak is observed at approximately 200 Hz, which aligns very closely with the calculated meshing frequency of 204 Hz. This is the primary excitation frequency caused by the periodic tooth engagement. Significant peaks are also observed at integer multiples (harmonics) of this frequency, such as around 400 Hz, 600 Hz, and notably, a very prominent peak near 1750 Hz. This high-frequency peak, likely corresponding to a higher harmonic or a structural natural frequency, indicates a potential resonance risk. The amplitude of the dynamic meshing force varies significantly with frequency. At 200 Hz and 1750 Hz, the force amplitude is particularly high. This finding is critical for design: when designing supporting components like shafts, bearings, and the gearbox housing for this spur and pinion pair, their natural frequencies should be carefully tuned to avoid coincidence with these high-amplitude excitation frequencies. If a component’s natural frequency matches 200 Hz or 1750 Hz, resonance could occur, leading to dramatically amplified vibrations, elevated noise levels, and accelerated fatigue failure.
My simulation also allowed for the analysis of other dynamic aspects. For instance, the contact pressure distribution on the tooth flanks of the spur and pinion could be inferred, although ADAMS is primarily a multi-body dynamics tool and not a dedicated contact stress analyzer like FEM software. The cyclic variation in meshing force directly relates to the fluctuation in transmitted torque and the resulting torsional vibration in the shaft connecting the spur gear. This torsional vibration is another contributor to system noise and can affect connected equipment.
The comprehensive results from this ADAMS-based dynamics simulation of a spur and pinion gear pair lead to several important conclusions. First, the methodology of applying a smooth, gradual load and motion input is not just a numerical convenience but reflects good engineering practice. It minimizes shock loads during startup, leading to more stable dynamics and more representative steady-state data. Second, the dynamic behavior of spur and pinion gears is inherently oscillatory. Both the output speed and, more critically, the tooth meshing force exhibit periodic fluctuations around their mean values. These fluctuations are the root cause of gear whine and vibration. My simulation successfully captured these oscillations, with mean values closely matching theoretical predictions, thereby validating the model’s fidelity. Third, frequency-domain analysis is indispensable. The dynamic meshing force is not a single-frequency sinusoid but a complex waveform rich in harmonics. My analysis identified the fundamental meshing frequency and its harmonics, pinpointing specific frequencies (like 200 Hz and 1750 Hz) where excitation force amplitude is highest. This information is vital for a proactive noise and vibration control strategy. Designers must ensure that the natural frequencies of all system components are separated from these high-amplitude excitation frequencies to avoid resonant conditions, which can be catastrophic. Finally, this simulation-based approach offers a powerful, cost-effective alternative to physical prototyping for analyzing the dynamic performance of spur and pinion gears. It enables engineers to explore the effects of parameter changes—such as modifying the module, pressure angle, or adding profile modifications like tip relief—on dynamic load and vibration before manufacturing a single part.
In summary, my investigation into the dynamics of a spur and pinion gear pair using ADAMS has provided profound insights. The study underscores that optimizing such gears for quiet and reliable operation requires a deep understanding of their transient and steady-state dynamic response, not just static strength calculations. The techniques and findings presented here form a solid foundation for further work, including the optimization of tooth micro-geometry for reduced transmission error, the integration of gear dynamics with full transmission system models, and the exploration of different lubrication and damping strategies. The spur and pinion gear, in its simplicity, presents a rich field of dynamical study whose outcomes are fundamental to advancing mechanical power transmission technology.
To further illustrate the quantitative relationships, key formulas governing spur and pinion gear dynamics are summarized below:
1. Gear Ratio: $$ i = \frac{\omega_p}{\omega_g} = \frac{z_g}{z_p} $$
2. Pitch Diameter: $$ d = m \cdot z $$
3. Center Distance: $$ a = \frac{m(z_p + z_g)}{2} $$
4. Theoretical Tangential Force (Static): $$ F_t = \frac{2T}{d} $$
5. Tooth Meshing Frequency: $$ f_{\text{mesh}} = \frac{\omega_p}{2\pi} \cdot z_p = \frac{\omega_g}{2\pi} \cdot z_g $$
6. Dynamic Contact Force (Simplified Spring-Damper Model): $$ F_n(t) = k [x(t)]^e + c \dot{x}(t) $$ where \( x(t) \) is the penetration.
These equations, combined with the simulation data, provide a comprehensive toolkit for analyzing and predicting the behavior of spur and pinion gear systems under dynamic operating conditions.