
In the field of mechanical power transmission, the spur gear and its mating pinion represent a fundamental and critical component. Their operational reliability directly dictates the performance and service life of entire systems, from automotive drivetrains to industrial machinery. Among various failure modes, cracking within the gear teeth is particularly insidious. It acts as a primary failure mechanism and often serves as a precursor to more catastrophic events such as tooth spalling or complete fracture. Therefore, a profound understanding of crack initiation sites, propagation paths, and, crucially, the prediction of residual life for a cracked spur and pinion is paramount for implementing effective predictive maintenance strategies and enhancing overall system safety. This study delves into the fracture mechanics of an involute spur and pinion system, employing advanced numerical simulation to model crack behavior and ultimately develop a robust model for fatigue life estimation. The focus is squarely on the spur and pinion interaction, analyzing the stress fields they generate to pinpoint where cracks are most likely to begin their destructive journey.
The core theoretical framework for analyzing stable crack growth is founded on fracture mechanics. For a spur and pinion undergoing cyclic loading, the crack propagation rate during the stable phase is most commonly described by the Paris-Erdogan law, universally referred to as the Paris law. This empirical relationship establishes a direct connection between the crack growth increment per loading cycle and the range of the stress intensity factor at the crack tip. The governing equation is:
$$
\frac{da}{dN} = C (\Delta K)^m
$$
Here, $a$ denotes the crack length, $N$ is the number of loading cycles, and $C$ and $m$ are material constants that must be determined experimentally for the specific alloy used in the spur and pinion. The parameter $\Delta K$ is the stress intensity factor (SIF) range, defined as $\Delta K = K_{\text{max}} – K_{\text{min}}$, where $K_{\text{max}}$ and $K_{\text{min}}$ are the maximum and minimum SIF values experienced during one complete meshing cycle of the spur and pinion. The stress intensity factor itself is a cornerstone of linear elastic fracture mechanics (LEFM), quantifying the magnitude of the stress field near the tip of a sharp crack. For mode-I (opening mode) cracks, which are dominant in gear tooth bending fatigue, it is expressed as $K_I = Y \sigma \sqrt{\pi a}$, where $Y$ is a geometry-dependent factor and $\sigma$ is the applied far-field stress.
Integrating the Paris law allows us to formulate the total life, in cycles, from an initial crack size $a_0$ to a critical size $a_{th}$ (often associated with the onset of unstable fracture):
$$
N = \int_{a_0}^{a_{th}} \frac{1}{C (\Delta K)^m} \, da
$$
The central challenge in applying this formula to a complex geometry like a spur and pinion lies in accurately determining the functional relationship $\Delta K = f(a)$. This function is not trivial, as the geometric correction factor $Y$ changes significantly as the crack propagates through the non-uniform stress field of the tooth root. This study aims to derive this relationship through detailed finite element analysis for a specific spur and pinion pair.
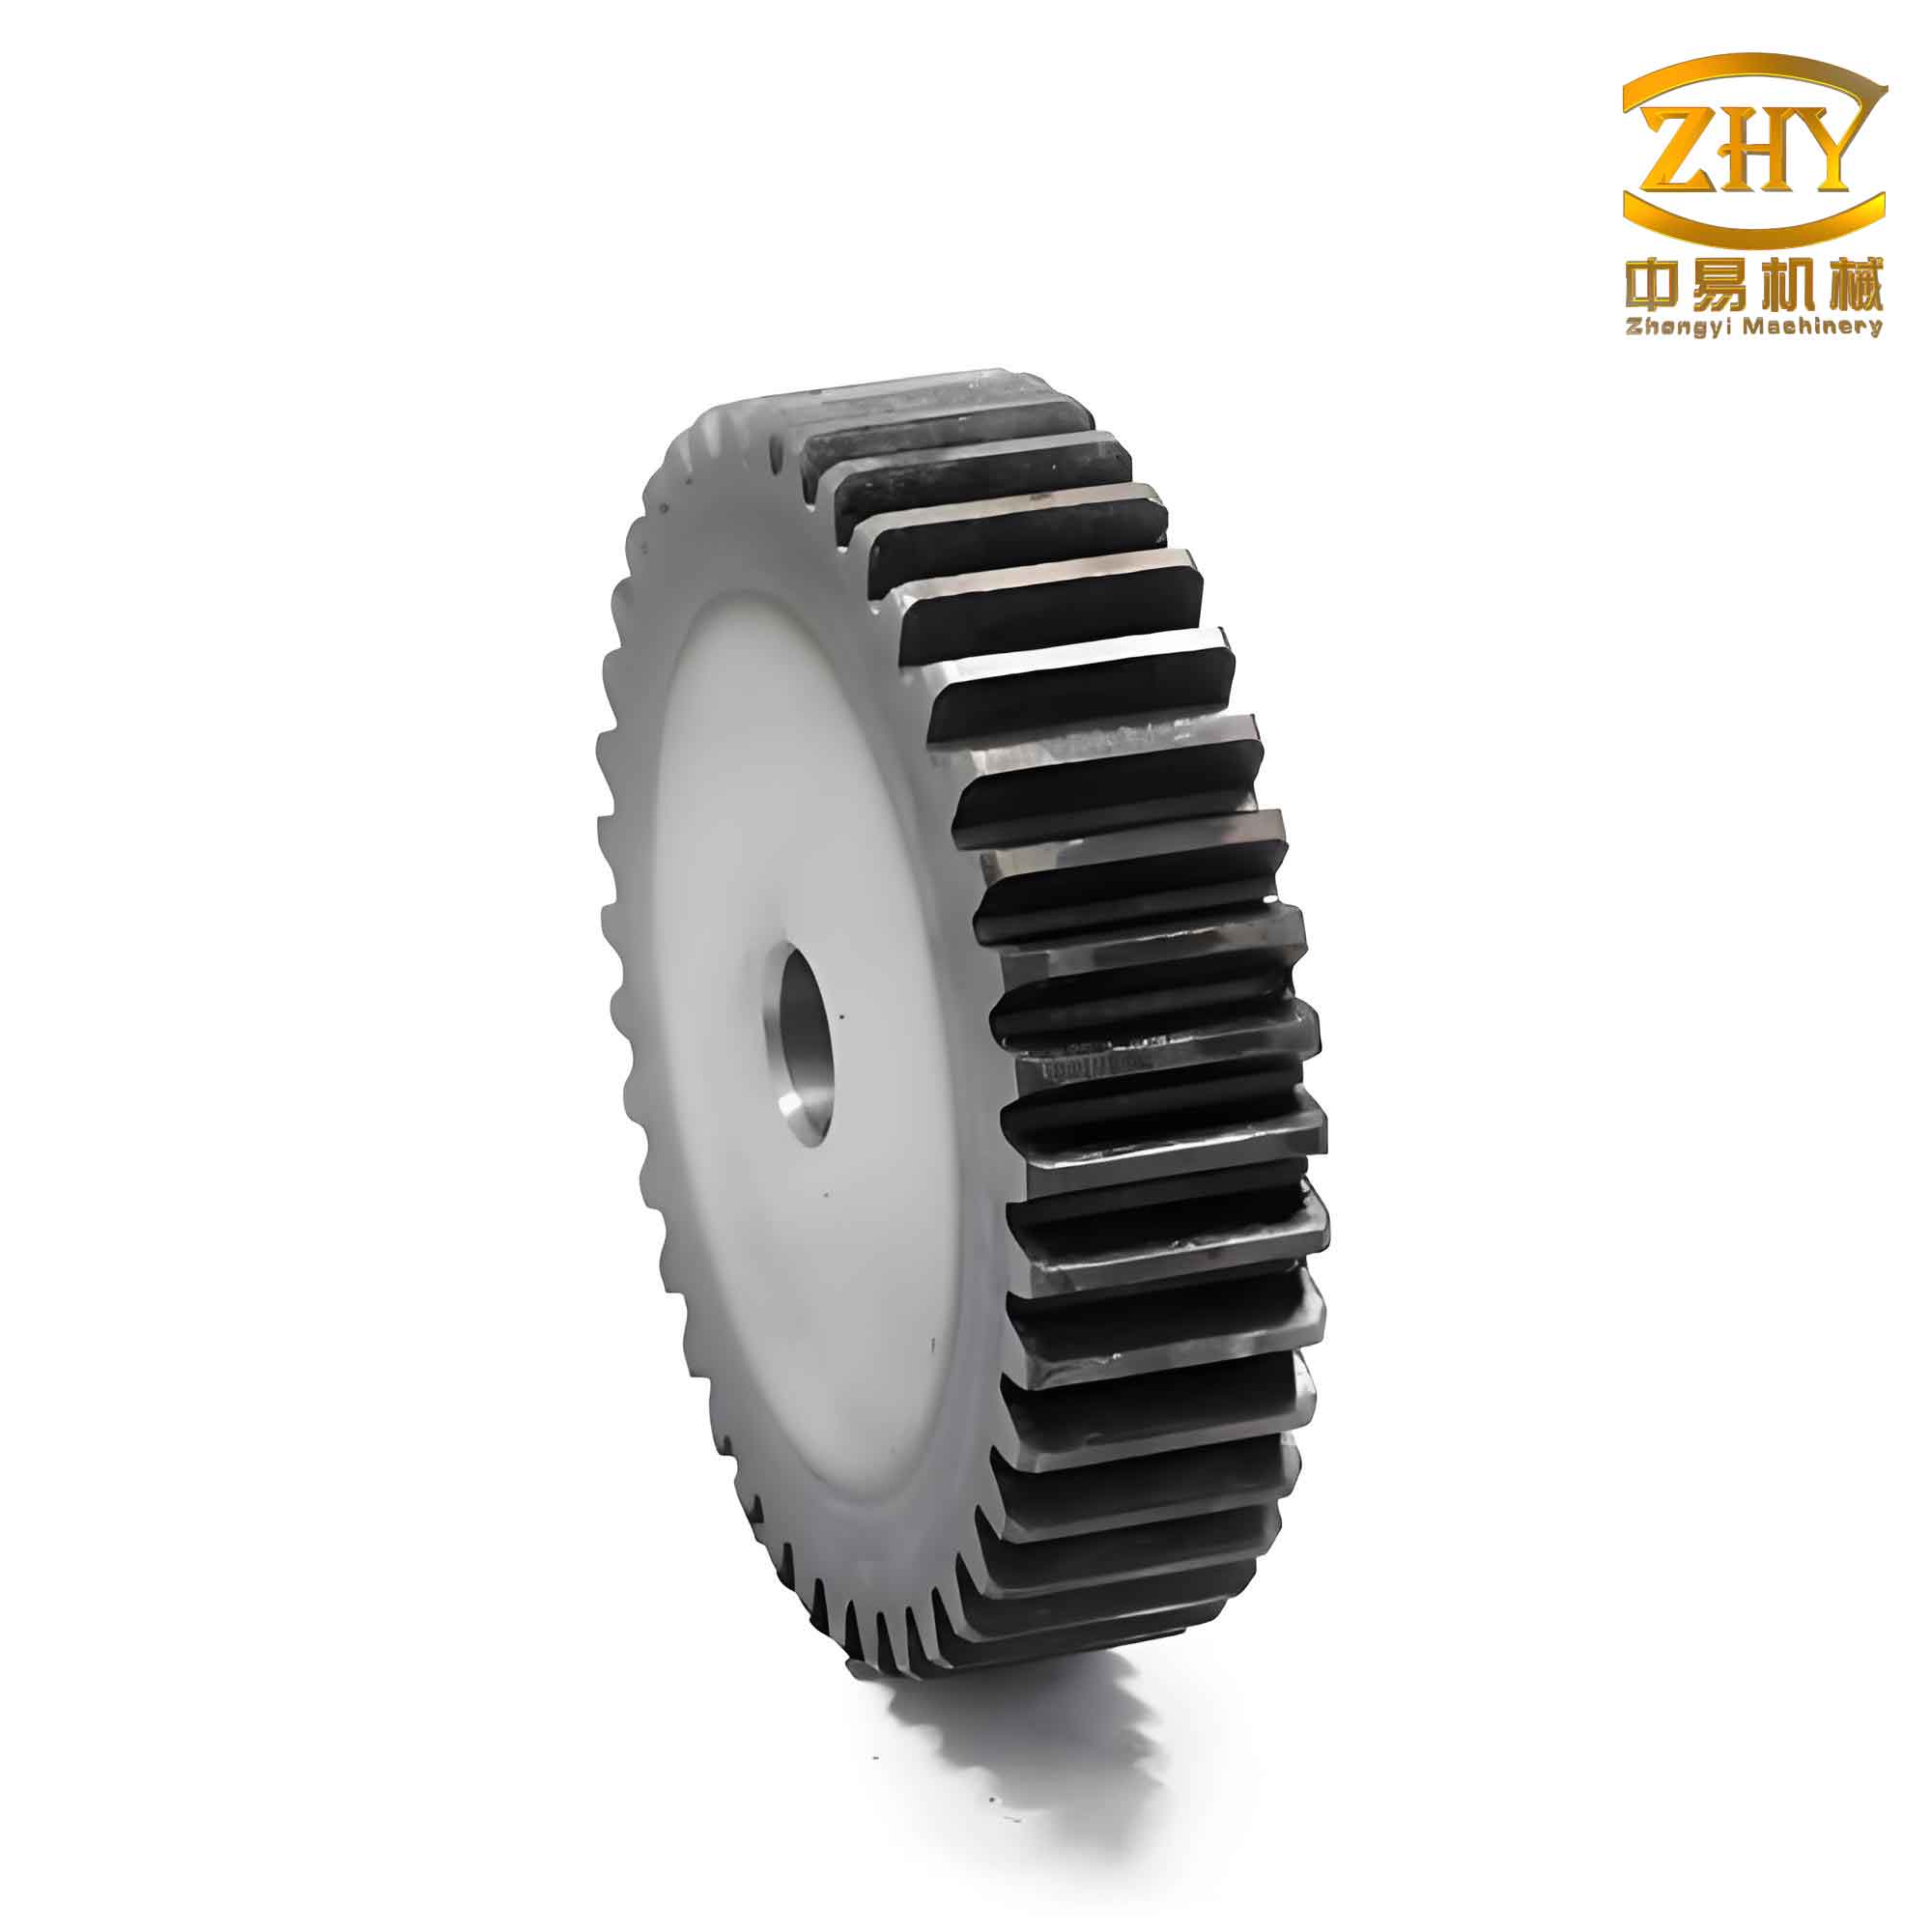
The first step in our investigation involves the precise definition of the spur and pinion system under study. A three-dimensional model of a gear pair was created. The primary geometric parameters defining this spur and pinion are summarized in Table 1. The material selected for both gears is a common gear steel, 20CrNiMo, chosen for its high strength and good hardenability. Its relevant mechanical and fracture properties are listed in Table 2. These parameters are essential inputs for both the stress analysis and the subsequent life prediction model for the spur and pinion.
| Component | Number of Teeth | Module (mm) | Pressure Angle (Degrees) | Face Width (mm) |
|---|---|---|---|---|
| Pinion (Driver) | 18 | 2 | 20 | 20 |
| Spur Gear (Driven) | 27 | 2 | 20 | 20 |
| Property | Value |
|---|---|
| Material | 20CrNiMo |
| Young’s Modulus, $E$ | 205 GPa |
| Poisson’s Ratio, $\nu$ | 0.29 |
| Paris Constant, $C$ | 4.77 × 10⁻⁹ (MPa√m context) |
| Paris Exponent, $m$ | 2.06 |
To identify the most vulnerable location for crack initiation in the spur and pinion, a static stress analysis was performed. A constant rotational speed was applied to the pinion, and a resisting torque of 10,000 N·mm was applied to the spur gear, simulating a typical load condition. The finite element analysis reveals the von Mises stress distribution throughout the meshing cycle. The results consistently show that, aside from the high contact stresses at the immediate point of contact between the spur and pinion teeth, the region of maximum tensile stress is located at the root fillet of the loaded side of the gear tooth. This is a well-documented phenomenon: as the tooth of the spur gear comes into contact with the pinion, it acts as a cantilever beam, with the root fillet experiencing the highest bending stress concentration. This area is therefore unequivocally identified as the prime site for fatigue crack nucleation in the spur and pinion system. The cyclic nature of this bending stress, repeated with every tooth engagement, drives the fatigue process.
Having established the initiation site, the next phase focuses on modeling the crack propagation path. For this purpose, the eXtended Finite Element Method (XFEM) available within ABAQUS was employed. XFEM allows for modeling discontinuous features like cracks without requiring the mesh to conform to the crack geometry, making it highly efficient for simulating crack growth. An initial seed crack was introduced at the highest-stress point on the root fillet of one tooth on the spur gear. The simulation then calculated the direction of crack propagation based on a chosen fracture criterion—in this case, the maximum principal stress criterion, which postulates that the crack grows in a direction perpendicular to the maximum tensile principal stress. The interaction with the pinion was maintained throughout the simulation to ensure accurate loading conditions.
The simulated crack path for the spur gear tooth is highly instructive. The crack initiates at the root fillet and propagates inward at a steep angle relative to the tooth centerline. As it grows longer, the path gradually curves, tending to align itself along a path that ultimately would lead to either a tooth break-off or a crack propagating into the gear rim. This curved path is a direct consequence of the changing stress field within the tooth as the crack alters the local stiffness and load path. This simulated behavior aligns with empirical observations of failure in spur and pinion sets, validating the modeling approach.
To feed the Paris law, the stress intensity factor at the crack tip must be quantified at various stages of growth. The finite element model, equipped with interaction integral techniques, was used to compute the mode-I stress intensity factor, $K_I$, for several discrete crack lengths along the predicted path. The SIF range, $\Delta K$, is the driving force for fatigue crack growth. For a complete meshing cycle where the tooth goes from unloaded to fully loaded and back, $K_{\text{min}} \approx 0$, implying $\Delta K \approx K_{\text{max}}$. The computed values of $\Delta K$ for corresponding crack lengths $a$ (measured from the initial crack seed) are presented in Table 3. These data points form the empirical foundation for establishing the $\Delta K = f(a)$ relationship.
| Data Point | Crack Length, $a$ (mm) | SIF Range, $\Delta K$ (MPa√m) |
|---|---|---|
| 1 | 0.10 | 35.2 |
| 2 | 0.15 | 37.8 |
| 3 | 0.22 | 40.1 |
| 4 | 0.30 | 43.5 |
| 5 | 0.40 | 47.9 |
| 6 | 0.52 | 53.8 |
| 7 | 0.66 | 61.5 |
| 8 | 0.82 | 71.8 |
| 9 | 1.00 | 85.5 |
| 10 | 1.20 | 104.1 |
| 11 | 1.42 | 129.5 |
| 12 | 1.66 | 164.8 |
| 13 | 1.92 | 214.0 |
| 14 | 2.20 | 284.0 |
| 15 | 2.50 | 385.0 |
The relationship between $\Delta K$ and $a$ is not linear. A logical step is to propose a mathematical function that best fits this data. Based on the underlying theory of fracture mechanics and the typical shape of the data trend, several candidate functions were evaluated: a linear function, a power-law function, a polynomial function (3rd order), and an exponential function. The first 10 data points from Table 3 were used for fitting the model parameters. The resulting functions are:
Linear: $$\Delta K_{lin}(a) = \alpha_1 a + \beta_1$$
Power-law: $$\Delta K_{pow}(a) = \alpha_2 a^{\beta_2}$$
Polynomial (3rd order): $$\Delta K_{poly}(a) = \alpha_3 a^3 + \beta_3 a^2 + \gamma_3 a + \delta_3$$
Exponential: $$\Delta K_{exp}(a) = \alpha_4 e^{\beta_4 a}$$
The quality of each fit was assessed using two statistical metrics: the Coefficient of Determination ($R^2$) and the Relative Error ($RE$) for the out-of-sample data points (points 11-15). The $R^2$ values, indicating the proportion of variance explained by the model, are summarized in Table 4. The relative errors for the validation set are detailed in Table 5.
| Fitted Function | Coefficient of Determination ($R^2$) |
|---|---|
| Exponential | 0.9502 |
| Polynomial (3rd Order) | 0.9487 |
| Linear | 0.9400 |
| Power-Law | 0.9176 |
| Data Point | Exponential | Power-Law | Polynomial | Linear |
|---|---|---|---|---|
| 11 | -0.38 | -0.38 | -3.46 | 0.47 |
| 12 | 7.36 | 5.86 | 0.79 | 7.91 |
| 13 | 0.97 | -1.73 | -8.42 | 1.14 |
| 14 | -2.01 | -5.95 | -14.79 | -2.25 |
| 15 | -0.76 | -6.12 | -17.95 | -1.45 |
Analysis of these results reveals that the exponential function provides the best overall performance. It has the highest $R^2$ value, and its relative errors on the validation data are consistently the smallest and most stable, especially for the longer crack lengths which are most critical for life prediction. The polynomial fit, while having a similar $R^2$, shows dramatically increasing errors for the validation points, indicating overfitting to the training data. The exponential relationship also has a strong physical basis; as the crack in the spur or pinion grows, the geometric factor $Y$ in the SIF equation often increases rapidly, leading to an exponential-like trend. Therefore, the exponential model is selected:
$$
\Delta K(a) = 30.3562 \cdot e^{0.4563 a}
$$
where $a$ is in mm and $\Delta K$ is in MPa√m.
With the $\Delta K(a)$ relationship defined and the material constants $C$ and $m$ known, we can now construct the complete life estimation model for the spur and pinion. Substituting the exponential function into the integrated Paris law gives:
$$
N = \int_{a_0}^{a_{th}} \frac{1}{C \left(30.3562 \cdot e^{0.4563 a}\right)^m} \, da
$$
This integral can be solved analytically. Substituting the constants $C$ and $m$ yields:
$$
N = \frac{1}{C \cdot (30.3562)^m} \int_{a_0}^{a_{th}} e^{-0.4563 \cdot m \cdot a} \, da = \frac{1}{C \cdot (30.3562)^m \cdot (-0.4563 \cdot m)} \left[ e^{-0.4563 \cdot m \cdot a_{th}} – e^{-0.4563 \cdot m \cdot a_0} \right]
$$
The limits of integration must be defined. The initial crack size $a_0$ is typically assumed to be on the order of the material’s microstructure or the detectable limit. For this analysis, $a_0 = 0.01$ mm is used. The critical crack size $a_{th}$ is often taken as the point where crack growth becomes unstable (approaching fracture toughness) or when the remaining ligament can no longer carry the load. For the purpose of this spur and pinion life prediction, a conservative threshold of $a_{th} = 2.0$ mm is defined, representing a severely damaged tooth just prior to catastrophic failure. Inserting all values into the equation:
$$
C = 4.77 \times 10^{-9}, \quad m = 2.06, \quad a_0 = 0.01 \text{ mm}, \quad a_{th} = 2.0 \text{ mm}
$$
$$
N = \frac{1}{4.77 \times 10^{-9} \cdot (30.3562)^{2.06} \cdot (-0.4563 \cdot 2.06)} \left[ e^{-0.4563 \cdot 2.06 \cdot 2.0} – e^{-0.4563 \cdot 2.06 \cdot 0.01} \right]
$$
Performing this calculation provides the estimated number of loading cycles from crack initiation to the defined failure threshold. The result is approximately:
$$
N \approx 165,833 \text{ cycles}
$$
This numerical result is profoundly significant. When compared to the typical design life of a spur and pinion set, which often aims for $10^7$ cycles or more under high-cycle fatigue conditions, a lifespan of only about $1.66 \times 10^5$ cycles represents a drastic reduction. This underscores the critical danger posed by even a small root crack in a spur or pinion. Once initiated, the crack propagation phase can consume the useful life of the component very rapidly, leaving a narrow window for detection and intervention before functional failure occurs. This analysis highlights the non-linear acceleration of damage; the majority of the predicted cycles are spent growing the crack from 0.01 mm to perhaps 1 mm, while the growth from 1 mm to 2 mm occurs much faster due to the exponentially increasing $\Delta K$.
In conclusion, this detailed investigation into the failure mechanics of a spur and pinion system leads to several key findings. First, the root fillet region under tensile bending stress is confirmed as the predominant site for fatigue crack initiation. Second, the crack propagation path, simulated using XFEM, follows a distinct curved trajectory influenced by the complex stress field within the gear tooth, a behavior critical for understanding final failure modes. Third, the relationship between the crack driving force ($\Delta K$) and crack length ($a$) for this geometry is best characterized by an exponential function, providing superior predictive capability over other common fits. Finally, integrating this relationship with the Paris law yields a quantifiable and alarmingly short remaining life for a spur and pinion with a root crack. This life prediction model, grounded in fracture mechanics and advanced simulation, provides a powerful tool for assessing the severity of detected cracks and informing maintenance decisions, ultimately enhancing the reliability and safety of systems dependent on spur and pinion drives.
The methodology presented here can be extended and refined. Future work could involve analyzing the sensitivity of the life estimate to variations in the initial crack location and angle, incorporating more complex multi-axial loading and mixed-mode (I+II) crack growth criteria, and studying the effect of residual stresses from manufacturing processes like shot peening on the spur and pinion’s crack propagation resistance. Furthermore, validating the model with physical fatigue tests on actual spur and pinion specimens would be the definitive step in confirming its predictive accuracy for real-world applications.