
As an engineer specializing in mechanical component analysis, I have long been fascinated by the critical role of power transmission elements. Among these, the spur and pinion gear pair stands out for its fundamental application in countless automotive, motorcycle, and engineering machinery systems. The reliable performance and extended service life of these spur and pinion gear sets are paramount, directly influencing the durability and efficiency of the entire mechanical assembly. A primary method for enhancing the strength and wear resistance of these components is heat treatment, specifically quenching. However, this vital process introduces significant challenges, namely the development of quenching-induced residual stresses and component distortion. These stresses, if not properly understood and managed, can become initiation sites for cracks, leading to premature fatigue failure and a drastic reduction in the operational lifespan of the spur and pinion gear. Therefore, a deep understanding of the genesis and distribution of these residual stresses is not merely an academic exercise but a practical necessity for optimizing manufacturing processes and ensuring component reliability. In this comprehensive study, I employ advanced finite element simulation techniques to dissect the coupled thermal, metallurgical, and mechanical phenomena occurring during the quenching of a 20CrMnTi steel spur and pinion gear pair.
The material under investigation is 20CrMnTi, a low-carbon alloy steel renowned for its excellent hardenability and toughness after carburizing and quenching. Its typical chemical composition, which governs its phase transformation behavior, is summarized in Table 1.
| C | Cr | Mn | Ti | Si | P | S | Fe |
|---|---|---|---|---|---|---|---|
| 0.17-0.23 | 1.00-1.30 | 0.80-1.10 | 0.04-0.10 | 0.17-0.37 | ≤0.035 | ≤0.035 | Bal. |
The success of a numerical simulation hinges on the accurate definition of material properties that are temperature and phase-dependent. For thermal analysis, the key properties are thermal conductivity \( k(T) \), specific heat capacity \( C_p(T) \), and density \( \rho(T) \). The governing equation for transient heat conduction during quenching, neglecting internal heat generation, is given by Fourier’s law:
$$\rho(T) C_p(T) \frac{\partial T}{\partial t} = \nabla \cdot (k(T) \nabla T)$$
For the mechanical and phase transformation analysis, critical data includes the coefficient of thermal expansion \( \alpha(T) \), Young’s modulus \( E(T) \), yield strength \( \sigma_y(T, \dot{\varepsilon}) \), and the kinetics of austenite decomposition into phases like martensite, bainite, and pearlite. The transformation-induced volumetric strain is a primary driver of residual stress and can be expressed for a phase \( i \) as:
$$\varepsilon_i^{tr} = \beta_i \cdot \Delta V_i \cdot \xi_i$$
where \( \beta_i \) is a coefficient, \( \Delta V_i \) is the specific volume change, and \( \xi_i \) is the volume fraction of phase \( i \). The total strain increment \( d\varepsilon \) during quenching is often decomposed into elastic \( d\varepsilon^e \), plastic \( d\varepsilon^p \), thermal \( d\varepsilon^{th} \), and transformational \( d\varepsilon^{tr} \) components:
$$d\varepsilon = d\varepsilon^e + d\varepsilon^p + d\varepsilon^{th} + d\varepsilon^{tr}$$
The thermal strain increment is \( d\varepsilon^{th} = \alpha(T) \, dT \). Accurately modeling the stress-strain response requires a thermo-elasto-plastic constitutive model that incorporates these strain components and their interactions.
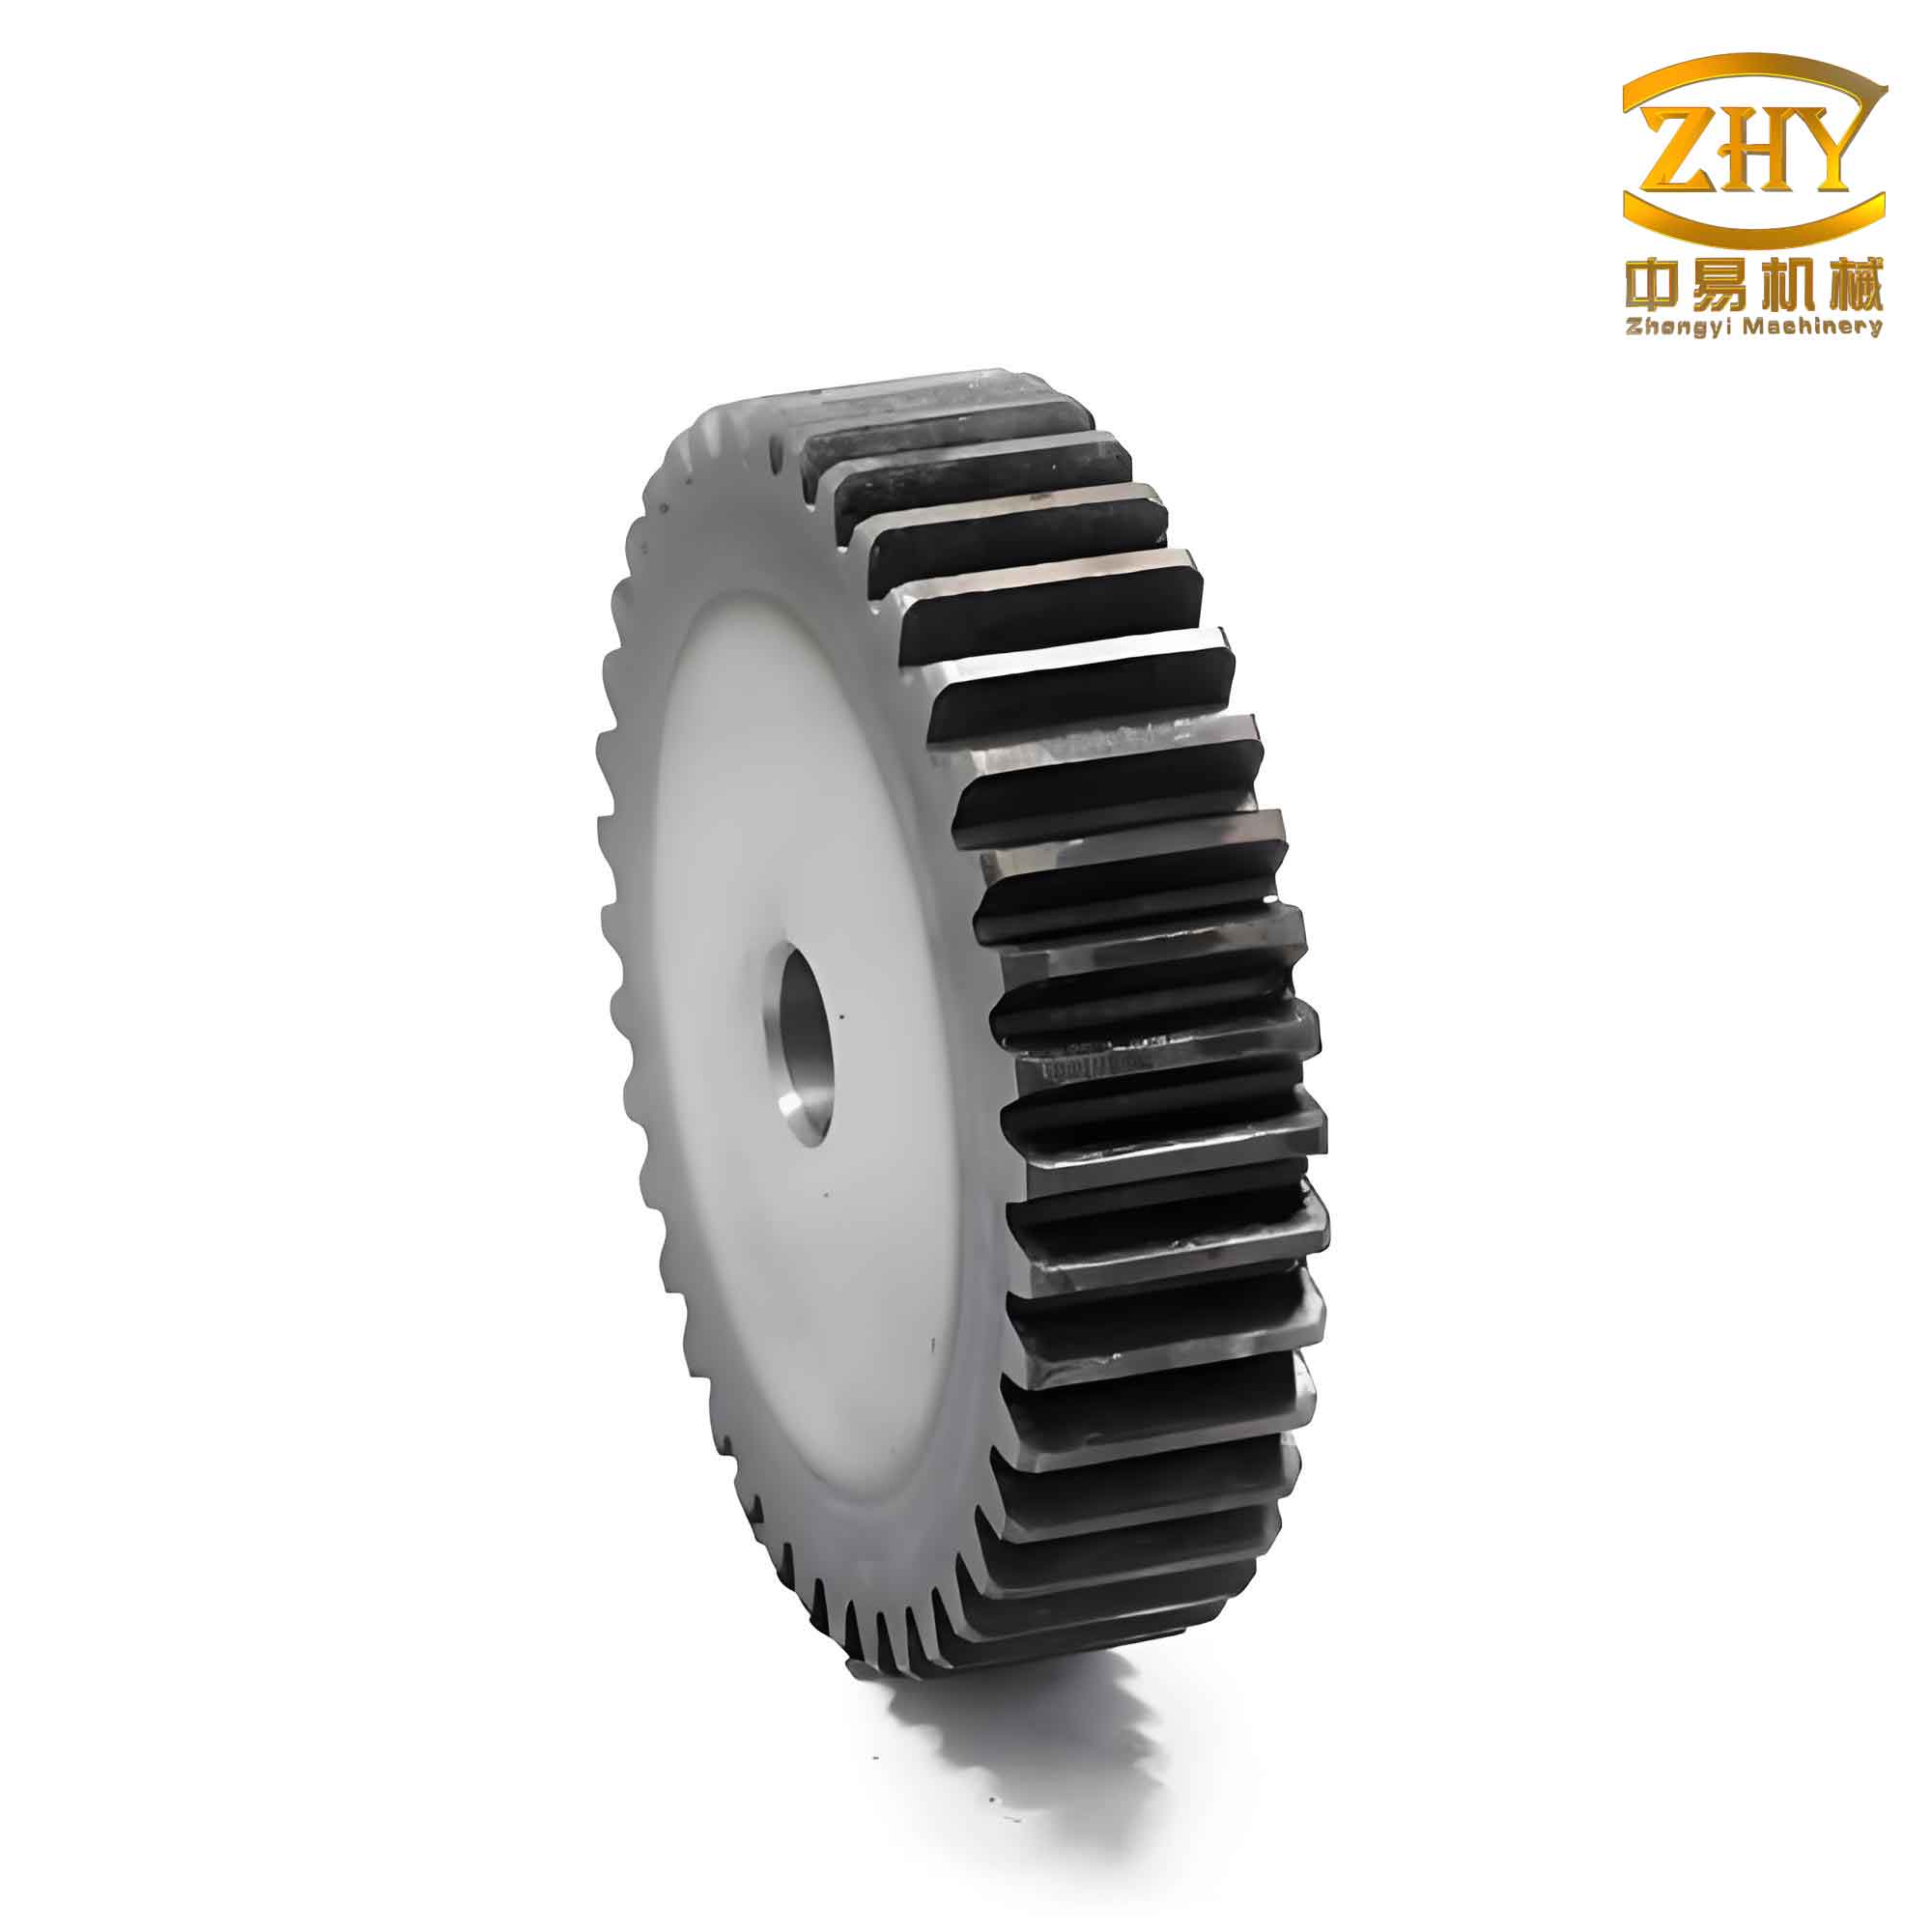
The geometric model for my analysis consists of a standard involute spur and pinion gear pair. To manage computational cost while preserving accuracy, I often model a sector of the gear or use symmetry conditions. However, for a comprehensive view of the temperature and stress fields across the entire component, a full-tooth model is advantageous. The key geometric parameters defining the spur and pinion gear are provided in Table 2.
| Parameter | Pinion (Small Gear) | Gear (Large Gear) |
|---|---|---|
| Number of Teeth (z) | 36 | 45 |
| Module (m, mm) | 2 | |
| Pressure Angle (α, degrees) | 20 | |
| Face Width (b, mm) | 30 | |
Creating a high-quality finite element mesh is crucial. I use a dense mesh of hexahedral elements in the tooth root, flank, and rim areas where high stress and temperature gradients are expected, and a slightly coarser mesh in the web and hub regions. This graded mesh ensures solution accuracy without prohibitive computational expense. The boundary conditions are defined to mimic the physical constraints during the quenching process. The inner bore surface of the spur and pinion gear, which would be mounted on a shaft, is constrained in the radial direction (U_r = 0). The two side faces of the gear are constrained in their normal (axial) direction to simulate a simple support condition that allows for in-plane deformation but prevents rigid body motion.
The quenching process analyzed is a two-stage, or interrupted, quenching sequence designed to control cooling rates and mitigate distortion.
- Oil Quenching Stage: The spur and pinion gear, initially uniformly heated to the austenitizing temperature of 860°C, is suddenly immersed in an oil bath maintained at 80°C. The heat extraction is governed by a temperature-dependent convection heat transfer coefficient, \( h_{oil}(T) \). This coefficient is typically high at the initial high surface temperature, promoting vapor blanket formation, and increases as the surface temperature drops, leading to nucleate boiling and convection. This stage lasts for approximately 600 seconds, during which the core of the gear cools significantly.
- Air Cooling Stage: After oil quenching, the gear is transferred to ambient air at 25°C. The heat transfer mechanism here is natural convection, characterized by a much lower and relatively constant coefficient, \( h_{air} \). This stage allows for a slower, more uniform temperature equilibration across the component and is simulated for about 1800 seconds until the gear approaches room temperature.
The analysis of the transient temperature field reveals the non-uniform cooling inherent in the quenching of a complex shape like a spur and pinion gear. Due to the larger surface-area-to-volume ratio, the external features—tooth tips, edges, and outer rim—cool at a dramatically faster rate than the internal regions near the hub and the core of the gear body. This creates significant spatial and temporal temperature gradients, which are the root cause of thermal stresses.
Let’s examine the temperature evolution quantitatively. At a very early stage, say t=10s after oil immersion, the simulation shows an extreme gradient. The tooth surfaces may have cooled to around 400°C, while the innermost points of the gear hub retain the initial austenitizing temperature of 860°C. This steep gradient, \( \nabla T \), is the primary driver of initial thermal stress. By t=60s, the highest temperature in the gear has dropped to approximately 410°C as the cooling front propagates inward. At the end of the oil quench (t=600s), the temperature distribution is much more uniform, with the maximum temperature around 79°C. During the subsequent air cooling stage, the temperature continues to equilibrate slowly. At the end of the simulation (t=1800s), the final temperature is nearly uniform at about 74.5°C, with the larger gear’s core temperature being slightly higher than the pinion’s due to its greater mass and slower overall cooling. The evolution of the radial temperature profile from the hub to the rim clearly shows that the temperature gradient is most severe at the beginning of quenching and diminishes over time. This can be conceptually summarized for a radial coordinate \( r \) as:
$$\frac{\partial T(r,t)}{\partial r} \rightarrow \text{Large for small } t, \quad \frac{\partial T(r,t)}{\partial r} \rightarrow \text{Small for large } t$$
This behavior is critical for understanding the subsequent stress evolution.
| Time (s) | Stage | Max Temp (°C) | Min Temp (°C) | Approx. Radial ΔT | Dominant Stress State |
|---|---|---|---|---|---|
| 0 | Initial | 860 | 860 | 0 | Stress-free (Austenite) |
| 10 | Oil Quench | 860 (Core) | ~400 (Surface) | >450°C | Surface in tension (Thermal shock) |
| 60 | Oil Quench | ~410 | ~100 | ~300°C | Complex, phase transformation begins |
| 200 | Oil Quench | ~150 | ~85 | ~65°C | High compressive stress at surface (Martensite formation) |
| 600 | End of Oil Quench | ~79 | ~78 | ~1°C | Near-final residual stress pattern forms |
| 1800 | End of Air Cooling | ~74.5 | ~74.0 | ~0.5°C | Final Residual Stress |
The evolution of stress within the spur and pinion gear is a dynamic interplay between thermal stresses and transformation-induced stresses. Initially, the rapid cooling of the surface layers causes them to contract. However, they are constrained by the hotter, expansive interior. This results in the surface developing tensile thermal stresses while the core experiences compressive stresses. This is a purely thermo-elastic phenomenon. However, as cooling continues and the surface temperature drops below the martensite start temperature (Ms), austenite begins to transform to martensite. This phase change is accompanied by a significant volumetric expansion. This expansion counteracts the thermal contraction. In the surface layers, this transformative expansion can overcome the thermal contraction, putting the surface into a state of high compressive stress. Meanwhile, the core, which transforms later or may not fully transform to martensite depending on the hardenability and cooling rate, can end up in tension.
The radial stress profile undergoes a fascinating reversal over time, as observed in the simulation results. During the first 600 seconds (primarily the oil quench), the stress magnitude at the outer regions (near the teeth and rim) of the spur and pinion gear is generally higher than at the inner hub region. This is consistent with the surface experiencing the most severe thermal shock and the earliest phase transformation. After 600 seconds, during the air cooling and final equilibration, this trend inverts. The final residual stress state typically shows high compressive stresses on the surface (beneficial for fatigue resistance) and balancing tensile stresses in the core. This reversal is a direct consequence of the delayed cooling and transformation of the core relative to the surface.
Plotting the maximum principal stress in the gear body versus time reveals a complex, non-monotonic curve. The stress rapidly increases in the first few seconds due to severe thermal gradients. It then may experience a sharp drop as the surface yields plastically or as the onset of martensitic transformation introduces compressive strains. Subsequently, between approximately 200s and 500s, the stress rises again as the core cools and transforms, interacting with the already-transformed surface layers. Finally, after 500s, the stress state stabilizes and undergoes only minor adjustments during the slow air cooling stage. The final maximum residual stress value in the modeled spur and pinion gear reaches approximately 1.2 GPa, which is a significant magnitude typical of hardened components. The stress evolution can be conceptually linked to the phase fraction \( \xi_M \) of martensite. A simplified relation for the stress development \( \sigma(t) \) might combine thermal and transformational terms:
$$\sigma(t) \propto \int E(T) \cdot \alpha(T) \, dT – \int E(T) \cdot \varepsilon^{tr}(\xi_M) \, d\xi_M$$
where the first term represents the thermal stress integral and the second represents the stress relief/development due to transformation strain.
In conclusion, the numerical simulation of the quenching process for a spur and pinion gear pair made from 20CrMnTi steel provides profound insights into the genesis of residual stresses. The temperature distribution during quenching is highly non-uniform, with radial temperature gradients being most severe at the initial stage of cooling and gradually diminishing as the process continues. The evolution of stress is a direct consequence of this thermal history coupled with solid-state phase transformations. The stress state is not static; it undergoes a complex temporal evolution where the relationship between surface and core stresses can reverse due to the sequential nature of cooling and transformation. The final residual stress profile, characterized by surface compression and core tension, is a locked-in equilibrium state resulting from the interplay of thermal contraction and transformative expansion. Crucially, any rigorous analysis of quenching residual stress in components like spur and pinion gears must account for the significant effects of phase transformations, as they are often the dominant factor in determining the final stress magnitude and distribution. This understanding is essential for optimizing quenching parameters—such as medium temperature, agitation, and quenching duration—to tailor the residual stress profile for maximum fatigue performance and minimal distortion in these critical power transmission components.