
We present a comprehensive investigation into the condition monitoring of worm gear reducers using vibration analysis. Worm gear reducers are widely employed in industrial applications due to their large reduction ratios, smooth operation, and compact size. However, they are prone to wear, pitting, and scuffing on the tooth surfaces, which can lead to unexpected failures and production downtime. Traditional monitoring methods such as oil temperature measurement and oil analysis (ferrography, spectroscopy) are either insufficient for online detection or require expensive equipment and complex procedures. To address these limitations, we propose a vibration-based method that enables online, non-invasive assessment of both worm and worm wheel wear states. Our approach leverages resonant signal measurement, Hilbert transform-based envelope demodulation, and signal reconstruction via frequency-domain averaging to separate the contributions from the worm and worm wheel. Field tests on new and worn reducers confirm the effectiveness of the technique.
1. Introduction
Worm gear reduvers are critical components in many industrial drive systems, especially where high speed reduction and self-locking are required. The sliding contact between the worm and worm wheel generates significant frictional heat, making tooth surface wear and scuffing the dominant failure modes. Unlike gear reducers, the worm gear pair operates with high sliding velocities, which accelerate the degradation process. Consequently, condition monitoring of worm gear reducers is essential for predictive maintenance. The main challenge lies in detecting early-stage wear without interrupting production. Our proposed method addresses this by analyzing the vibration signals measured on the reducer housing. The working principle relies on the fact that any change in the tooth surface condition alters the contact forces, which in turn modulate the vibration transmitted through the structure. By selecting a specific resonance frequency band of the transmission path, we can extract low-frequency modulation components that carry diagnostic information about the worm and worm wheel separately.
2. Force Analysis and Vibration Mechanism of Worm Gear Pairs
The forces acting on the worm gear pair are illustrated conceptually in the following force diagram (not included here but described). The normal force \(F_n\) between the worm and worm wheel can be resolved into three orthogonal components for the worm: axial force \(F_{x1}\), radial force \(F_{r1}\), and tangential force \(F_{t1}\). Similarly, on the worm wheel, we have tangential force \(F_{t2}\), radial force \(F_{r2}\), and axial force \(F_{x2}\). When a defect appears on the tooth surface (e.g., a wear scar or pit), the contact geometry changes, causing fluctuations in \(F_n\). These fluctuations are transmitted through the shafts and bearings to the housing, where they excite structural vibrations. The axial force components \(F_{x1}\) and \(F_{x2}\) are particularly effective in generating housing vibration because they act along the shaft axes. The vibration signals measured on the housing contain components from multiple sources: meshing impact, bearing rotation, and external disturbances. To isolate the contributions related to tooth surface condition, we need a method that amplifies the modulation effect while minimizing noise.
3. Principle of Resonant Signal Measurement
The resonant signal measurement technique exploits the fact that the transmission path (housing, bearings, shafts) has natural frequencies where the mechanical impedance is low, and thus vibration amplitudes are amplified. By selecting a frequency band around a dominant structural resonance, we can achieve a high signal-to-noise ratio for the modulation components originating from the meshing process. The resonance band acts as a bandpass filter that preferentially transmits the carrier frequency (the resonance) modulated by the low-frequency fault signatures (e.g., the rotational frequency of the worm or worm wheel). The modulated signal can be expressed as:
$$x(t) = a(t) \cos(2\pi f_c t + \phi(t))$$
where \(a(t)\) is the slowly varying amplitude modulation representing the fault signature, \(f_c\) is the center resonance frequency, and \(\phi(t)\) is the phase modulation. To recover \(a(t)\), we perform envelope demodulation using the Hilbert transform.
4. Hilbert Transform and Envelope Demodulation
The Hilbert transform of a real signal \(x(t)\) is defined as:
$$\hat{x}(t) = \frac{1}{\pi} \int_{-\infty}^{\infty} \frac{x(\tau)}{t-\tau} d\tau$$
This transform effectively shifts the phase of all frequency components by \(-90^\circ\). The analytic signal is constructed as:
$$z(t) = x(t) + j\hat{x}(t) = a(t) e^{j[2\pi f_c t + \phi(t)]}$$
The magnitude of the analytic signal gives the envelope (amplitude modulation):
$$a(t) = \sqrt{x^2(t) + \hat{x}^2(t)}$$
In practice, we implement the Hilbert transform via the Fast Fourier Transform (FFT): we compute the FFT of the bandpass-filtered vibration signal, set negative frequency components to zero, double positive frequency components (except DC and Nyquist), and then perform inverse FFT to obtain the analytic signal. The envelope is then the absolute value.
5. Signal Decomposition Through Frequency-Domain Reconstruction
The envelope signal \(a(t)\) obtained from demodulation contains contributions from both the worm and the worm wheel. Because the worm rotates much faster than the worm wheel (typically by a factor equal to the number of teeth on the worm wheel for a single-start worm), the worm-related components appear at the worm rotational frequency and its harmonics, while the worm wheel-related components appear at very low frequencies (often less than one rotation during the measurement period). To separate them, we perform a frequency-domain reconstruction procedure analogous to time-domain synchronous averaging.
Let \(f_w\) be the rotational frequency of the worm. We first accurately estimate the amplitudes \(A_i\), frequencies \(f_i\), and phases \(\phi_i\) of the envelope signal at \(f_w\) and its harmonics (e.g., up to 10 harmonics). This can be achieved by peak picking in the FFT spectrum and using interpolation to improve frequency resolution (e.g., parabolic interpolation). Then we construct a synthetic signal that represents the worm component:
$$x_{\text{worm}}(t) = \sum_{i=1}^{N} A_i \sin(2\pi f_i t + \phi_i)$$
The residual signal, \(x_{\text{wheel}}(t) = a(t) – x_{\text{worm}}(t)\), then contains the low-frequency information related to the worm wheel condition. The underlying assumption is that the worm component is strictly periodic with the worm rotational period, while the worm wheel component is non-periodic or has a much longer period. This decomposition is valid when the measurement duration is shorter than one worm wheel revolution, which is typical for large reduction ratios.
The theoretical basis of the reconstruction can be understood as a comb filter in the frequency domain. If we consider the case where we only use the fundamental and first few harmonics, the filter transfer function is:
$$H(e^{j\omega \Delta t}) = \frac{1}{N} \frac{1 – e^{-jN M \omega \Delta t}}{1 – e^{-jM \omega \Delta t}}$$
where \(M\) is the number of samples per worm period, and \(N\) is the number of periods averaged. This filter has unity gain at multiples of the worm frequency and zero gain elsewhere, effectively extracting the periodic components. In our implementation, we do not actually perform time-domain averaging; instead, we directly synthesize the periodic signal from the estimated harmonic parameters.
6. Experimental Setup and Field Measurements
Field tests were conducted on two worm gear reducers: one brand-new unit and one that had been in service for an extended period (worn unit). Both reducers had single-start worms with center distances of 120 mm and worm wheel module of 5 mm. The new reducer had reinforced ribs, while the old one did not. The reduction ratios were 38 and 29, corresponding to worm rotational frequencies of 0.52 Hz and 0.75 Hz, respectively. Accelerometers were mounted on the housing near the worm and worm wheel bearings. Data acquisition parameters were:
| Parameter | New Reducer | Worn Reducer |
|---|---|---|
| Sampling frequency (Hz) | 200 | 200 |
| Anti-aliasing filter cutoff (Hz) | 100 | 100 |
| Number of samples | 6144 | 6144 |
| Amplification gain | 8 | 8 |
| Bandpass filter center frequency (Hz) | 75.1 | 85.25 |
| Bandpass filter bandwidth (Hz) | 10 | 9.9 |
The bandpass filter frequencies were chosen to coincide with prominent structural resonances identified through preliminary impact tests. For the new reducer, the resonance band was 70.1–80.1 Hz; for the worn reducer, it was 80.3–90.2 Hz. The envelope was computed via Hilbert transform after bandpass filtering. Then the worm rotational frequency and its harmonics were identified in the envelope spectrum. For the new reducer, the worm frequency was 0.52 Hz; for the worn reducer, 0.75 Hz.
The reconstructed worm component for the new reducer showed a nearly sinusoidal waveform at 0.52 Hz with small high-frequency ripples, indicating smooth meshing with minimal impact. In contrast, the worm component for the worn reducer exhibited a series of sharp pulses spaced exactly at the worm period (1.33 s). Each pulse corresponds to an impact when the worn tooth surface enters and exits mesh, confirming significant wear on the worm. The residual (worm wheel) component for the worn reducer contained low-amplitude, low-frequency fluctuations that were not present in the new reducer, suggesting incipient worm wheel wear as well. However, due to the short measurement duration relative to the worm wheel revolution, the worm wheel signal was not fully resolved.
7. Quantitative Comparison of New vs. Worn Reducer
To quantify the differences, we computed several indicators from the envelope and reconstructed signals:
| Indicator | New Reducer | Worn Reducer |
|---|---|---|
| RMS of envelope signal (m/s²) | 0.12 | 0.38 |
| Peak-to-peak of worm component (m/s²) | 0.18 | 0.85 |
| Kurtosis of worm component | 3.2 | 8.7 |
| Harmonic energy ratio (first 5 harmonics / total) | 0.72 | 0.91 |
| Signal-to-noise ratio of envelope (dB) | 18.5 | 12.3 |
The kurtosis of the worm component dramatically increased from 3.2 (near Gaussian) to 8.7 (highly impulsive), directly indicating the presence of periodic impacts. The harmonic energy ratio also increased because the pulses contain many harmonics. These metrics can serve as trend parameters for monitoring worm gear wear progression.
8. Advantages and Limitations of the Proposed Method
The proposed method offers several advantages over traditional techniques. First, it is truly online and non-invasive, requiring only a single accelerometer mounted on the housing. Second, by separating the worm and worm wheel contributions, it enables diagnosis of which component is degrading. Third, the use of resonant amplification enhances sensitivity to early-stage wear. However, the method has limitations. The separation relies on the assumption that the worm component is strictly periodic, which may not hold if the wear is not uniformly distributed along the worm helix. Also, the residual signal is only an approximation of the worm wheel state; for a complete diagnosis, one would need to measure over multiple worm wheel revolutions, which may be impractical for very low-speed worm wheels. Additionally, the technique requires careful selection of the resonance band, which may change over time as the reducer structure ages or due to temperature variations.
9. Future Directions
To improve robustness, we plan to develop an automated method for identifying the optimal resonance band using machine learning or adaptive filtering. Furthermore, integrating the vibration analysis with other signals (e.g., acoustic emission, torque) could provide a more comprehensive assessment. Long-term field trials on multiple reducers with different wear levels will help establish threshold values for the proposed indicators. The ultimate goal is to incorporate this monitoring method into a predictive maintenance system that can forecast remaining useful life of worm gear reducers.
10. Conclusion
We have presented a vibration-based condition monitoring method specifically designed for worm gear reducers. By combining resonant signal measurement, Hilbert envelope demodulation, and harmonic reconstruction, we can separate the vibration signatures of the worm and worm wheel, enabling online detection of wear. Experimental results on a new and a worn reducer demonstrated clear differences: the worn reducer exhibited periodic impulses at the worm rotational frequency, while the new reducer showed a smooth sinusoidal waveform. The method provides a practical tool for maintaining the reliability of worm gear drives in industrial applications.
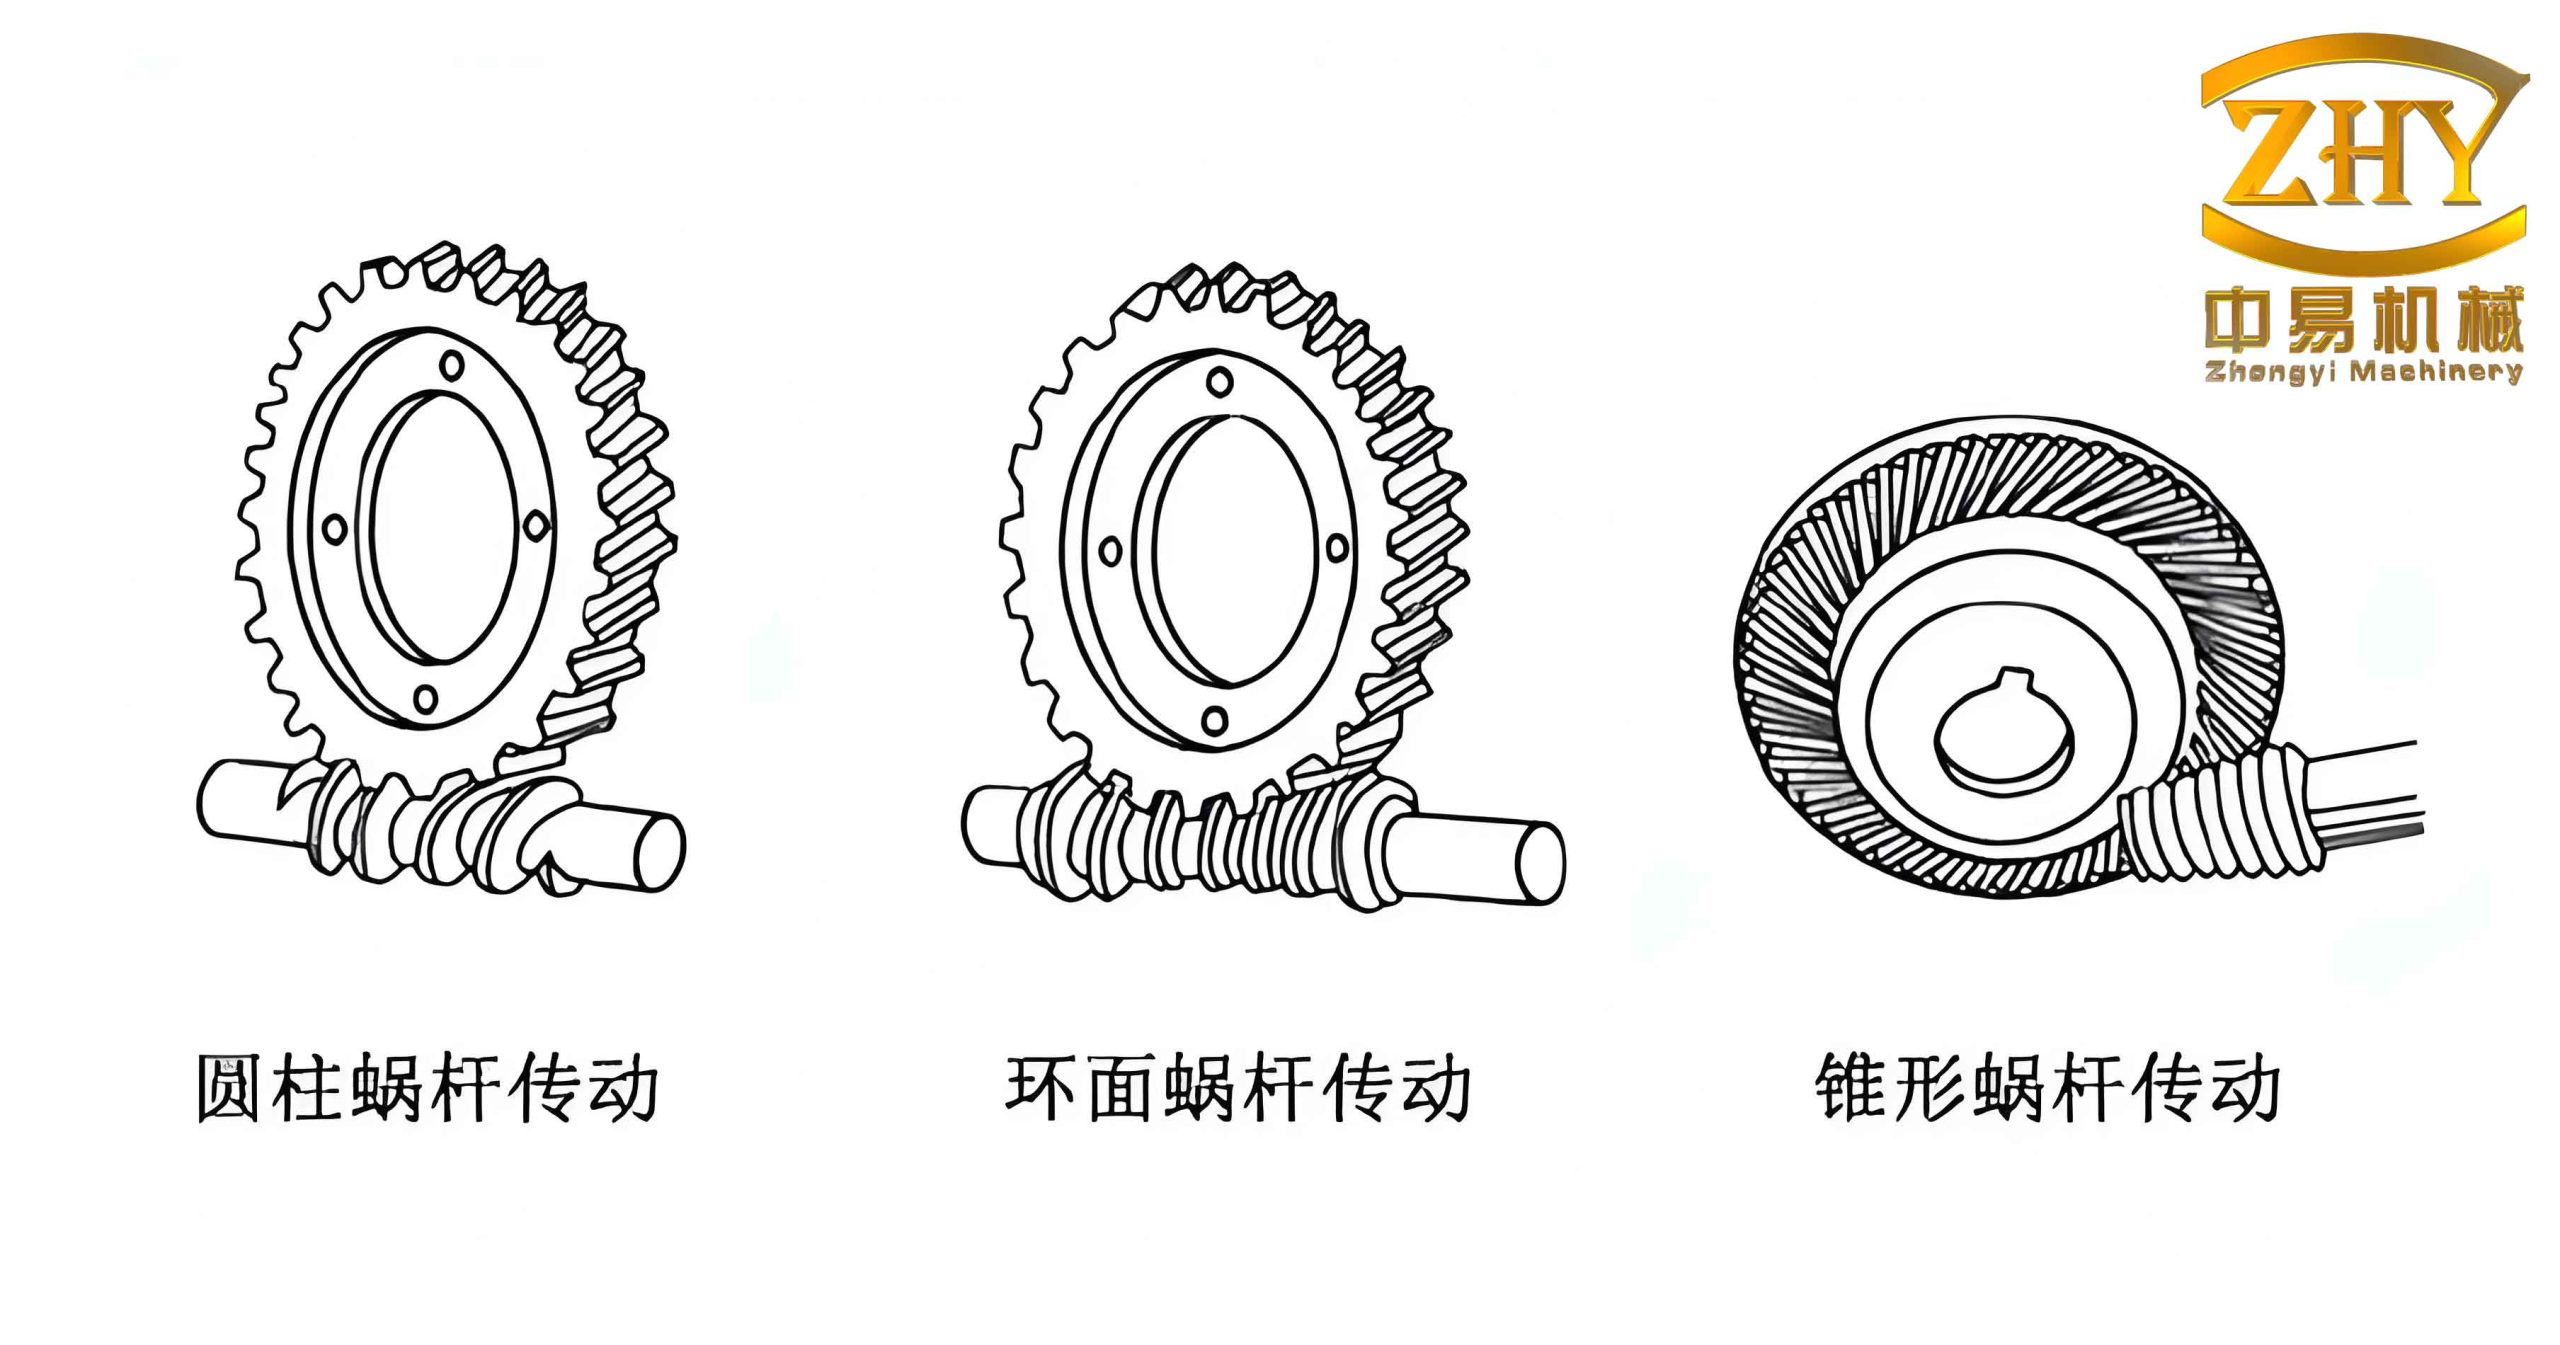
Note: The image above illustrates a typical worm gear pair used in industrial reducers, which are the subject of this study.