
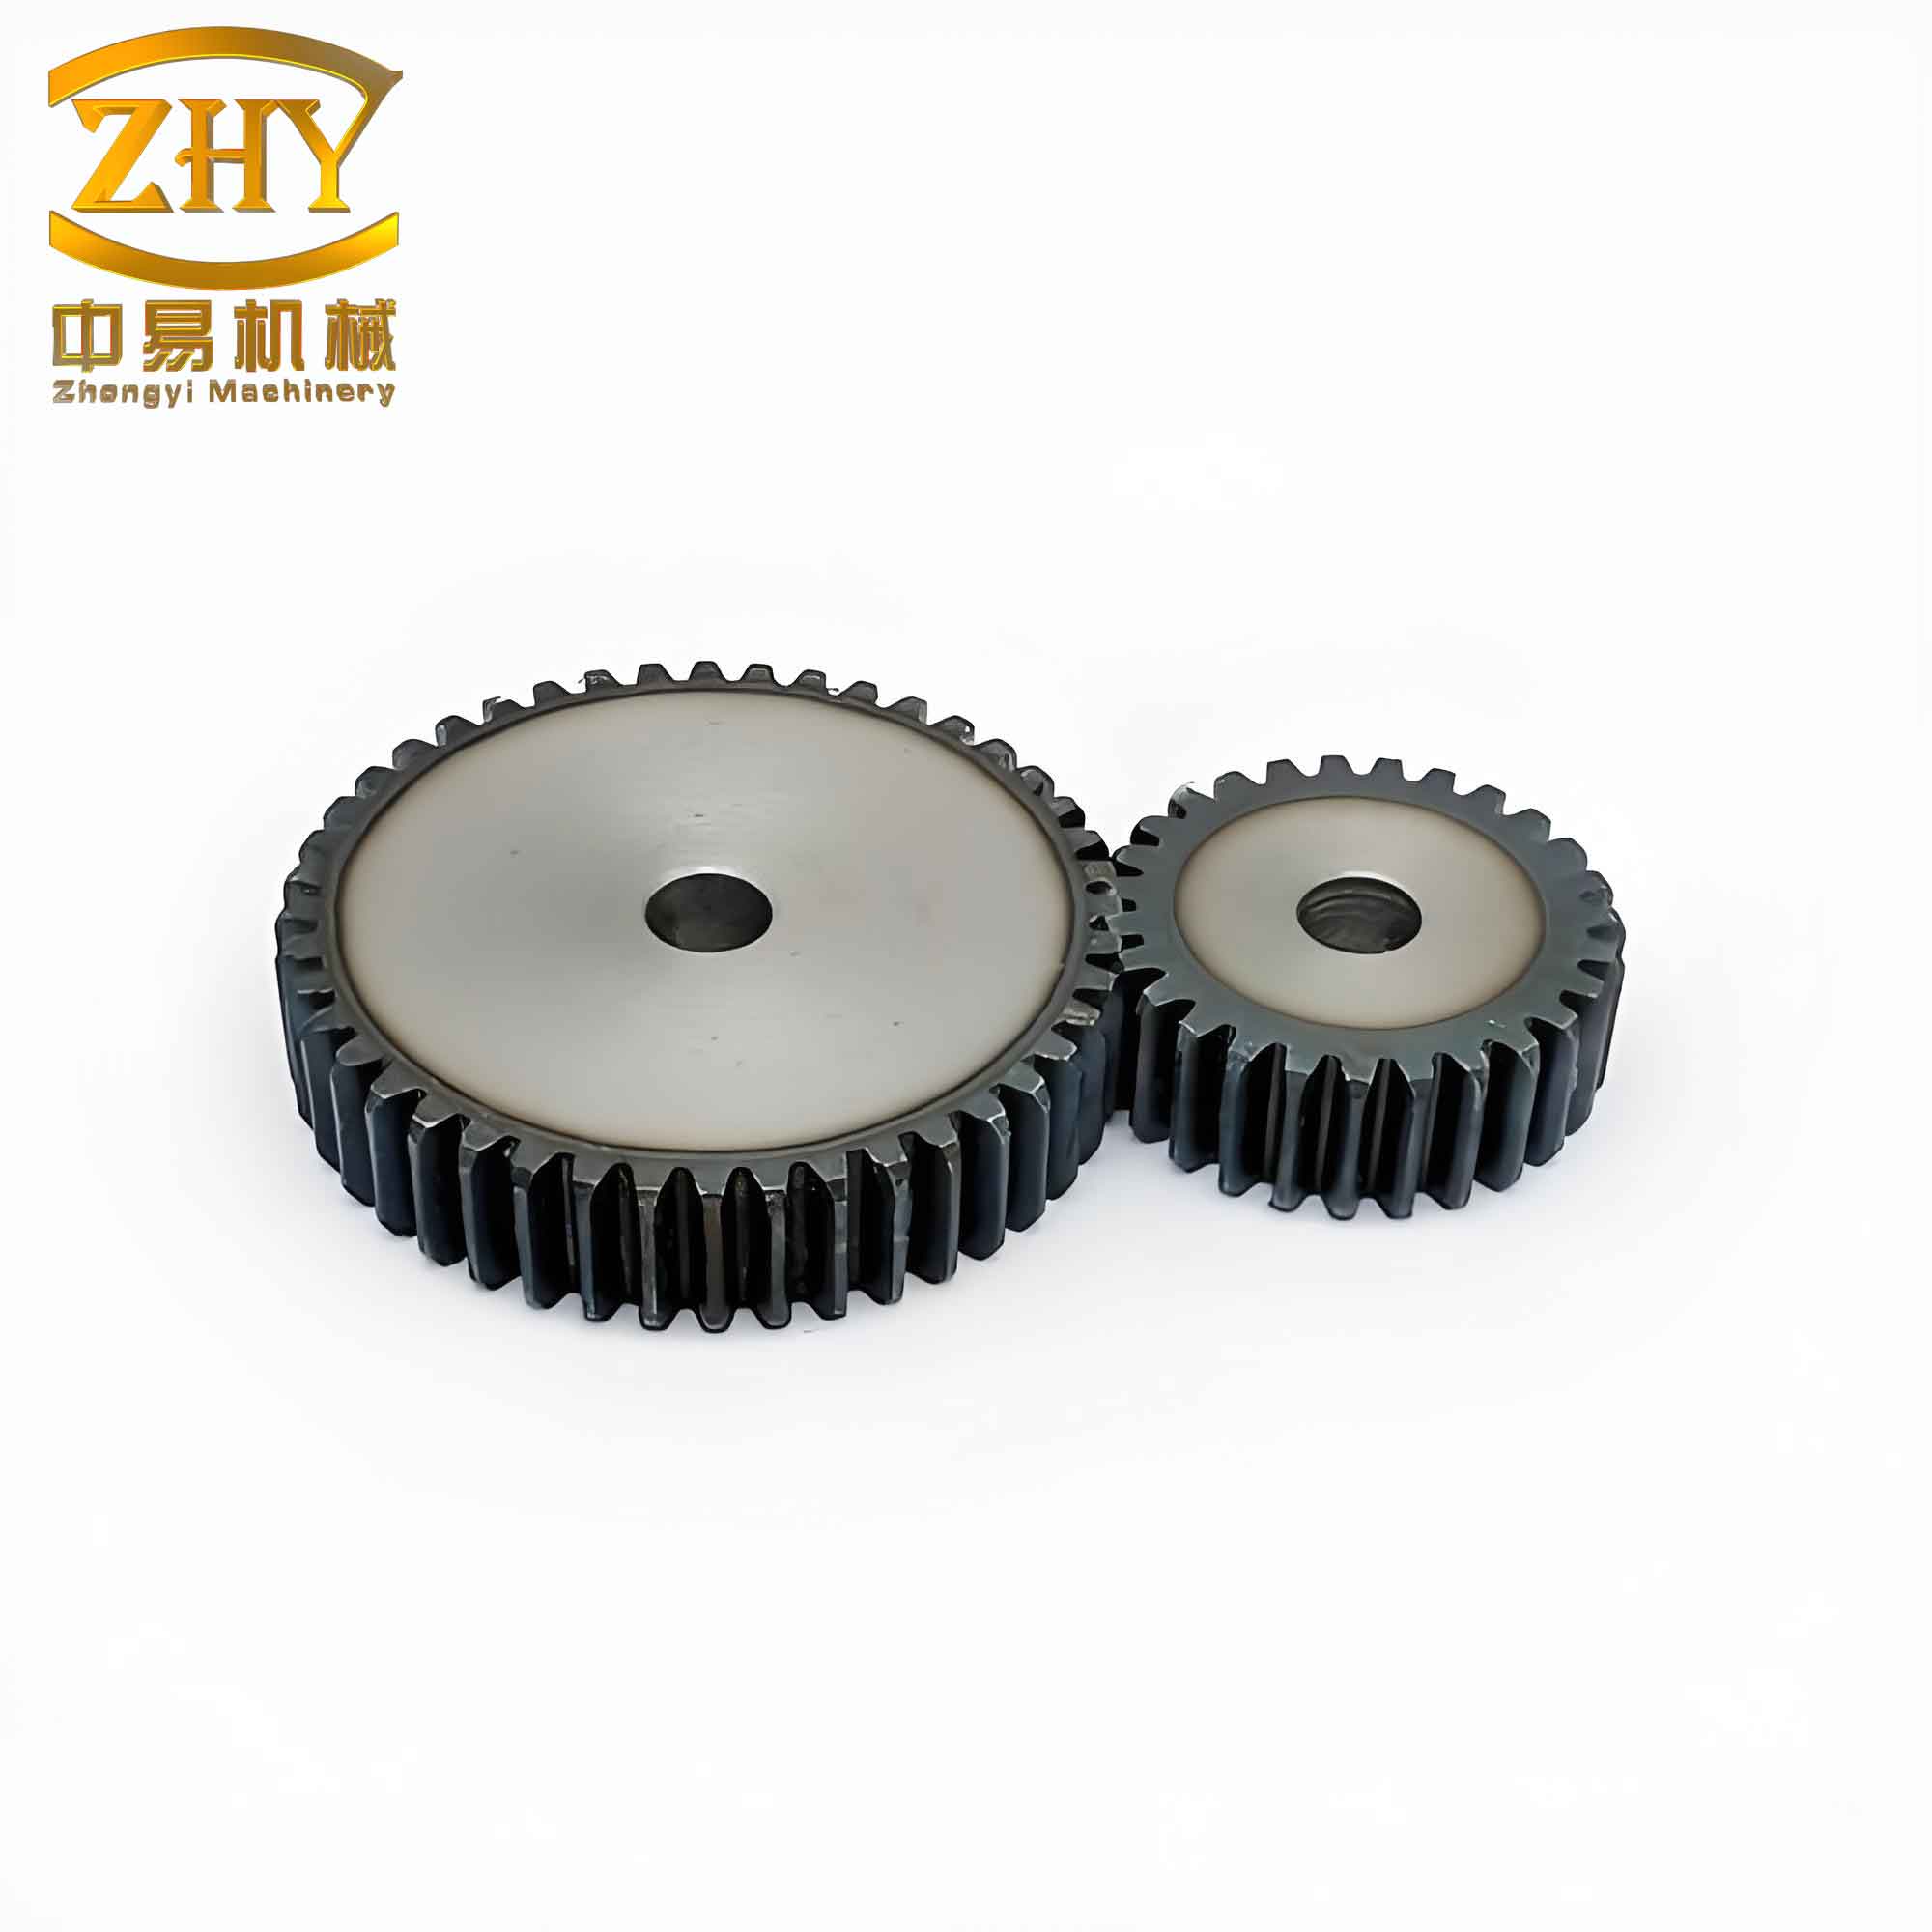
In the field of mechanical transmission, the straight spur gear is one of the most fundamental and widely used components. Its failure due to crack initiation and propagation at the tooth root can lead to catastrophic consequences such as tooth breakage. Therefore, understanding the crack propagation behavior and estimating the remaining life of a straight spur gear with a root crack is of great practical significance. In this study, I focused on the involute straight spur gear, analyzed the stress distribution to identify the most vulnerable crack initiation site, and utilized ABAQUS finite element software to simulate the crack propagation path. I then calculated the stress intensity factor (SIF) at the crack tip at various stages. By comparing different curve fitting methods, I established a functional relationship between crack length and SIF range. Finally, I applied the Paris formula to build a crack growth rate model, enabling the life estimation of the straight spur gear containing a root crack.
The Paris crack propagation theory describes the stable crack growth stage, where the relationship between the crack growth rate and the stress intensity factor range is given by:
$$
\frac{da}{dN} = C (\Delta K)^m
$$
Here, \(a\) represents the crack length, \(N\) is the number of effective loading cycles, and \(C\) and \(m\) are material constants. For the straight spur gear material used in this study (20CrNiMo), I adopted the values \(C = 4.77 \times 10^{-9}\) and \(m = 2.06\) based on standard experimental data. The stress intensity factor range \(\Delta K\) is defined as the difference between the maximum and minimum SIF within one meshing cycle:
$$
\Delta K = K_{\text{max}} – K_{\text{min}}
$$
Integrating the Paris equation yields the number of cycles required for the crack to grow from an initial length \(a_o\) to a critical length \(a_{th}\):
$$
N = \int_{a_o}^{a_{th}} \frac{da}{C (\Delta K)^m}
$$
Since \(\Delta K\) is a function of crack length \(a\), we can write \(\Delta K = f(a)\). Thus, the life estimation becomes a direct integration problem once the function \(f(a)\) is determined.
To simulate the crack propagation in a straight spur gear, I built a gear pair model using SolidWorks. The geometric and material parameters are summarized in the following table:
| Gear Type | Number of Teeth | Module (mm) | Pressure Angle (°) | Poisson’s Ratio | Elastic Modulus (GPa) | C (m/cycle) | m |
|---|---|---|---|---|---|---|---|
| Driving gear (small) | 18 | 2 | 20 | 0.29 | 205 | 4.77×10⁻⁹ | 2.06 |
| Driven gear (large) | 27 | 2 | 20 | 0.29 | 205 | 4.77×10⁻⁹ | 2.06 |
In the ABAQUS simulation, I applied a constant angular velocity to the small gear and a load of 10,000 N·mm to the large gear. The stress distribution on the straight spur gear pair clearly indicated that the highest stress concentration occurs at the fillet region of the tooth root, which is the most likely site for crack initiation. This observation is consistent with fracture mechanics theory, as the root fillet experiences repeated bending stresses during meshing.
I then introduced an extended finite element (XFEM) crack in the root fillet region of the large gear. The XFEM method allows the crack to propagate along an arbitrary path without remeshing. The simulated crack propagation path gradually extended from the tooth root into the gear body, following a trajectory that closely matches real observed failure patterns. To quantify the crack growth, I divided the path into multiple segments and computed the mode I stress intensity factor \(K_I\) at each crack tip position. Since the crack in a straight spur gear is predominantly opening mode (mode I), I focused only on \(K_I\). The results of crack length \(a\) versus \(\Delta K\) are tabulated below:
| Stage | Crack Length \(a\) (mm) | \(\Delta K\) (MPa·√m) |
|---|---|---|
| 1 | 0.01 | 30.12 |
| 2 | 0.10 | 31.85 |
| 3 | 0.20 | 33.67 |
| 4 | 0.30 | 35.42 |
| 5 | 0.40 | 37.21 |
| 6 | 0.50 | 39.08 |
| 7 | 0.60 | 41.03 |
| 8 | 0.70 | 43.06 |
| 9 | 0.80 | 45.18 |
| 10 | 0.90 | 47.39 |
| 11 | 1.00 | 49.70 |
| 12 | 1.20 | 55.25 |
| 13 | 1.40 | 61.38 |
| 14 | 1.60 | 68.15 |
| 15 | 1.80 | 75.67 |
From the typical fatigue crack growth rate curve, it is expected that in the stable propagation region (Stage II), \(\log(da/dN)\) versus \(\log(\Delta K)\) follows a linear trend, implying an exponential relationship between \(\Delta K\) and crack length \(a\): \(\Delta K = \alpha e^{\beta a}\). To verify this theoretical prediction, I compared four different fitting functions: exponential, power law, polynomial (cubic), and linear. The first 10 data points (stages 1–10) were used for fitting, and the remaining 5 points (stages 11–15) were used to validate the fitting accuracy. The resulting regression equations are:
- Exponential: \(\Delta K = 30.3562 \, e^{0.4563 a}\)
- Power law: \(\Delta K = 46.4705 \, a^{0.2204}\)
- Polynomial (cubic): \(\Delta K = -24.0368 a^3 + 24.265 a^2 + 13.542 a + 29.2655\)
- Linear: \(\Delta K = 18.6595 a + 29.2818\)
I evaluated the goodness of fit using the coefficient of determination \(R^2\) and the relative error. The \(R^2\) values are summarized in the following table:
| Function | Exponential | Polynomial (cubic) | Linear | Power law |
|---|---|---|---|---|
| \(R^2\) | 0.9502 | 0.9487 | 0.9400 | 0.9176 |
The relative errors for the validation points (stages 11–15) are shown below:
| Stage | Exponential | Power law | Polynomial | Linear |
|---|---|---|---|---|
| 11 | -0.38 | -0.38 | -3.46 | 0.47 |
| 12 | 7.36 | 5.86 | 0.79 | 7.91 |
| 13 | 0.97 | -1.73 | -8.42 | 1.14 |
| 14 | -2.01 | -5.95 | -14.79 | -2.25 |
| 15 | -0.76 | -6.12 | -17.95 | -1.45 |
Both the \(R^2\) values and the relative errors indicate that the exponential function provides the best fit for the relationship between crack length and stress intensity factor range in the straight spur gear. Therefore, I selected the exponential model for subsequent life estimation.
Substituting the fitted exponential function \(\Delta K = 30.3562 e^{0.4563 a}\) into the integrated Paris equation yields:
$$
N = \int_{a_o}^{a_{th}} \frac{da}{C \left(30.3562 e^{0.4563 a}\right)^m}
$$
With \(C = 4.77 \times 10^{-9}\), \(m = 2.06\), an initial crack length \(a_o = 0.01\) mm, and a critical crack length \(a_{th} = 2.0\) mm (the point at which unstable rapid propagation begins), the integral can be evaluated analytically or numerically. Performing the integration, I obtained the effective number of loading cycles for the straight spur gear as:
$$
N = 165,833 \text{ cycles}
$$
This result is significantly lower than the design life of a typical straight spur gear (which is often on the order of \(10^7\) cycles), demonstrating that the presence of a root crack drastically reduces the gear’s remaining service life.
In conclusion, this study focused on the straight spur gear crack propagation behavior using ABAQUS XFEM simulations. The main findings are:
- The tooth root fillet region is the most susceptible site for crack initiation in a straight spur gear.
- The crack propagation path obtained from simulation matches the typical failure pattern observed in practice.
- Among the tested functions, the exponential relationship \(\Delta K = 30.3562 e^{0.4563 a}\) best describes the variation of the stress intensity factor range with crack length for the straight spur gear.
- Applying the Paris formula with this relationship, the estimated life of a straight spur gear with an initial root crack of 0.01 mm is approximately 165,833 cycles, which is far below the designed infinite life. This underscores the importance of early crack detection and health monitoring in gear transmission systems.
Future work can extend this approach to consider mixed-mode crack propagation, variable loading conditions, and the influence of gear geometrical parameters on the crack growth rate and lifetime of the straight spur gear.