
Hypoid gears are critical transmission components in automotive rear axles, serving to reduce speed, increase torque, and change the direction of motion. Among various gear types, constant-depth tooth hypoid gears exhibit superior NVH (Noise, Vibration, and Harshness) performance and higher processing efficiency, leading to their widespread application in the automotive industry. The lapping process, as the final machining step for hypoid gears, plays a decisive role in determining gear transmission quality. Especially, the consistency of tooth surface contact patterns, surface roughness, and transmission errors after lapping significantly influence gear meshing noise. This paper aims to improve the lapping quality of constant-depth tooth hypoid gears in a micro-car rear axle and subsequently enhance vehicle NVH performance through systematic analysis and optimization of lapping processes.
1. Introduction and Background
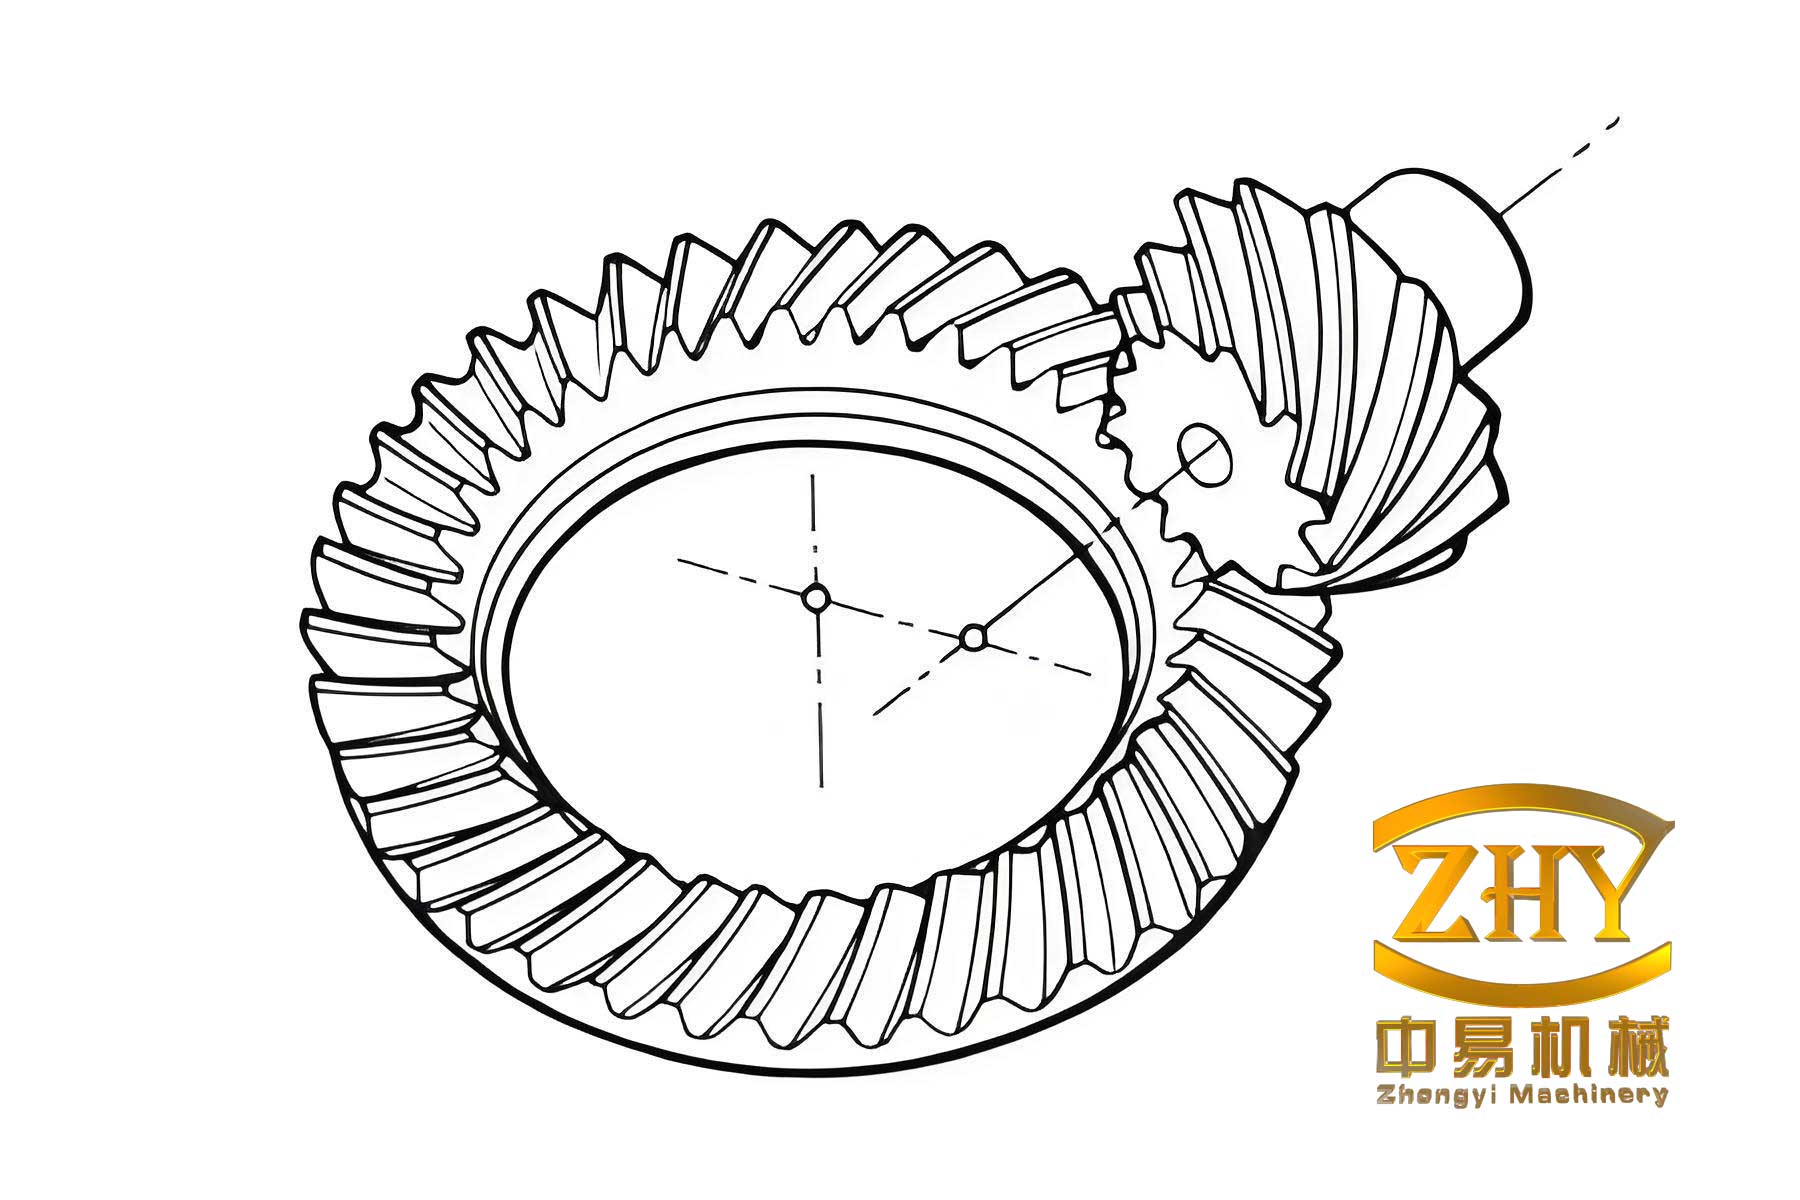
Gear transmission is one of the most widely applied and critical technologies in mechanical transmission systems. The design and manufacturing quality of gear tooth profiles directly affect the performance and quality of mechanical products. Compared with ordinary gears, hypoid gears offer advantages such as high load capacity, large transmission ratio, smooth transmission, high contact ratio, long service life, and low transmission noise. They are extensively used in industries requiring compact installation space and stable transmission performance, particularly in automotive rear axle main reducers.
According to statistical data from the National Bureau of Statistics, China’s automobile production and sales reached record highs in 2017, with production and sales volumes completing 29.02 million and 28.88 million vehicles respectively. As automobiles have become the primary mode of transportation, consumers increasingly demand better ride comfort, placing higher requirements on domestic automobile manufacturing.
The rear axle is an essential component of passenger vehicles, located at the end of the powertrain system. The main reducer within the rear axle serves to reduce speed and increase torque. Preliminary investigations revealed that constant-depth tooth hypoid gears often suffer from unstable machining quality, poor tooth surface roughness, large gear transmission errors, and poor consistency of contact patterns after lapping. These issues lead to low overall qualification rates and significant gear meshing noise, which adversely affects vehicle NVH performance. Statistical data from vehicle repair records indicates that rear axle faults primarily manifest as abnormal noise, with the main reducer gear meshing noise being the primary source of rear axle noise.
Compared with Gleason-style tapered tooth hypoid gears, Oerlikon-style constant-depth tooth hypoid gears exhibit better NVH performance. Therefore, most automotive rear axle main reducer gears adopt Oerlikon constant-depth tooth hypoid gears. Research has found that factors influencing the meshing noise of rear axle hypoid gears are numerous. Design parameters such as pressure angle, backlash, and tooth contact pattern affect the transmission stability of the main reducer, causing vibration excitation and noise in the drive axle. Additionally, the machining quality of main reducer gears significantly impacts gear meshing performance, mainly manifested in gear machining precision, tooth surface contact pattern positions, tooth surface roughness, gear transmission errors, gear deformation under load, wear, and assembly quality.
The lapping process is both the final and most crucial step in hypoid gear machining. It not only corrects deformation caused by heat treatment to some extent and reduces errors between the tooth profile and the designed tooth profile but also achieves a pre-running-in effect before gear assembly. At present, gear lapping technology primarily relies on manual experience for adjustment and tooth surface meshing pattern inspection. Post-lapping tooth surface accuracy often fails to meet requirements, with high surface roughness and inconsistent contact patterns affecting gear meshing noise. To improve the lapping quality of constant-depth tooth hypoid gears and enhance vehicle ride NVH comfort, this paper undertakes a systematic analysis and research of the lapping process.
2. Quality Analysis and NVH Testing
2.1 Current Status of Lapping Quality
Analysis of after-sales automotive feedback data revealed that rear axle problems mainly manifest as abnormal noise and whining, particularly during fifth-gear driving. During fifth-gear operation, the gear teeth experience minimal load, making the meshing noise of hypoid gears the primary noise source. To identify the impact of lapping quality on gear meshing noise, an investigation was conducted on the lapping production line.
According to the national standard GB11365-89 for bevel gear and hypoid gear accuracy, which specifies various precision indicators and tolerances including contact patterns, accuracy grades range from 0 to 12, with grade 0 being the highest. The constant-depth tooth hypoid gears in this study require grade 7 precision. The lapping standards are summarized in Table 1.
| Item | Requirement |
|---|---|
| Accuracy standard | Grade 7 |
| Contact pattern | 50%-70% along tooth length; 55%-75% along tooth height |
| Surface roughness | Ra ≤ 1μm; Rsk ≤ −0.4 |
| Transmission error (drive) | ≤ 30 μrad |
| Transmission error (coast) | ≤ 25 μrad |
| Meshing noise | ≤ 65 dB |
Investigation findings indicated that significant differences exist in the size and position of gear meshing contact patterns after lapping on the same production line, making it impossible to ensure contact pattern consistency. Various contact patterns typically appear after lapping, and these differences affect gear meshing noise, consequently influencing vehicle NVH performance after gear installation.
Post-lapping tooth surface roughness Ra values fluctuated considerably between 0.8 μm and 1.6 μm. The best Ra value reached 0.75 μm, while the worst was 1.5 μm, a difference of 0.75 μm. The design requirement specifies roughness not exceeding 1 μm, indicating a low qualification rate for post-lapping roughness. The pinion surface roughness was slightly better than that of the gear, possibly because the pinion experiences more lapping cycles during the process.
Testing of 27 gear sets for first-order transmission error at V/H=0 showed that the coast side generally met the requirement of ≤ 25 μrad, while the drive side transmission errors exceeded the required limit of 30 μrad, demonstrating a low qualification rate for the drive side.
2.2 NVH Performance Testing
To analyze the impact of lapping quality on vehicle NVH performance, comprehensive vehicle road testing was conducted. The test system consisted of LMS SCADAS Mobile SCM05 digital data acquisition front-end, ICP microphones for acoustic signal collection, rotational speed sensors, and LMS Test.Lab software for vibration and noise analysis. The system enabled order tracking to identify gear meshing noise from mixed sounds.
Test conditions included a front-engine rear-drive micro-vehicle with a 1.5L four-cylinder gasoline engine producing 82 kW maximum power. The gearbox ratio in fifth gear was 0.799, and the rear axle main reducer ratio was 4.3. Testing was conducted on smooth highways using the same test vehicle to ensure consistency, with only the main reducer being changed. For the 10-tooth pinion and 43-tooth gear set with fifth gear ratio of 0.799, the meshing frequency was 12.52 times the engine speed, making the main reducer gear meshing noise the 12.52 order component.
The qualification criterion, per enterprise standards, required the absolute value of main reducer gear meshing order noise to be ≤ 65 dB in each test condition. If one or more conditions exceeded 65 dB, the gear set was deemed unqualified.
2.2.1 Contact Pattern Effect on NVH
Two gear sets with significantly different contact patterns but similar other parameters (transmission error, roughness, tooth accuracy) were selected for NVH testing. Gear set 1 exhibited contact patterns on the drive side located in the middle slightly toward the toe, representing ideal contact per product requirements. Gear set 2 showed contact patterns biased toward the heel on the drive side with excessive tooth length contact.
Test results demonstrated that gear set 1 exhibited notably better NVH performance than gear set 2. In fifth-gear acceleration, gear set 1 showed noise values of 45-60 dB, while gear set 2 fluctuated between 47.5-65 dB. Gear set 2 also generated additional noise peaks at approximately 3100 r/min that were not present in gear set 1. Under fifth-gear deceleration, gear set 2 exhibited a maximum peak of 73.23 dB compared to 62.53 dB for gear set 1. These results confirm that contact pattern quality significantly affects NVH performance.
2.2.2 Surface Roughness Effect on NVH
Two gear sets with different surface roughness but consistent contact patterns and transmission errors were evaluated. Gear set 3 had post-lapping Ra = 1.0256 μm and Rsk = −0.4112, while gear set 4 achieved Ra = 0.94 μm and Rsk = −0.8018. The Rsk parameter, which indicates the degree of peak removal during lapping, revealed that gear set 4 underwent more effective surface correction.
NVH testing showed dramatic differences. In fifth-gear acceleration, gear set 3’s noise reached 68.67 dB while gear set 4 peaked at 64.45 dB. Under fifth-gear coasting, gear set 3 reached 68.43 dB compared to 62.46 dB for gear set 4. In the deceleration condition, gear set 4’s maximum was only 57.96 dB compared to 68.48 dB for gear set 3, an 11 dB difference clearly discernible to the human ear. These findings demonstrate that post-lapping surface roughness, particularly the Rsk value, significantly impacts vehicle NVH performance.
2.2.3 Transmission Error Effect on NVH
Transmission error represents the difference between actual and theoretical angular positions of the driven gear during transmission. In the meshing process, instantaneous transmission ratios continuously vary, exciting gear body vibration and noise. The vibration and noise level is determined by transmission error amplitude—larger fluctuation amplitudes produce greater vibration.
Two gear sets with similar contact patterns and roughness but significantly different transmission errors were tested. Gear set 5 had drive side transmission error of 61.49 μrad and coast side of 23.20 μrad, while gear set 6 had values of 26.18 μrad and 8.93 μrad respectively. NVH testing revealed that gear set 6 consistently met the 65 dB requirement, while gear set 5 exceeded 65 dB during fifth-gear acceleration at 66.07 dB and approached the limit in other conditions. These results confirm that smaller transmission errors produce lower meshing noise and better NVH performance.
3. Lapping Mechanism and Quality Factors
3.1 Cutting Mechanism of Hypoid Gear Lapping
Hypoid gear lapping removes microscopic amounts of metal from tooth surfaces. During lapping, hydraulic pumps inject lapping compound into the meshing contact area while braking torque is applied to the gear, causing the gears to squeeze abrasive grains in the compound against tooth surfaces, producing cutting action. The working principle is illustrated by the lapping cutting model where normal force (Fn) and tangential force (Fr) act on tooth surfaces when braking load is applied to the gear.
The forces on the gear tooth can be resolved into three mutually perpendicular components. Assuming the load is concentrated at the midpoint of tooth width and neglecting friction, the tangential force can be expressed as:
$$F_t = \frac{2T}{d}$$
where T is the applied torque on the gear and d is the pitch diameter. The radial and axial components are:
$$F_r = \frac{F_n}{\cos \beta_m}(\tan \alpha_n \cos \delta + \sin \beta_m \sin \delta)$$
$$F_x = \frac{F_n}{\cos \beta_m}(\tan \alpha_n \sin \delta – \sin \beta_m \cos \delta)$$
where αn is the normal pressure angle, βm is the spiral angle at the meshing point, and δ is the pitch angle.
By converting the gear tooth force analysis into an equivalent plane grinding model, the cutting depth of a single abrasive grain can be calculated as:
$$a_p = \sqrt{\frac{2F_{n0}}{\pi \cdot \delta_s \cdot \tan^2 \varepsilon}}$$
where Fn0 is the normal force on a single abrasive grain, ε is the half-apex angle of the cutting grain, and δs is the yield strength of the gear material at the lapped position.
The maximum cutting depth, which directly affects final surface roughness, is determined by:
$$a_{pmax} = \left(\frac{\eta d_g^3 p G \delta_s}{\tan^2 \varepsilon}\right)^{1/3}$$
where G = π·n·dg2·η/6 represents the grain rate, η is the volume fraction of abrasive grains, dg is the mean grain diameter, p is the contact pressure between grains and gear surface (p = Fn/A), and n is the number of grains.
From these equations, the cutting depth is positively correlated with applied torque and grain size. Proper selection of lapping parameters and compound characteristics is therefore critical for controlling surface quality.
3.2 V/H Adjustment Method
With the advancement of CNC technology, the traditional cradle-type motion model has been gradually replaced by the V/H adjustment method for lapping motion control. This modern approach enables multi-axis coordinated control and flexible adjustment of contact patterns to arbitrary positions while maintaining optimal lapping paths.
The V/H adjustment model simultaneously controls vertical offset movement (V) and horizontal movement (H). Adjusting the vertical offset changes the contact pattern position along the tooth length direction, while horizontal movement along the pinion axis adjusts the contact pattern along tooth height. Diagonal contact can be corrected through coordinated V/H adjustment. A third motion (G) controls the pinion movement along the gear axis to maintain constant backlash.
The mathematical relationship between V/H adjustments and contact pattern movement was established through coordinate system transformations and gear meshing condition equations. The gear tooth surfaces in the fixed machine coordinate system can be expressed as:
$$r_h = r_m(u_i, \theta_i, \phi_1, V, H, J)$$
$$n_h = n_h(u_i, \theta_i, \phi_1)$$
where ui and θi are tooth surface parameters, φ1 is the meshing rotation angle, and V, H, J are the adjustment parameters. The meshing conditions require position and normal vector coincidence:
$$r_{h1}(u_1, \theta_1; \phi_1, V, H, J) = r_{h2}(u_2, \theta_2, \phi_2)$$
$$n_{h1}(u_1, \theta_1; \phi_1) = n_{h2}(u_2, \theta_2; \phi_2)$$
The backlash control equation based on gear spatial position relationships is:
$$H + J \tan \delta_2 + \sqrt{r_2^2 – E^2} – \sqrt{r_2^2 – V^2} = 0$$
3.3 Factors Affecting Lapping Quality
Using a comprehensive “man-machine-material-method-environment” analysis framework, the primary factors affecting lapping quality were identified as:
(1) Lapping compound: The oil-to-abrasive mixing ratio, abrasive grain size, number of grains per unit volume, and supply flow rate all influence cutting depth. The lapping mechanism analysis showed that cutting depth is inversely proportional to grain count per unit area but proportional to grain diameter.
(2) Equipment parameters: The applied braking torque on the gear determines tooth surface normal pressure. The lapping cutting depth increases with braking torque, resulting in higher material removal rate but potentially poorer surface roughness. Spindle speed affects cutting velocity and efficiency. Backlash determines the entry of lapping compound into the meshing zone—too small a gap prevents adequate compound entry while excessive gap reduces cutting pressure.
(3) Contact pattern and lapping path: The pre-lapping contact pattern position must be controlled for effective correction. Lapping path design determines material removal distribution across tooth surfaces.
4. Lapping Compound Selection and Parameter Optimization
4.1 Lapping Compound Selection
The lapping compound consists of abrasive grains suspended in a carrier oil. Green silicon carbide (SiC) was selected as the abrasive material due to its excellent cutting ability, thermal conductivity, high-temperature resistance, and corrosion resistance. Its Vickers hardness is 3200-3400 kg/mm² with over 98.5% SiC content.
The YQ-3 high-suspension lapping oil was selected as the carrier, comprising mechanical oil, gear oil, stator oil, kerosene, grease, stearic acid, and Vaseline. This combination provides suspension, lubrication, cooling, and appropriate viscosity characteristics.
To determine the optimal compound formulation, the density method was employed. The imported lapping compound density of ρcompound = 1.5 g/cm³ was used as a reference. With silicon carbide density ρ1 = 3.22 g/cm³ and carrier oil density ρ2 = 0.85 g/cm³, the mixing ratio was calculated using:
$$\rho_{mixed} = \frac{\rho_1 V_1 + \rho_2 V_2}{V_1 + V_2}$$
When V1:V2 = 1:3, the resulting density was 1.54 g/cm³, closely matching the imported compound. The oil-to-abrasive ratio and abrasive grain size were confirmed through systematic lapping experiments.
| Oil-to-abrasive ratio | Ra (drive)/μm | Rsk (drive) | Ra (coast)/μm | Rsk (coast) |
|---|---|---|---|---|
| 1:1 | 1.4611 | -0.0499 | 1.5203 | 0.0226 |
| 1:3 | 1.3209 | -0.2425 | 1.3850 | -0.2280 |
| 1:5 | 1.3396 | -0.1193 | 1.5150 | -0.1563 |
The 1:3 ratio yielded the best overall roughness improvement. The 1:1 ratio likely suffered from excessive concentration, reducing compound flow into the meshing zone, while the 1:5 ratio lacked sufficient abrasive particles for effective peak removal.
| Grain size | Ra (drive)/μm | Rsk (drive) | Ra (coast)/μm | Rsk (coast) |
|---|---|---|---|---|
| 240# | 1.3211 | -0.2425 | 1.2379 | -0.2056 |
| 280# | 1.2391 | -0.3533 | 1.2741 | -0.2183 |
| 320# | 1.1095 | -0.4967 | 1.1212 | -0.3050 |
The 320# grain size provided the best surface quality with Rsk values approximately half those achieved with 240# grains, without causing lapping burns or reducing efficiency. The lapping compound formulation was finalized as green silicon carbide abrasive with 320# grain size mixed with YQ-3 suspension oil at a 1:3 volume ratio.
4.2 Orthogonal Experiment for Parameter Optimization
To optimize lapping equipment parameters, an orthogonal experiment was designed with three factors at three levels each: spindle speed (A), braking torque (B), and backlash (C). The L9(3⁴) orthogonal array was employed, as shown in Table 4.
| Level | A: Speed (r/min) | B: Torque (Nm) | C: Backlash (mm) |
|---|---|---|---|
| 1 | 600 | 2 | 0.07 |
| 2 | 800 | 3.5 | 0.09 |
| 3 | 1000 | 5 | 0.11 |
| Test No. | A | B | C | Speed/r/min | Torque/Nm | Backlash/mm |
|---|---|---|---|---|---|---|
| 1 | 1 | 1 | 1 | 600 | 2 | 0.07 |
| 2 | 1 | 2 | 2 | 600 | 3.5 | 0.09 |
| 3 | 1 | 3 | 3 | 600 | 5 | 0.11 |
| 4 | 2 | 1 | 2 | 800 | 2 | 0.09 |
| 5 | 2 | 2 | 3 | 800 | 3.5 | 0.11 |
| 6 | 2 | 3 | 1 | 800 | 5 | 0.07 |
| 7 | 3 | 1 | 3 | 1000 | 2 | 0.11 |
| 8 | 3 | 2 | 1 | 1000 | 3.5 | 0.07 |
| 9 | 3 | 3 | 2 | 1000 | 5 | 0.09 |
Each test group included 3 gear sets to minimize random errors, with post-lapping contact patterns evaluated as the primary qualification criterion. Surface roughness (Ra and Rsk values) and transmission error (SFT) were selected as quantitative evaluation indicators.
The experimental results for the drive side are presented in Table 5.
| Test No. | Speed | Torque | Backlash | Ra/μm | Rsk | SFT/μrad |
|---|---|---|---|---|---|---|
| 1 | 1 | 1 | 1 | 1.3453 | 0.1133 | 45.77 |
| 2 | 1 | 2 | 2 | 1.4404 | -0.1709 | 57.45 |
| 3 | 1 | 3 | 3 | 1.3041 | 0.0841 | 46.61 |
| 4 | 2 | 1 | 2 | 1.4504 | 0.0363 | 47.75 |
| 5 | 2 | 2 | 3 | 1.2516 | -0.1467 | 48.63 |
| 6 | 2 | 3 | 1 | 1.3343 | -0.1233 | 47.43 |
| 7 | 3 | 1 | 3 | 1.2543 | -0.4176 | 28.35 |
| 8 | 3 | 2 | 1 | 1.2805 | -0.7864 | 41.98 |
| 9 | 3 | 3 | 2 | 1.4574 | -0.1878 | 44.05 |
Range analysis was performed to determine the influence priority of each factor. For the Ra indicator, the range values were: RA = 0.033, RB = 0.041, RC = 0.179, indicating the factor influence priority B > A > C for Ra. For Rsk, the ranges were RA = 0.473, RB = 0.292, RC = 0.158, giving priority A > B > C. For SFT, the ranges were RA = 11.82, RB = 8.73, RC = 8.55, giving priority A > B > C.
Since different indicators suggested different optimal combinations, a regression scoring method based on least squares was employed to integrate multiple indicators. Each indicator was normalized to a 1-10 scoring scale, and based on the relative importance of each indicator (Rsk being most reflective of lapping quality, followed by Ra and SFT), weights of 2, 3, and 2 were assigned to Ra, Rsk, and SFT respectively. The comprehensive score was calculated as:
$$\text{Score} = 2 \times \text{Ra Score} + 3 \times \text{Rsk Score} + 2 \times \text{SFT Score}$$
Multiple linear regression analysis was performed with the comprehensive score as the dependent variable and the three indicators as independent variables. The regression equation obtained was:
$$Y = 173.43 – 87.48x_1 – 30.00x_2 – 0.62x_3$$
where x1 is Ra, x2 is Rsk, and x3 is SFT. The statistical significance was verified (F = 1.9886, P < 0.05), confirming the validity of the regression model. Range analysis of the regression scores identified the optimal parameter combination as A₃B₂C₃, i.e., speed = 1000 r/min, torque = 3.5 Nm, and backlash = 0.11 mm.
Analysis of variance (ANOVA) was conducted to distinguish genuine factor effects from experimental error. The results showed that factors A and C were statistically significant at the α = 0.10 level, while factor B showed lower significance.
| Factor | Sum of Squares | df | Mean Square | F-value | Significance |
|---|---|---|---|---|---|
| A (Speed) | 981.43 | 2 | 490.72 | 12.83 | ** |
| B (Torque) | 159.27 | 2 | 79.63 | 2.08 | – |
| C (Backlash) | 882.06 | 2 | 441.03 | 11.53 | ** |
| Error | 76.48 | 2 | 38.24 | – | – |
| Total | 2099.25 | 8 | – | – | – |
The ANOVA confirmed that speed is the most significant factor affecting lapping quality, followed by backlash, with torque being less significant. Analysis of the coast side data yielded the same optimal combination.
4.3 Verification of Optimized Parameters
Three gear sets were lapped using the optimized parameters (speed = 1000 r/min, torque = 3.5 Nm, backlash = 0.11 mm) and the newly formulated lapping compound. The results were compared with pre-optimization performance (speed = 800 r/min, torque = 2 Nm, backlash = 0.07 mm).
| Sample | Ra (drive)/μm | Rsk (drive) | SFT (drive)/μrad | Ra (coast)/μm | Rsk (coast) | SFT (coast)/μrad |
|---|---|---|---|---|---|---|
| 1# | 0.9012 | -0.7290 | 26.18 | 0.8418 | -0.6425 | 7.268 |
| 2# | 0.8874 | -0.8227 | 27.74 | 0.8633 | -0.7533 | 8.799 |
| 3# | 0.9326 | -0.6029 | 31.29 | 0.9475 | -0.6932 | 10.12 |
| 4# (before) | 1.3041 | -0.1065 | 46.61 | 1.2273 | 0.1102 | 14.50 |
The optimized parameters reduced Ra by approximately 0.4 μm and Rsk by approximately 0.6 on the drive side. Transmission error decreased by approximately 15-20 μrad on the drive side. Contact patterns after lapping met product requirements with good consistency across all three gear sets.
Vehicle NVH testing of the three optimized gear sets showed all results within the 65 dB qualification limit. The typical performance is summarized in Table 7.
| Sample | Fifth-gear acceleration peak/dB | Fifth-gear coasting peak/dB | Fifth-gear deceleration peak/dB |
|---|---|---|---|
| 1# | 57.30 | 59.00 | 58.63 |
| 2# | 62.92 | 59.57 | 62.36 |
| 3# | 59.51 | 55.68 | 58.20 |
5. Lapping Quality Control and Management
5.1 Equipment and Fixture Accuracy Control
Fixture accuracy directly affects gear installation distance during lapping, consequently influencing the meshing point position on tooth surfaces. To understand accuracy degradation patterns, fixtures were tracked over one month of production use. The measurements showed that end face runout increased from 6 μm after calibration to approximately 10 μm after half a month, while radial runout increased from 12 μm to approximately 16 μm over the same period.
Based on these degradation patterns, control standards were established: end face runout limit of 10 μm and radial runout limit of 15 μm, with fixture accuracy verification required weekly.
5.2 Lapping Compound Management
During the lapping process, abrasive grains undergo fracture and dulling due to repeated compression and cutting actions. Additionally, lapping compound is carried away with each processed gear set. Consumption measurement showed that approximately 2 liters of lapping compound were consumed per 100 gear sets processed.
To maintain consistent compound quality, the management protocol specifies: adding 1 liter of fresh compound for every 50 gear sets processed, conducting iron chip removal every 100 gear sets (approximately twice daily), and completely replacing all lapping compound every 10 days (or after 2000 gear sets) based on experimental investigation of compound degradation.
The degradation experiment tracked post-lapping Rsk values over continuous processing. Results showed that when processing under 2000 gear sets, Rsk values remained between −0.66 and −0.4, indicating satisfactory lapping quality. After 3200 gear sets, Rsk values stabilized around −0.1, indicating significantly degraded performance requiring compound replacement.
5.3 Pre-Lapping Contact Pattern Classification
To ensure post-lapping contact pattern consistency, gears must be classified before lapping based on their pre-lapping (post-heat-treatment) contact patterns. A standardized classification system was established by dividing the tooth surface into zones: three zones along tooth height (toe region, middle, and heel) and six equal zones along tooth length. This classification reduces subjectivity and provides clear guidelines for matching gear sets with appropriate lapping parameters and paths.
The pre-lapping contact patterns are classified into four categories according to the position of the contact pattern center relative to tooth boundaries. Category 1 represents the ideal position (middle slightly toward the toe), Category 2 includes acceptable positions (middle slightly toward the heel or close to the toe), while Category 3 comprises patterns requiring special attention (biased toward either end). Each classification corresponds to specific lapping parameter settings and path designs, enabling targeted correction and ensuring consistent post-lapping quality.
6. Summary and Conclusions
This research systematically investigated the lapping quality of constant-depth tooth hypoid gears in automotive rear axles and established a comprehensive optimization methodology. The main findings are summarized as follows:
(1) The lapping quality of hypoid gears, including contact patterns, surface roughness, and transmission errors, significantly affects vehicle NVH performance. Specifically, surface roughness Rsk exhibited the most pronounced effect on meshing noise, with better surface quality directly translating to improved NVH performance. Contact patterns that appear acceptable statically may produce abnormal noise under load if positioned too close to tooth edges.
(2) The lapping cutting mechanism analysis established a mathematical model linking cutting depth to process parameters, providing theoretical guidance for parameter selection. The V/H adjustment method for lapping motion control was analyzed, and the mathematical relationship between V/H adjustments and contact pattern movement was derived for hypoid gears.
(3) Through systematic compound selection experiments, the optimal lapping compound formulation was determined as green silicon carbide abrasive with 320# grain size mixed with YQ-3 suspension oil at a 1:3 volume ratio. This formulation achieved lower roughness values and better peak removal compared with the previous compound.
(4) Orthogonal experimental design combined with least-squares regression scoring analysis identified the optimal lapping parameters: spindle speed of 1000 r/min, braking torque of 3.5 Nm, and backlash of 0.11 mm. Analysis of variance confirmed speed as the most influential factor, followed by backlash and torque.
(5) Verification experiments confirmed that the optimized parameters reduced drive side Ra by approximately 0.4 μm, Rsk by approximately 0.6, and transmission error by approximately 18 μrad. Vehicle NVH testing showed all gear sets met the 65 dB qualification requirement, with several achieving noise levels below 60 dB.
(6) Comprehensive quality control standards were established, including fixture accuracy verification schedules, lapping compound management protocols (addition frequency, iron chip removal, and replacement cycle), and standardized pre-lapping contact pattern classifications. These measures ensure consistent lapping quality in batch production.
This research provides valuable insights into the lapping process for hypoid gears and establishes an optimization methodology that can be applied to improve gear quality and NVH performance in automotive rear axle applications. The findings contribute to advancing the understanding of hypoid gear lapping technology and offer practical guidance for production optimization.