
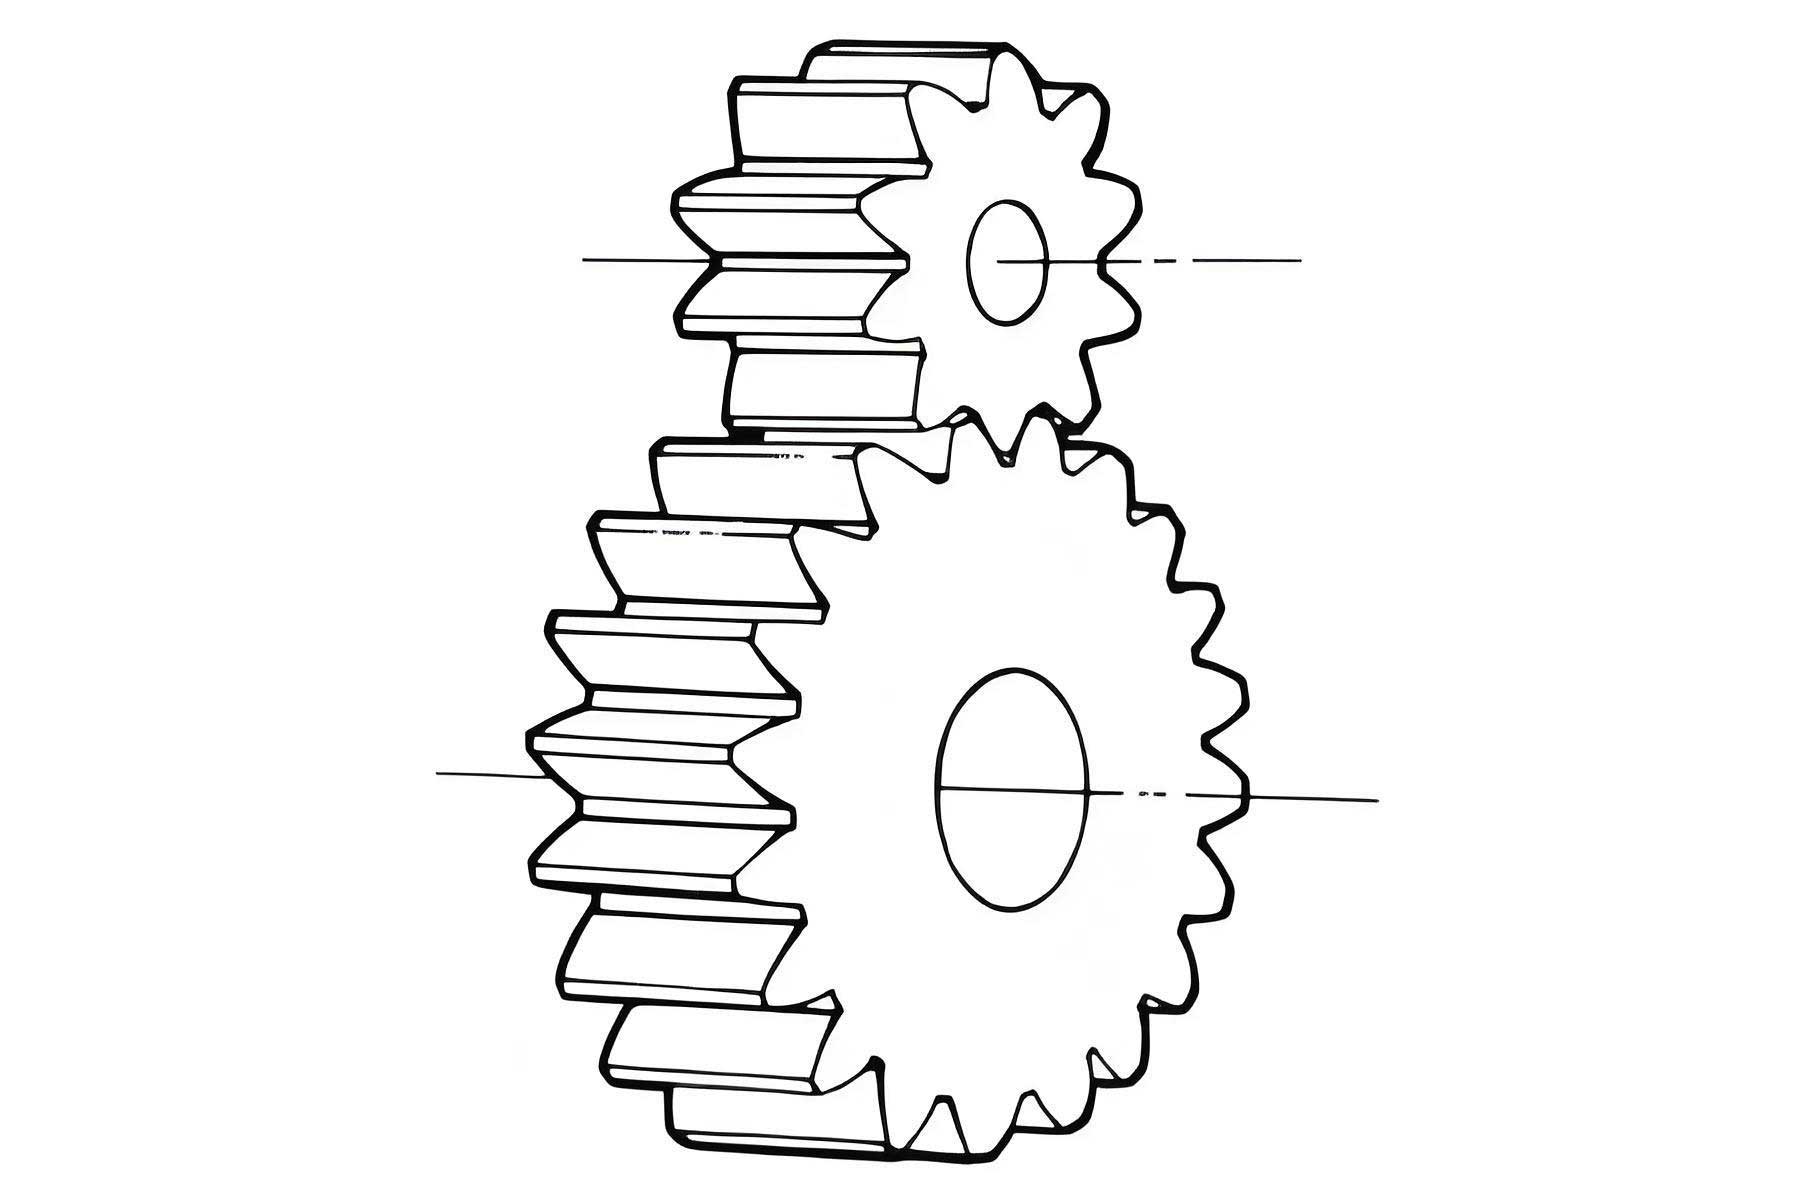
In modern mechanical systems, spur gears are among the most widely used transmission components. Their performance directly affects the reliability and efficiency of industrial equipment. Lubrication is essential to reduce friction and wear, but in real operating environments, the lubricating oil inevitably contains solid particles such as dust, wear debris, and other contaminants. These particles mix with the oil to form a liquid–solid two-phase fluid, which significantly alters the lubrication regime and accelerates surface damage. The present work focuses on the lubrication and wear behavior of spur gears under the influence of solid particles and surface roughness. I develop theoretical models based on the lattice Boltzmann method (LBM) and the finite difference method (FDM) to study the oil film pressure, film thickness, friction, and wear evolution on the tooth flank. The results provide useful insights for predicting the wear state and improving the service life of spur gear transmissions.
1. Introduction
Friction and wear are inevitable in mechanical systems. According to the Jost report, enormous economic losses are caused by wear every year. For spur gears, which transmit power through meshing teeth, the contact area is subjected to high stresses and relative sliding. Although lubricants are applied to separate the surfaces, the presence of solid particles in the oil changes the flow behavior and load-carrying capacity of the film. Studies have shown that particle size, concentration, and motion state can either improve or degrade the lubrication performance. In most cases, particles smaller than the film thickness increase the effective viscosity, while particles larger than the film thickness directly contact the asperities and cause abrasive wear. Therefore, understanding the coupled effects of solid particles and surface roughness on spur gear lubrication is of great importance.
The elastohydrodynamic lubrication (EHL) theory has been widely used to analyze gear contacts. The classical Reynolds equation assumes a smooth, pure fluid. However, in practice the tooth surfaces are rough and the lubricant contains discrete solid particles. To describe such a system, two complementary approaches are employed here. The lattice Boltzmann method (LBM) treats the fluid at the mesoscopic level and can naturally handle complex boundaries and multiphase flows. The finite difference method (FDM) solves the macroscopic Reynolds equation with modified viscosity and density relations. Both methods are applied to spur gear contacts, and the results are compared.
Furthermore, wear prediction is essential for gear design. The Archard wear model is widely accepted for adhesive wear. By combining the lubrication analysis with the Archard equation, I compute the wear depth along the tooth profile under different numbers of meshing cycles. This enables the identification of critical wear regions on spur gears.
2. Numerical Models
2.1 Lubrication model based on the lattice Boltzmann method
The gear contact is simplified as a two-dimensional Couette flow between two moving surfaces with a small gap representing the oil film. The contact width is \(2b\) (where \(b\) is the Hertzian contact half-width) and the film thickness is \(h\). A solid particle is placed inside the flow domain. The fluid is assumed to be incompressible and isothermal. I use the D2Q9 lattice model with multiple relaxation time (MRT) for better numerical stability. The evolution equation for the density distribution function is written as:
\[
f_i(\mathbf{x}+\mathbf{c}_i\delta_t, t+\delta_t) – f_i(\mathbf{x},t) = -\mathbf{M}^{-1}\mathbf{S}\left[\mathbf{m}(\mathbf{x},t)-\mathbf{m}^{(eq)}(\mathbf{x},t)\right] + \mathbf{M}^{-1}\mathbf{F}
\]
where \(\mathbf{M}\) is the transformation matrix, \(\mathbf{S}\) is the diagonal relaxation matrix, \(\mathbf{m}\) and \(\mathbf{m}^{(eq)}\) are the moment and equilibrium moment vectors, and \(\mathbf{F}\) is the forcing term arising from the presence of the particle. The macroscopic density and velocity are obtained from the distribution function:
\[
\rho = \sum_{i=0}^{8} f_i, \qquad \rho \mathbf{u} = \sum_{i=0}^{8} f_i \mathbf{c}_i
\]
The pressure is calculated from the equation of state as \(p = \rho c_s^2\), where \(c_s = 1/\sqrt{3}\) in lattice units. The boundary conditions used in this work are the standard bounce-back format for the solid walls, the non-equilibrium extrapolation format at the inlet, and the constant pressure outlet. The particle boundary is treated by an immersed boundary technique where a force is added to the lattice nodes near the particle.
To relate the physical parameters to the lattice parameters, I employ the following transformations based on the Reynolds number similarity:
\[
U_R = \frac{u – u_{min}}{u_{max} – u_{min}}, \qquad C_l = \frac{L}{l}, \qquad C_t = \frac{l}{C_l u_c}, \qquad C_{\mu} = \frac{\mu_c l}{C_t^2}
\]
where \(L\) is the physical contact width, \(l\) is the number of lattice nodes, \(u_c\) is the characteristic velocity, and \(\mu_c\) is the lattice viscosity. The relaxation factor \(\tau\) is given by:
\[
\tau = \frac{1}{2} + \frac{\mu_c (1/2)}{3 C_t}
\]
2.2 Finite difference model for liquid–solid two-phase lubrication
For the macroscopic analysis, I use the Reynolds equation modified for a fluid containing spherical solid particles. The modified Reynolds equation takes the form:
\[
\frac{d}{dx}\left( \frac{\rho \phi(N,l,h) h^3}{12\eta} \frac{dp}{dx} \right) = u_s \frac{d(\rho h)}{dx}
\]
where \(\phi(N,l,h)\) is the flow factor accounting for the presence of particles:
\[
\phi(N,l,h) = \frac{h^3}{l^3} + 6 \frac{h}{l} – 12 \frac{h^2 N l}{2} \coth\left(\frac{N l}{2}\right)
\]
Here \(N\) is the coupling number, \(l\) is the particle diameter, \(h\) is the local film thickness, \(\rho\) is the density, \(\eta\) is the viscosity, and \(u_s\) is the entrainment velocity. The film thickness equation includes the elastic deformation of the contacting surfaces:
\[
h(x) = h_0 + \frac{x^2}{2R} + v(x)
\]
where \(v(x)\) is the elastic displacement due to the pressure distribution over the domain \([s_1, s_2]\):
\[
v(x) = -\frac{2}{\pi E’} \int_{s_1}^{s_2} p(s) \ln|x-s| \, ds
\]
with \(E’\) the effective elastic modulus. The pressure–density and pressure–viscosity relationships are expressed as:
\[
\rho = \rho_0 \left(1 + \frac{0.6p}{1+1.7p}\right)
\]
\[
\eta = \eta_0 \left[1 + \frac{2.5 \lambda_p}{1 – \rho_p/\rho_h}\right] \exp(\alpha p)
\]
where \(\lambda_p\) is the particle mass concentration, \(\rho_p\) is the particle density, \(\rho_h\) is the oil density, and \(\alpha\) is the pressure–viscosity coefficient. The load balance condition must be satisfied:
\[
\int_{x_0}^{x_e} p(x) dx = w
\]
where \(w\) is the applied line load. The finite difference discretization of the Reynolds equation is solved using a Gauss–Seidel iteration for low loads and a Jacobi iteration for heavy loads. The convergence criterion is that the relative error in the pressure field is less than \(10^{-4}\) and the load balance error is within the prescribed tolerance.
3. Lubrication Analysis of Spur Gears with Solid Particles
3.1 LBM simulation of a single particle in the Hertz contact zone
The physical parameters used in the LBM simulation are listed in Table 1.
| Parameter | Value |
|---|---|
| Lubricant density (kg/m³) | 870 |
| Lubricant viscosity (Pa·s) | 0.13086 |
| Minimum film thickness (µm) | 0.2 |
| Contact half-width (µm) | 110 |
| Relative velocity (m/s) | 0.232 |
In the lattice simulation, the contact width is represented by 22000 lattice nodes and the film thickness direction by 20 nodes. The particle diameter is 10 lattice units. The particle rotation speed is normalized by the surface velocity as \(\phi = u_p / U_R\). Figure 1 shows the velocity distributions for different particle rotation conditions. For a stationary particle, the flow is blocked and the velocity near the particle decreases. When the particle rotates, the local Reynolds number increases and vortices appear around the particle. These disturbances alter the pressure distribution significantly.
I analyzed the pressure variation along the film thickness direction at the center of the contact region. Without any particle, the pressure is constant across the film thickness. With a particle, the pressure is no longer uniform. A counterclockwise rotating particle reduces the pressure gradient in the film thickness direction, while a clockwise motion increases it. In the wake of the particle, the pressure is generally higher than the particle-free case.
The effect of the equivalent radius of curvature on the pressure distribution is also studied. As the radius increases, the maximum contact pressure decreases because the contact area becomes larger. The LBM results confirm that the pressure distribution follows the expected trend.
3.2 Finite difference results for particle-laden EHL of spur gears
Using the finite difference model described in Section 2.2, I computed the minimum film thickness and pressure distribution for a particle concentration of 0.5% and a particle diameter of 0.6 µm. The gear material and operating parameters are given in Table 2.
| Parameter | Value |
|---|---|
| Number of teeth (drive/driven) | 29 / 45 |
| Module (mm) | 4 |
| Face width (mm) | 30 |
| Pressure angle (°) | 20 |
| Young’s modulus (GPa) | 221 |
| Poisson’s ratio | 0.3 |
| Surface roughness Ra (µm) | 0.6 |
| Particle modulus (GPa) | 36.5 |
| Particle density (kg/m³) | 2250 |
| Particle shear stress (N/m²) | 4×10⁷ |
First, I investigated the influence of load on the lubrication performance. The results for a speed of 0.8 m/s and a radius of curvature of 0.01 m are shown in Figure 2. As the load increases from 10 kN/m to 100 kN/m, the minimum film thickness decreases because the higher pressure squeezes the oil out. The pressure in the inlet zone decreases, while the contact pressure increases. The secondary pressure peak becomes lower and moves toward the outlet.
Next, the radius of curvature was varied from 0.01 m to 0.03 m. The minimum film thickness increases with the radius due to the larger contact area and lower mean pressure. The pressure distribution shows that the contact pressure decreases with increasing radius, and the secondary peak shifts to the left.
4. Effects of Roughness and Solid Particles on Lubrication
In realistic spur gear contacts, the surface roughness cannot be neglected. I generated a Gaussian random roughness profile with an RMS value of 0.6 µm and superimposed it on the nominal film thickness. The presence of both roughness and particles leads to a wavy film shape and pressure fluctuations. The modified Reynolds equation is solved for different operating conditions.
4.1 Influence of entrainment velocity
Taking an entrainment speed range of 0.6–1.4 m/s, the film thickness increases with speed, as shown in Figure 3. The pressure peak in the contact zone decreases with increasing speed, while the inlet pressure rises. The secondary pressure peak also diminishes. This indicates that higher speeds promote better hydrodynamic separation and reduce the risk of asperity contact.
4.2 Influence of radius of curvature
For a speed of 0.8 m/s and a load of 100 kN/m, the radius of curvature was varied from 0.01 m to 0.03 m. The results are similar to the smooth case: the film thickness grows with radius, and the pressure variation amplitude decreases. The waviness caused by roughness becomes less pronounced when the radius is large.
4.3 Influence of particle concentration
Particle concentration was varied from 0 to 7%. As shown in Figure 4, the presence of particles increases the contact area because particles become trapped between the rough asperities and deform elastically. The minimum film thickness changes only slightly with concentration, but the pressure distribution changes noticeably. The peak pressure in the contact zone increases when particles are present, while the secondary pressure peak decreases and shifts leftward with increasing concentration.
4.4 Influence of particle size on friction
In mixed lubrication, the total friction force consists of three components: the viscous fluid friction \(F_n\), the asperity contact friction \(F_c\), and the particle shear friction \(F_p\):
\[
F = F_n + F_c + F_p
\]
For particle diameters from 0.5 µm to 1 µm, the particle-induced friction increases monotonically, but the rate of increase gradually slows down. This is because larger particles are more likely to be trapped and sheared between the surfaces, yet there is a limit to how many particles can enter the contact zone.
5. Wear Calculation of Spur Gears with Particles
5.1 Contact analysis along the tooth profile
I performed a full profile analysis of a pair of spur gears with the parameters given in Table 2. The tooth profile is discretized into 100 points along the direction of mesh. The radii of curvature of the driving and driven gears vary with the meshing position. The equivalent radius of curvature first increases and then decreases along the line of action. The contact stress is highest at the lowest point of single tooth contact (point A) due to the abrupt change from double to single pair meshing. This indicates that the region near the root of the driving gear is more prone to wear.
5.2 Lubrication regime identification
The film thickness ratio \(\lambda\) is used to classify the lubrication state:
\[
\lambda = \frac{h_{min}}{\sqrt{\sigma_1^2 + \sigma_2^2}}
\]
where \(\sigma_1\) and \(\sigma_2\) are the RMS roughness values of the two surfaces. When \(\lambda > 3\), full elastohydrodynamic lubrication prevails. When \(0.5 < \lambda < 3\), mixed lubrication occurs. When \(\lambda < 0.5\), boundary lubrication dominates. The computed film thickness and film thickness ratio maps are shown in Figures 5 and 6. For typical operating conditions with a speed of 450 r/min and a load of 900 N·m, the entire meshing zone is in mixed lubrication with \(\lambda\) between 0.8 and 2.0. Increasing the rotational speed or decreasing the load can increase \(\lambda\).
5.3 Archard wear model
The Archard wear equation is expressed as:
\[
V = K \frac{W S}{H}
\]
where \(V\) is the wear volume, \(K\) is the dimensionless wear coefficient, \(W\) is the normal load, \(S\) is the sliding distance, and \(H\) is the hardness of the surface. For a local point on the tooth flank, the incremental wear depth can be written as:
\[
dh = k p ds
\]
where \(k\) is the dimensional wear coefficient, \(p\) is the local contact pressure, and \(ds\) is the incremental sliding distance. By integrating over the meshing cycle, the cumulative wear depth at point \(Q\) after \(n\) cycles is:
\[
h_{Q,n} = h_{Q,n-1} + \Delta t \, k_n \, N \, \sum_{i=1}^{m} p_{Qi} v_{Qi}
\]
Here \(N\) is the number of meshing cycles per wear cycle, \(p_{Qi}\) and \(v_{Qi}\) are the pressure and sliding velocity at time \(i\). The wear coefficient \(k\) depends on the film thickness ratio according to the dynamic wear coefficient relation:
\[
k = \begin{cases}
k_0, & \lambda < 0.5 \\
\frac{k_0}{2} + \frac{k_0}{7}(4 – \lambda), & 0.5 \leq \lambda < 4 \\
0, & \lambda \geq 4
\end{cases}
\]
where \(k_0\) is the boundary lubrication wear coefficient.
5.4 Friction coefficient
The friction coefficient in mixed lubrication is obtained as a weighted average of the boundary and elastohydrodynamic components:
\[
f_{mix} = f_{\lambda} f_e^{1.2} + (1 – f_{\lambda}) f_b
\]
where \(f_e\) is the EHL friction coefficient, \(f_b = 0.15\) is the boundary friction coefficient, and \(f_{\lambda}\) is the load sharing factor defined by:
\[
f_{\lambda} = \frac{1}{1 + 0.37 \lambda^{1.26}}
\]
The EHL friction coefficient is calculated from empirical formulae based on operating parameters such as speed, load, and surface roughness.
5.5 Results of friction and wear
Figures 7 and 8 show the friction coefficient and friction force distributions along the line of action for different speeds and loads. In general, the friction coefficient first decreases, then increases near the pitch point, and finally decreases again. The maximum friction occurs at the pitch point because the sliding motion reverses there. Higher speeds reduce the friction coefficient, whereas higher loads increase it. The presence of particles causes small fluctuations in the friction coefficient in the region near the root where the film is thin.
The sliding coefficient and sliding distance are also computed along the tooth profile. The sliding coefficient is zero at the pitch point. The driving gear has a larger sliding distance in the dedendum region, while the driven gear has a larger sliding distance in the addendum region. This is consistent with the kinematics of involute gearing.
The cumulative wear depth after 3 million, 6 million, and 9 million cycles is shown in Figure 9. Both the driving and driven gears show the same qualitative trend: wear depth is largest near the root adjacent to the pitch point, and the wear in the addendum region is relatively small. The driving gear suffers more wear in the dedendum region because it completes more meshing cycles than the driven gear for the same operating time. In the addendum region, the wear amounts of the two gears are nearly equal.
In addition, I studied the effect of particle concentration and size on the wear. For a particle diameter of 0.6 µm, the presence of particles increases the friction force slightly in the dedendum region. When the particle diameter exceeds the local minimum film thickness, the particles directly contact the asperities and cause additional abrasive wear. Therefore, particle filtering and regular oil changes are important for the reliable operation of spur gear transmissions.
6. Conclusion
In this work, I investigated the lubrication and wear behavior of spur gears under the combined influence of solid particles and surface roughness. The main conclusions are as follows:
- The lattice Boltzmann method can successfully simulate the flow behavior in the Hertz contact zone of spur gears. The presence of a single particle creates vortices and pressure fluctuations that cannot be captured by the classical Reynolds equation with uniform pressure across the film. The results agree with the finite difference method for different radii of curvature.
- The finite difference analysis of particle-laden EHL shows that the minimum film thickness decreases with increasing load and increases with increasing radius of curvature. The secondary pressure peak moves with load and radius changes.
- When both roughness and particles are considered, the film thickness becomes wavy. Increasing the entrainment velocity increases the film thickness and decreases the pressure peak. Increasing the particle concentration slightly changes the minimum film thickness but significantly alters the pressure distribution. Larger particle sizes increase the particle-induced friction force.
- The wear analysis based on the Archard model reveals that the cumulative wear depth after millions of cycles is highest near the pitch point on the root side, for both driving and driven gears. The driving gear wears more in the dedendum region due to a larger number of meshing cycles. The wear in the addendum region is similar for both gears.
- Solid particles in the lubricant accelerate the wear process, especially in regions where the oil film is thinner than the particle size. Regular oil filtration and proper surface finishing are recommended to mitigate the harmful effects of particles on spur gear performance.
The findings provide a theoretical basis for predicting the wear state and improving the reliability of spur gear transmissions operating in contaminated environments.