
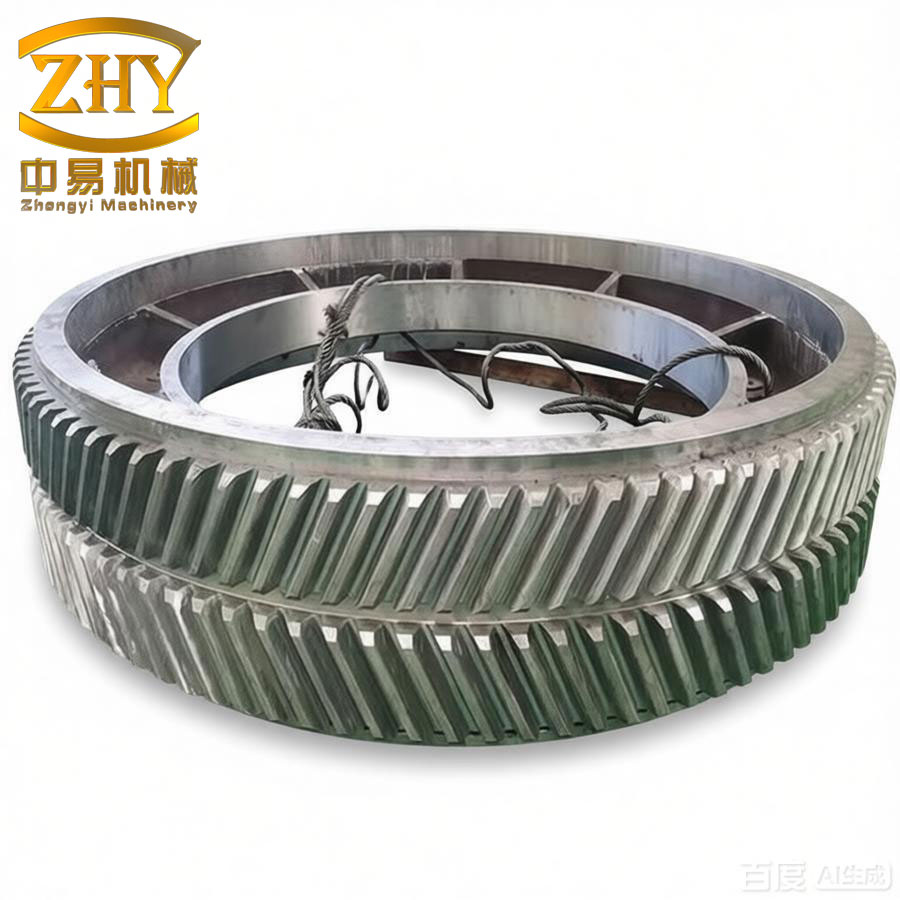
In my research, I focused on the influence of shot peening process parameters on the surface morphology and residual stress of herringbone gears made of 10CrNi2Mo3Cu2V heat-resistant steel. The herringbone gear is widely used in high-speed and heavy-load transmission systems, and its surface integrity directly affects fatigue life and wear resistance. To improve the predictability of shot peening outcomes, I built a sequential DEM-FEM coupling model, calibrated the material constitutive law through Hopkinson bar tests, and proposed a computational framework for Almen intensity based on actual process parameters.
1. Material Constitutive Model
Since the accuracy of the target material model strongly influences the simulation results, I performed split Hopkinson pressure bar tests on 10CrNi2Mo3Cu2V steel specimens. The material was heat-treated to a hardness of 769 HV. Cylindrical specimens with a diameter of 3 mm and a height of 3 mm were tested under strain rates from 1000 s⁻¹ to 5000 s⁻¹ and temperatures from 25 °C to 600 °C. The measured true stress-strain curves showed that the yield strength increases with strain rate and decreases with temperature.
I fitted the experimental data to the Johnson-Cook constitutive equation:
$$ \sigma = \left( A + B \varepsilon_{\text{eq}}^n \right)\left( 1 + C \ln \frac{\dot{\varepsilon}}{\dot{\varepsilon}_0} \right)\left( 1 – \left( \frac{T – T_r}{T_m – T_r} \right)^m \right) $$
The fitted parameters are listed in the table below.
| Parameter | Value |
|---|---|
| Reference strain rate \(\dot{\varepsilon}_0\) (s⁻¹) | 1000 |
| A (MPa) | 1900 |
| B (MPa) | 1523 |
| n | 0.2269 |
| C | 0.0613 |
| m | 0.945 |
The fitted model was validated against experimental curves for all tested strain rates and temperatures. The Johnson-Cook model accurately captured the strain hardening, strain rate sensitivity, and thermal softening behavior of the herringbone gear material.
2. DEM-FEM Coupled Shot Peening Model for Herringbone Gear
To simulate the actual shot peening process on a herringbone gear, I established a DEM-FEM sequential coupling procedure. The discrete element method (DEM) was used to compute the impact information (velocity components and number of impacts) on each element of the gear tooth surface, considering the complex geometry of the herringbone gear and collisions between shots and between shots and gear surfaces. The finite element method (FEM) was then used to calculate the local elastic-plastic deformation, residual stress, and surface morphology.
The herringbone gear parameters used in the model are given in the following table.
| Parameter | Value |
|---|---|
| Normal module (mm) | 2.514 |
| Number of teeth | 27 |
| Normal pressure angle (°) | 22.5 |
| Helix angle (°) | 30 |
The target plate in the FEM model was meshed with C3D8R elements. The central impact zone had a mesh size of 10 μm × 10 μm × 10 μm. Infinite elements were used at the boundaries to absorb stress wave reflections. The initial surface roughness and initial residual stress gradient were measured from ground herringbone gear teeth and assigned to the FEM model before shot peening simulation.
The impact velocity in the local coordinate system of each tooth surface element was obtained from the DEM simulation. The impact velocity components were transformed from the global coordinate system to the local tooth surface coordinate system using:
$$ \mathbf{v}_s = \mathbf{M} \cdot \mathbf{v}_0 $$
where \(\mathbf{M}\) is the transformation matrix built from the local basis vectors of the tooth surface element. The number of impacts per unit area \(N\) was calculated from the DEM results:
$$ N = \frac{N_d}{S} $$
where \(N_d\) is the total number of impacts on a given surface element and \(S\) is its area. For the FEM model with \(k\) repeated cycles, the total number of impacts \(N_f\) was:
$$ N_f = N \cdot k $$
The initial shot positions were generated randomly using a Python script to mimic the stochastic nature of shot impacts. The \(j\)-th shot position was expressed as:
$$ \begin{cases} x_j = -v_{x,j} \cdot t \cdot \text{random}(-0.25,0.25) \\ y_j = -v_{y,j} \cdot t \cdot \text{random}(-0.25,0.25) \\ z_j = -v_{z,j} \cdot t \cdot j – r_j \end{cases} $$
This procedure ensured that the FEM model reflected the actual impact distribution and velocity distribution obtained from the DEM simulation, rather than assuming an idealized uniform impact pattern.
3. Shot Peening Intensity Calculation Model
Since the shot peening intensity is traditionally determined by Almen strip experiments, which are time-consuming and expensive, I developed a computational model to predict the Almen intensity from the actual shot peening process parameters. The model consists of several steps:
- Calculate the impact number distribution on the Almen strip using a two-dimensional Gaussian distribution based on shot flow rate, shot type, nozzle traverse speed, and spray angle.
- Build a finite element model of the Almen strip (76 mm × 19 mm × 1.29 mm for type A) and simulate the shot impacts using the velocity and impact density obtained in step 1.
- Extract the residual stress gradient from the impact simulation, then apply it to a full Almen strip static equilibrium model to compute the arc height.
- Repeat for different peening durations to obtain the saturation curve and determine the shot peening intensity according to the definition: the arc height at which doubling the peening time increases the arc height by only 10%.
The residual stress distribution in the Almen strip was computed using the same Johnson-Cook material model for SAE 1070 spring steel. The table below summarizes the target and shot material parameters used in the simulation.
| Material | Young’s modulus (GPa) | Poisson’s ratio | Density (kg/m³) | Hardness (HV) | Yield strength (MPa) |
|---|---|---|---|---|---|
| Target (SAE 1070) | 210 | 0.3 | 7800 | 462 | 1238 |
| S110 high hardness steel shot | 210 | 0.3 | 7800 | 671 | 1838 |
| S110 low hardness steel shot | 210 | 0.3 | 7800 | 500 | 1350 |
| S170 high hardness steel shot | 210 | 0.3 | 7800 | 671 | 1838 |
| S170 low hardness steel shot | 210 | 0.3 | 7800 | 500 | 1350 |
| S230 high hardness steel shot | 210 | 0.3 | 7800 | 671 | 1838 |
| AZB300 ceramic shot | 300 | 0.27 | 3800 | 727 | 2000 |
For the arc height calculation, I extracted the vertical displacement at the center point \(o\) and at the four corner points \(a, b, c, d\) of the central rectangle (31.75 mm × 15.87 mm). The arc height \(h\) is:
$$ h = \frac{z_a + z_b + z_c + z_d}{4} – z_o $$
where \(z_i\) are the vertical displacements of the respective points.
With this intensity model, I investigated the influence of shot velocity, shot diameter, shot hardness, and shot type on the Almen intensity. The results are summarized below.
4. Influence of Process Parameters on Herringbone Gear Surface Integrity
4.1 Effect of tooth flank position
Using the DEM-FEM model, I first compared the impact information on the left and right flanks of the herringbone gear, as well as on left-handed and right-handed helical sections. The simulation revealed that the unit-area impact number near the tooth root is significantly higher than near the tooth tip. For example, at a shot velocity of 60 m/s with S110 high-hardness shots, the impact number per unit area near the tooth root reached about 6000, while near the tooth tip it was about 2000. The pitch circle position had an intermediate value of around 2500.
The velocity distribution also varied along the tooth profile. Near the tooth tip, about 47% of impacts retained the nozzle exit velocity, whereas near the tooth root only about 19% of impacts retained that velocity. This is due to the confined space in the root region, which increases shot-shot and shot-surface collisions and dissipates kinetic energy.
The simulated surface roughness after shot peening at different tooth flank positions is shown in the table below.
| Position | Surface roughness \(S_a\) (μm) |
|---|---|
| Near tooth tip | 0.507 |
| Pitch circle | 0.523 |
| Near tooth root | 0.481 |
The corresponding residual stress profiles showed that the maximum compressive residual stress was about -1350 MPa at a depth of approximately 30 μm for all positions. The depth of the compressive residual stress layer was about 70 μm, with only minor differences across positions.
4.2 Effect of shot velocity
I varied the initial shot velocity from 60 m/s to 100 m/s while keeping other parameters unchanged. The impact number distribution changed: near the tooth tip the number of impacts increased with velocity, while near the tooth root it decreased. At the pitch circle the impact number remained approximately constant.
The surface morphology after shot peening at different velocities showed that higher velocities produce larger craters and completely remove the initial grinding marks. The surface roughness increased from 0.523 μm at 60 m/s to 0.922 μm at 100 m/s, indicating a strong sensitivity of roughness to shot velocity.
The residual stress results for different velocities are shown in the following table.
| Shot velocity (m/s) | Surface residual stress (MPa) | Maximum compressive residual stress (MPa) | Depth of maximum stress (μm) | Depth of residual stress layer (μm) |
|---|---|---|---|---|
| 60 | -874 | -1350 | 27 | 70 |
| 80 | -836 | -1365 | 32 | 80 |
| 100 | -934 | -1400 | 45 | 90 |
Increasing the shot velocity increased both the maximum compressive residual stress and the depth at which it occurs. The surface residual stress changed non-monotonically but remained in the range of -830 to -940 MPa.
4.3 Effect of shot diameter
I simulated shots with diameters corresponding to S110 (350 μm), S170 (500 μm), and S230 (700 μm) at a constant velocity of 60 m/s. As the shot diameter increased, the total number of impacts per unit area decreased significantly. For example, near the tooth root the impact number dropped from 6000 for S110 to 640 for S230.
The surface roughness increased with shot diameter, as summarized in the table below.
| Shot type | Diameter (μm) | Surface roughness \(S_a\) (μm) |
|---|---|---|
| S110 | 350 | 0.523 |
| S170 | 500 | 0.721 |
| S230 | 700 | 0.874 |
For residual stress, the surface compressive residual stress decreased with increasing shot diameter, while the depth of the maximum compressive stress and the total depth of the residual stress layer increased substantially. The following table gives the numerical values.
| Shot type | Surface residual stress (MPa) | Maximum compressive residual stress (MPa) | Depth of maximum stress (μm) | Depth of residual stress layer (μm) |
|---|---|---|---|---|
| S110 | -850 | -1350 | 32 | 70 |
| S170 | -759 | -1307 | 45 | 100 |
| S230 | -573 | -1317 | 60 | 160 |
4.4 Effect of shot hardness
To study the effect of shot hardness, I compared S110 high-hardness (671 HV, yield strength 1838 MPa) with S110 low-hardness shots (500 HV, yield strength 1350 MPa), and similarly for S170 shots. The DEM impact information was nearly identical for the same shot size and velocity, so the difference in surface integrity came purely from the mechanical response during impact.
The surface roughness results are summarized below.
| Shot condition | Surface roughness \(S_a\) (μm) |
|---|---|
| S110 high hardness | 0.523 |
| S110 low hardness | 0.316 |
| S170 high hardness | 0.721 |
| S170 low hardness | 0.339 |
Higher shot hardness produced higher surface roughness because harder shots create deeper and larger craters. The residual stress also increased significantly with shot hardness. For S110 shots:
| Shot hardness | Surface residual stress (MPa) | Maximum compressive residual stress (MPa) | Depth of maximum stress (μm) | Depth of residual stress layer (μm) |
|---|---|---|---|---|
| Low hardness | -662 | -1000 | 15 | 60 |
| High hardness | -874 | -1350 | 30 | 70 |
For S170 shots:
| Shot hardness | Surface residual stress (MPa) | Maximum compressive residual stress (MPa) | Depth of maximum stress (μm) | Depth of residual stress layer (μm) |
|---|---|---|---|---|
| Low hardness | -543 | -895 | 30 | 80 |
| High hardness | -760 | -1307 | 45 | 100 |
Consequently, shot hardness is positively correlated with both the magnitude and depth of the compressive residual stress, as well as with the surface roughness.
5. Influence of Process Parameters on Shot Peening Intensity
5.1 Shot velocity
Using the Almen intensity model, I computed the arc height curves for S110 high-hardness shots at velocities from 60 m/s to 100 m/s. The intensity increased monotonically with shot velocity. The calculated intensities are shown below.
| Shot velocity (m/s) | Almen intensity (mmA) |
|---|---|
| 60 | 0.209 |
| 70 | 0.218 |
| 80 | 0.230 |
| 90 | 0.245 |
| 100 | 0.260 |
The relationship was approximately linear in the studied range.
5.2 Shot diameter
The shot peening intensity was calculated for S110, S170, and S230 shots at the same velocity. The results are given below.
| Shot type | Diameter (μm) | Almen intensity at 70 m/s (mmA) |
|---|---|---|
| S110 | 350 | 0.218 |
| S170 | 500 | 0.280 |
| S230 | 700 | 0.409 |
Larger shot diameters produce higher Almen intensity because each impact imparts a larger plastic deformation zone and a deeper compressive layer, even though the number of impacts is lower.
5.3 Shot hardness
Increasing shot hardness substantially increased the Almen intensity. For S110 shots at different velocities, the intensity difference between high- and low-hardness shots widened as the velocity increased. For example, at 60 m/s the difference was 0.052 mmA, while at 100 m/s it reached 0.077 mmA. For S170 shots, the difference increased from 0.056 mmA at 50 m/s to 0.105 mmA at 90 m/s.
5.4 Shot type
I compared S110 high-hardness steel shots with AZB300 ceramic shots of the same diameter. The steel shots produced higher Almen intensity at all tested velocities, although the ceramic shots had a higher nominal hardness. This indicates that the higher density of steel shots provides a greater momentum transfer at the same velocity, leading to a deeper plastic zone and higher intensity.
6. Experimental Verification
6.1 Single crater diameter comparison
I performed shot peening experiments on Almen strips using the same process parameters as in the simulations. The single crater diameters were measured by scanning electron microscopy (SEM). The comparison between experimental measurements and simulation predictions is shown in the table below.
| Shot velocity (m/s) | Experiment crater diameter (μm) | Simulation crater diameter (μm) | Error (%) |
|---|---|---|---|
| 60 | 100 | 110 | 10.0 |
| 70 | 120 | 125 | 4.2 |
| 80 | 155 | 150 | 3.2 |
| 100 | 170 | 160 | 5.9 |
The good agreement verifies that the contact model, material parameters, and mesh density in the FEM simulation are appropriate.
6.2 Arc height and Almen intensity verification
I measured the Almen arc height experimentally using a standard Almen gauge. The same process conditions were simulated with my intensity model. The measured and simulated arc heights are compared below.
| Shot velocity | Simulation intensity (mmA) | Experiment intensity (mmA) | Error (%) |
|---|---|---|---|
| 70 m/s | 0.218 | 0.230 | 5.2 |
| 100 m/s | 0.260 | 0.290 | 10.3 |
The bending height profiles along the length and width of the Almen strip were also compared. The trends matched well, with errors below 13% in all cases.
6.3 Herringbone gear shot peening experiment
I conducted a full-scale herringbone gear shot peening experiment using S110 high-hardness shots, a shot velocity of approximately 70 m/s, a shot flow rate of 6 kg/min, a nozzle angle of 80°, a nozzle traverse speed of 120 mm/min, and a gear rotational speed of 20 rpm. The achieved coverage was greater than 200%.
After peening, the gear was cut into individual teeth. Surface roughness was measured using white light interferometry, and residual stress was measured using X-ray diffraction with electrolytic polishing for depth profiling.
The measured surface roughness parameters are listed in the table below.
| Surface | \(S_a\) (μm) | \(S_q\) (μm) | \(S_p\) (μm) | \(S_v\) (μm) | \(S_z\) (μm) |
|---|---|---|---|---|---|
| Unpeened left flank | 0.435 | 0.553 | 2.210 | 2.483 | 4.697 |
| Peened left flank | 0.566 | 0.715 | 2.880 | 3.020 | 5.903 |
| Peened right flank | 0.566 | 0.705 | 3.032 | 3.287 | 6.320 |
| Peened left flank of right-hand gear | 0.566 | 0.729 | 3.440 | 3.477 | 6.837 |
| Peened right flank of right-hand gear | 0.563 | 0.724 | 3.335 | 3.563 | 6.900 |
The unpeened surface had a roughness \(S_a\) of about 0.43 μm; after shot peening it increased to about 0.56 μm. This increase of approximately 30% is modest and acceptable for high-performance gears.
The residual stress depth profiles measured after peening showed a surface compressive residual stress of about -800 MPa and a maximum compressive stress of approximately -1150 MPa at a depth of about 30 μm. The compressive layer extended to approximately 80 μm. Unpeened teeth showed only -300 MPa at the surface and a shallow compressive layer that diminished quickly.
The comparison between my experimental measurements and the DEM-FEM simulation predictions for the same process conditions is presented below.
| Quantity | Experiment | Simulation | Error (%) |
|---|---|---|---|
| Surface roughness \(S_a\) (μm) | 0.57 | 0.64 | 12.3 |
| Surface residual stress (MPa) | -830 | -874 | 5.3 |
| Maximum residual stress (MPa) | -1250 | -1350 | 8.0 |
| Depth of maximum stress (μm) | 30 | 30 | 0 |
| Residual stress layer depth (μm) | 80 | 70 | 12.5 |
All errors remained below 13%, demonstrating the high accuracy and reliability of the proposed DEM-FEM coupled model for herringbone gear shot peening.
7. Conclusions
From my research, I draw the following main conclusions:
- The Johnson-Cook constitutive model for 10CrNi2Mo3Cu2V steel was successfully calibrated using Hopkinson bar tests. The material exhibits positive strain rate sensitivity and negative temperature sensitivity.
- The proposed Almen intensity calculation model, based on actual process parameters and FEM residual stress analysis, predicts the shot peening intensity with an error below 11% compared to experimental measurements. This provides a cost-effective alternative to trial-and-error Almen strip testing.
- For the herringbone gear, the left-handed and right-handed sections show similar impact distributions under reciprocating nozzle motion. The tooth root receives more impacts but with lower velocity, while the tooth tip receives fewer impacts with higher velocity. These differences result in a relatively uniform residual stress distribution along the tooth profile, with variations within 5%.
- Increasing shot velocity increases surface roughness, maximum compressive residual stress, and the depth of the compressive layer. The roughness increases from 0.523 μm to 0.922 μm when the velocity rises from 60 m/s to 100 m/s.
- Increasing shot diameter reduces the number of impacts but increases the depth of residual stress and surface roughness. The residual stress layer depth increases from 70 μm for S110 to 160 μm for S230 shots.
- Shot hardness has a pronounced effect on both roughness and residual stress. Harder shots produce higher compressive residual stresses and deeper layers but also increase surface roughness.
- The Almen intensity increases with shot velocity, shot diameter, and shot hardness. Steel shots produce higher intensity than ceramic shots of the same size due to their higher density.
- The DEM-FEM coupled model, accounting for initial residual stress and surface roughness, predicts the final surface roughness and residual stress of the herringbone gear with errors below 13%. This model is a valuable tool for optimizing shot peening process parameters for herringbone gears.
My research provides a scientific basis for selecting shot peening parameters for 10CrNi2Mo3Cu2V herringbone gears and offers an integrated experimental-simulation methodology suitable for similar high-performance steel components.