
Herringbone gears are widely used in aerospace, marine propulsion, heavy-duty machinery, and automotive transmissions due to their compact structure, high torque capacity, stable transmission ratio, and the inherent cancellation of axial thrust forces. However, modern industry demands increasingly higher performance from gear drives in terms of load capacity, noise, vibration, and reliability. In order to improve the meshing condition, reduce vibration and noise, and enhance the overall transmission performance, appropriate gear tooth modification strategies have become an essential part of gear design. In this thesis, I focus on the tooth surface modification design of a herringbone gear pair, using the ROMAX software environment to evaluate the static characteristics and sensitivity of different modification schemes. The study aims at improving the static meshing behaviour and the applicability of the modification by systematically analysing transmission error, contact stress, load distribution, and the influence of manufacturing and assembly errors.
1. Introduction
The herringbone gear can be considered as two opposed helical gears placed side by side, which eliminates the resultant axial force. This feature makes it particularly suitable for high-power and high-speed applications. Nevertheless, the design and manufacturing of herringbone gears are still challenging, especially when strict vibration and noise requirements are imposed. During operation, the gear teeth undergo elastic deformation, which changes the ideal conjugate tooth profile and leads to impact at mesh entry and exit, non-uniform load distribution along the tooth flank, and consequently increased transmission error. These phenomena excite the gear system and may cause premature failure such as pitting, scuffing, and tooth breakage.
To overcome these problems, gear modification is widely adopted. By removing a small amount of material from specific regions of the tooth flank, it is possible to compensate for elastic deformation, reduce mesh interference, and improve the contact pattern. There are three main types of modification: profile modification, lead modification, and topological modification. Profile modification is applied in the direction of the involute profile, typically with tip relief or root relief. Lead modification is applied along the tooth length direction to create a crowned tooth or end relief. Topological modification combines both profile and lead modification in a two-dimensional manner, which can simultaneously reduce mesh impact and improve load distribution.
Many researchers have studied gear modification for spur and helical gears, but only a limited number of investigations have been devoted to herringbone gears. In particular, sensitivity analysis of the optimal modification parameters with respect to transmission error and contact stress has received little attention. In this work, I aim to fill this gap by providing a systematic simulation-based study of herringbone gear modification, including the selection of modification algorithms, the evaluation of static performance, and the sensitivity of the modification results to small parameter variations and centre distance errors.
The rest of the thesis is organised as follows. Chapter 2 introduces the fundamental theory of gear modification. Chapter 3 describes the loaded tooth contact analysis of a herringbone gear pair before and after modification, using both Monte Carlo and genetic algorithm optimisation. Chapter 4 presents a sensitivity analysis of the optimal modification parameters with respect to transmission error and contact stress. Chapter 5 describes the experimental measurement of transmission error for standard tooth surfaces and compares the results with theoretical predictions. Finally, conclusions and future perspectives are summarised.
2. Fundamentals of Gear Modification Theory
2.1 Principle of Profile Modification
Under load, a gear tooth deforms elastically, and the ideal involute profile no longer meshes correctly with its mate. When a pair of gears enters mesh, the tip of the driven gear tends to interfere with the flank of the driving gear. This interference causes an impact load, which is particularly severe at high speeds. Profile modification removes material from the tooth tip and/or root so that the actual deformed flank approaches the theoretical conjugate profile. Consequently, the meshing impact is reduced and the load transition between single and double tooth pairs becomes smoother.
In profile modification, the amount of material removed is not constant but varies along the profile according to a chosen modification curve. Common curve types include straight lines, circular arcs, and parabolas. A linear modification is simple but tends to create a sharp corner at the start of modification, leading to stress concentration. A parabolic modification provides a smoother transition and better load distribution. In this work, I selected the quadratic parabola as the modification curve for both profile and lead modification.
2.2 Principle of Lead Modification
An ideal gear pair would have a perfectly uniform load distribution along the tooth width. In reality, shaft deflections, bearing clearances, and housing deformation cause the gear axes to incline relative to each other. As a result, the contact is concentrated at one end of the tooth, creating edge loading. Lead modification, such as crowning or end relief, removes material near the tooth ends so that the contact pattern moves towards the centre of the face width. This greatly improves load sharing and reduces the risk of tooth fracture due to stress concentration.
2.3 Principle of Topological Modification
Topological modification is a two-dimensional modification that is applied simultaneously in the profile direction and the lead direction. It combines the benefits of both profile and lead modification. By properly choosing the topological modification parameters, it is possible to reduce mesh excitation and to achieve a favourable contact pattern, even when the gear set operates under varying torque and alignment conditions. Because the herringbone gear studied here is a composite gear with high support stiffness and high installation accuracy, the left and right flanks carry symmetric load. Therefore, the herringbone gear pair can be modelled as an equivalent helical gear pair, and the applied torque can be halved. This simplification is used throughout the numerical simulations.
2.4 Modification Algorithms
To find the optimal modification parameters, I used two optimisation algorithms available in ROMAX: the Monte Carlo method and the genetic algorithm (GA). The Monte Carlo method repeatedly generates random samples of the modification parameters according to prescribed probability distributions, evaluates the transmission error for each sample, and selects the combinations that satisfy the target constraints. This method is straightforward and robust, but it may require a large number of evaluations to reach a good solution. The genetic algorithm is inspired by natural selection. It maintains a population of candidate solutions, evaluates their fitness (based on transmission error), and applies selection, crossover, and mutation operators over several generations. The GA is generally more efficient in locating the global optimum and is less sensitive to the initial guess. In this thesis, I used both algorithms to perform topological modification of the small gear, and I compared their performance.
2.5 Modification Curve
As mentioned above, the quadratic parabola was selected as the modification curve. The parabolic modification curve \(C(y)\) can be expressed as
$$
C(y) =
\begin{cases}
0, & y \le y_0,\\
C_{\max} \left( \dfrac{y – y_0}{L} \right)^2, & y_0 < y \le y_0 + L,
\end{cases}
$$
where \(y\) is the coordinate along the profile or lead direction, \(y_0\) is the start point of modification, \(L\) is the modification length, and \(C_{\max}\) is the maximum modification amount at the end of the modification zone. This curve gives a zero slope at the start point, which avoids sudden changes in the tooth surface and thus reduces stress concentration.
For the profile modification, the start point on the involute is related to the rolling angle. The involute function is defined as
$$
\mathrm{inv}\,\alpha_k = \theta_k = \tan\alpha_k – \alpha_k,
$$
where \(\alpha_k\) is the pressure angle at point \(k\) and \(\theta_k\) is the polar angle of the involute at that point. The rolling angle in degrees is
$$
\theta = \frac{180}{\pi}(\tan\alpha_k – \alpha_k).
$$
The diameter \(d_k\) at the start point and the base circle diameter \(d_b\) are related by
$$
\cos\alpha_k = \frac{d_b}{d_k}.
$$
By setting the modification length within the recommended ranges, the corresponding start angles can be calculated.
3. Loaded Analysis of Modified Tooth Surfaces
In this chapter, I describe the modelling and simulation of a herringbone gear pair in ROMAX Designer 17.0. Since the herringbone gear is symmetric and the support stiffness is high, I modelled it as an equivalent helical gear pair, applying half of the actual torque. The basic parameters of the gear pair are given in Table 1.
A typical herringbone gear pair is illustrated below.
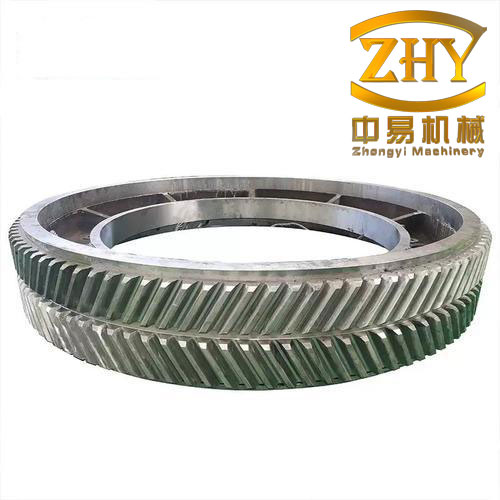
Table 1 lists the basic geometric parameters of the gear pair.
| Parameter | Unit | Pinion | Wheel |
|---|---|---|---|
| Number of teeth | – | 17 | 44 |
| Normal module | mm | 6 | 6 |
| Normal pressure angle | deg | 20 | 20 |
| Helix angle | deg | 24.43 | -24.43 |
| Hand of helix | – | Left | Right |
| Active face width (one side) | mm | 55 | 55 |
The gear material is structural steel with a Young’s modulus of 210 GPa and Poisson’s ratio of 0.3. The addendum coefficient is 1.0 and the tip clearance coefficient is 0.25. The input and output shafts are supported by SKF 30209 and SKF 30216 tapered roller bearings, respectively. The lubricant is ISO VG 150. The input speed is 160 r/min. Five operating conditions were used, as shown in Table 2.
| Case | Input torque (N·m) |
|---|---|
| 1 | 70 |
| 2 | 110 |
| 3 | 150 |
| 4 | 190 |
| 5 | 230 |
For the equivalent helical gear model, the centre distance error was set to 0.008 mm, as is common in high-accuracy gear applications.
3.1 Monte Carlo Modification
In the Monte Carlo approach, I defined eight modification parameters: four profile modification parameters (tip relief amount, root relief amount, tip relief start angle, root relief start angle) and four lead modification parameters (bottom end relief amount, top end relief amount, bottom end relief start position, top end relief start position). The population size was 500. The profile modification boundaries are given in Table 3 and the lead modification boundaries in Table 4. The modification length and amounts were selected based on recommended practice for this gear size.
| Parameter | Lower bound (mm) | Upper bound (mm) |
|---|---|---|
| Root relief amount | 0.005 | 0.01 mn |
| Root relief length | 0.1 mn | 0.6 mn |
| Tip relief amount | 0.005 | 0.015 mn |
| Tip relief length | 0.15 mn | 0.8 mn |
Here \(m_n = 6\) mm is the normal module. The corresponding tip relief start angle ranged from \(31.142^\circ\) to \(39.352^\circ\), and the root relief start angle ranged from \(10.400^\circ\) to \(22.449^\circ\).
| Parameter | Lower bound | Upper bound |
|---|---|---|
| Bottom end relief amount | 0.005 mm | 0.020 mm |
| Top end relief amount | 0.005 mm | 0.020 mm |
| Bottom end relief start position | 15.28 mm | 24.44 mm |
| Top end relief start position | 36.61 mm | 42.78 mm |
The objective function was set to minimise the peak-to-peak value of the loaded transmission error. The target ranges for the five operating conditions are listed in Table 5. After running the Monte Carlo simulation, I obtained 40 successful candidate designs from the 500 samples. The best design was applied to the gear model. The resulting profile modification parameters are shown in Table 6, and the lead modification parameters are shown in Table 7.
| Profile modification variable | Value |
|---|---|
| Tip relief amount | 54.42 μm |
| Root relief amount | 45.30 μm |
| Tip relief start angle | 35.484° |
| Root relief start angle | 17.529° |
| Lead modification variable | Value |
|---|---|
| Bottom end relief amount | 10.12 μm |
| Top end relief amount | 9.16 μm |
| Bottom end relief start position | 23.396 mm |
| Top end relief start position | 39.897 mm |
3.2 Genetic Algorithm Modification
The genetic algorithm was configured with a population size of 50, 10 generations, mutation probability 0.3, crossover probability 0.2, and generation gap 0.1. The same modification parameter boundaries as in the Monte Carlo method were used. The objective was again to minimise the transmission error peak-to-peak value. The GA generated 500 candidate designs in total, of which 204 satisfied the target constraints. The success rate of the GA was thus 40.8%, much higher than the 8% success rate of the Monte Carlo method. The best design obtained by the GA is summarised in Table 8 and Table 9.
| Profile modification variable | Value |
|---|---|
| Tip relief amount | 75.41 μm |
| Root relief amount | 53.73 μm |
| Tip relief start angle | 38.479° |
| Root relief start angle | 20.268° |
| Lead modification variable | Value |
|---|---|
| Bottom end relief amount | 5.24 μm |
| Top end relief amount | 17.80 μm |
| Bottom end relief start position | 18.552 mm |
| Top end relief start position | 38.230 mm |
3.3 Static Analysis Results
After applying the topological modification, I performed a loaded static analysis for all five operating conditions. The results are compared with the standard (unmodified) gear pair in terms of strength, transmission error, unit length normal load, and contact stress.
3.3.1 Strength Verification
The contact stress and bending stress on both the pinion and the wheel were calculated. The results show that the contact stress and bending stress increase almost linearly with increasing torque, while the safety factor decreases non-linearly. The bending safety factor is generally high, but the contact safety factor is close to unity, indicating that the tooth flank is more susceptible to contact fatigue. The microscopic modification amounts are only a few micrometres, which are negligible compared with the macroscopic tooth size. Therefore, the modification has virtually no effect on the static strength values. The calculated contact damage of the pinion is much higher than that of the wheel because the pinion rotates more times for a given service life. At the highest torque condition, the pinion flank damage reaches about 55%, while the bending damage remains zero.
3.3.2 Transmission Error Analysis
The transmission error is defined as the difference between the actual output angular position and the ideal output angular position. For a gear pair with pinion rotation angle \(\theta_1\) and wheel rotation angle \(\theta_2\), the angular transmission error is
$$
\delta_\theta = (\theta_2 – \theta_2^0) – \frac{z_1}{z_2}(\theta_1 – \theta_1^0),
$$
where \(z_1\) and \(z_2\) are the tooth numbers of the pinion and wheel, and \(\theta_1^0\), \(\theta_2^0\) are the initial angles. The linear transmission error along the line of action is
$$
\delta(t) = r_{b2}\,\delta_\theta,
$$
where \(r_{b2}\) is the base circle radius of the wheel.
Table 10 summarises the maximum and peak-to-peak transmission error values for the standard gear, the Monte Carlo modified gear, and the GA modified gear. The peak-to-peak value is the most important indicator because it directly excites vibration. Both modification methods significantly reduce the peak-to-peak transmission error. The GA yields a larger reduction than the Monte Carlo method; for example, at 110 N·m, the reduction reaches 72.0% with the GA, while the Monte Carlo modification achieves 64.75%. It is also observed that the transmission error increases approximately linearly with torque for the standard gear, which is due to the increasing tooth deformation under load.
| Case | Standard max (μm) | Standard p-p (μm) | Monte Carlo p-p (μm) | MC reduction (%) | GA p-p (μm) | GA reduction (%) |
|---|---|---|---|---|---|---|
| 1 | 1.29 | 0.255 | 0.094 | 63.14 | 0.078 | 69.41 |
| 2 | 1.99 | 0.400 | 0.141 | 64.75 | 0.112 | 72.00 |
| 3 | 2.69 | 0.545 | 0.290 | 46.79 | 0.239 | 56.15 |
| 4 | 3.37 | 0.689 | 0.402 | 41.65 | 0.345 | 49.93 |
| 5 | 4.05 | 0.832 | 0.445 | 46.51 | 0.421 | 49.40 |
3.3.3 Unit Length Normal Load
The unit length normal load distribution on the pinion flank is a direct indicator of the contact condition. In the standard gear, the maximum load occurs near the tooth edges, which is undesirable because it causes edge loading and increases the risk of pitting and cracking. After topological modification, the load distribution shifts towards the interior of the tooth flank, and the maximum unit load becomes less concentrated. Table 11 lists the maximum unit length normal load values for the standard and modified gears. The maximum load is somewhat larger after modification because the effective contact ratio is reduced when material is removed. However, the load pattern is much more favourable. The GA modified gear generally shows a slightly lower maximum load than the Monte Carlo modified gear.
| Case | Standard (N/mm) | Monte Carlo (N/mm) | GA (N/mm) |
|---|---|---|---|
| 1 | 30.8 | 46.3 | 43.8 |
| 2 | 49.1 | 65.7 | 63.0 |
| 3 | 67.7 | 84.3 | 82.0 |
| 4 | 86.5 | 100.8 | 100.0 |
| 5 | 106.3 | 115.8 | 117.9 |
3.3.4 Contact Stress
The distribution of the contact stress on the tooth flank is closely related to the unit length normal load. For the standard gear, high contact stress appears at the tooth edges. After modification, the maximum contact stress is reduced and moves to the centre of the flank. Table 12 shows the maximum contact stress for all cases. The GA modified gear achieves a reduction of about 20.4% at the highest torque, while the Monte Carlo modification gives a reduction of about 16.6%. The improved contact stress distribution reduces the risk of pitting and extends the fatigue life of the herringbone gear pair.
| Case | Standard (MPa) | Monte Carlo (MPa) | Reduction (%) | GA (MPa) | Reduction (%) |
|---|---|---|---|---|---|
| 1 | 339 | 345 | -1.74 | 320 | 5.94 |
| 2 | 428 | 410 | 4.39 | 382 | 12.04 |
| 3 | 502 | 459 | 9.37 | 434 | 15.67 |
| 4 | 567 | 500 | 13.40 | 479 | 18.37 |
| 5 | 626 | 537 | 16.57 | 520 | 20.38 |
From the above comparisons, it is evident that the genetic algorithm yields a better modification result than the Monte Carlo method, both in terms of transmission error reduction and contact stress reduction. Moreover, the higher success rate of the GA makes it more suitable for engineering practice.
4. Sensitivity Analysis of Modification
In practical manufacturing and assembly, the actual modification parameters may deviate from the optimal values. It is therefore important to assess how sensitive the transmission error and contact stress are to such deviations. I performed a sensitivity analysis by introducing small perturbations to the optimal modification parameters and by varying the centre distance installation error. The analysis was carried out separately for profile modification, lead modification, and topological modification.
4.1 Sensitivity of Profile Modification
Three sets of optimal profile modification parameters were selected. For each set, I changed the modification length by ±0.7 mm and the maximum modification amount by ±2 μm. The transmission error and the maximum contact stress were then recalculated under two centre distance errors: 0.008 mm and 1 mm.
Table 13 summarises the qualitative sensitivity for profile modification. The results indicate that the profile modification parameters are sensitive to transmission error. A small change in the tip or root relief length can cause a noticeable change in the peak-to-peak transmission error, especially at higher torques. On the other hand, the maximum contact stress remains almost unchanged; the variation is less than 3% for all cases. The centre distance error has a negligible influence on the transmission error of profile-modified gears, because involute gears preserve a constant velocity ratio even when the centre distance changes (the property of involute gearing).
| Item | Sensitivity |
|---|---|
| Transmission error vs. profile modification parameters | Sensitive |
| Maximum contact stress vs. profile modification parameters | Not sensitive |
| Transmission error vs. centre distance error | Not sensitive |
4.2 Sensitivity of Lead Modification
Similar to profile modification, three sets of optimal lead modification parameters were analysed. The lead modification length was varied by ±1 mm and the maximum modification amount by ±1 μm. Table 14 shows the sensitivity results. In contrast to profile modification, lead modification parameters have little effect on the transmission error. The peak-to-peak and mean transmission error values remain almost unchanged under small perturbations. The maximum contact stress is also insensitive to the lead modification perturbations. However, the centre distance error has a notable effect on the transmission error of lead-modified gears. When the centre distance changes, the tooth contact path moves away from the designed flank region, causing a significant change in the transmission error. Therefore, lead modification is sensitive to centre distance error.
| Item | Sensitivity |
|---|---|
| Transmission error vs. lead modification parameters | Not sensitive |
| Maximum contact stress vs. lead modification parameters | Not sensitive |
| Transmission error vs. centre distance error | Sensitive |
4.3 Sensitivity of Topological Modification
One set of the optimal topological modification parameters from the GA was selected. Perturbations were applied in both the profile and lead directions. The centre distance error was also varied. Table 15 summarises the results. The topological modification remains sensitive to transmission error, primarily due to the profile modification component. The maximum contact stress is not sensitive. Interestingly, the centre distance error has a small influence on the transmission error for this particular topological modification, because the profile modification parameters dominate over the lead modification parameters in this design. The contact stress distribution also remains stable: the maximum contact stress remains inside the tooth flank rather than moving to the edge.
| Item | Sensitivity |
|---|---|
| Transmission error vs. topological modification parameters | Sensitive |
| Maximum contact stress vs. topological modification parameters | Not sensitive |
| Transmission error vs. centre distance error | Not sensitive |
Overall, the sensitivity analysis shows that profile modification is a delicate design variable that must be controlled accurately during manufacturing, whereas lead modification is more forgiving in terms of transmission error but requires careful installation to avoid centre distance errors. The topological modification inherits the benefits of both but is mainly controlled by the profile component.
5. Experimental Verification of Transmission Error
To verify the simulation results, I built a closed-power-flow mechanical transmission test rig for a herringbone gear pair. The rig consists of a driving motor, a loading motor, elastic couplings, torque and speed sensors, a test gearbox, an auxiliary gearbox, and high-precision angular encoders. The schematic of the test rig is described below.
The principle of the closed-power-flow test rig is to recirculate the power between the test gearbox and the auxiliary gearbox. The loading motor converts mechanical power into electrical power, which is fed back to the driving motor, thereby reducing the energy consumption during the test. The angular positions of the test pinion and wheel are measured using Heidenhain circular gratings. The first pair of encoders has 18,000 lines and an accuracy of ±5 arcsec; the second pair has 90,000 lines and an accuracy of ±1 arcsec. The encoder signals are recorded with a data acquisition card, and the collected voltage signals are converted into angular data.
The transmission error calculation software was developed using MATLAB and Visual Basic. The software reads the angular data, applies a moving-average filter, extracts complete sine-wave cycles from the encoder signals, and calculates the angular transmission error. The linear transmission error is obtained by multiplying the angular transmission error by the base circle radius of the wheel. The experiments were conducted under five torque conditions: 140, 220, 300, 380, and 460 N·m, while the pinion speed was maintained at 160 r/min.
Since the simulation provides the linear transmission error and the experiment provides the angular transmission error, a unit conversion is needed. The relation between the linear transmission error \(\delta(t)\) in micrometres and the angular transmission error \(\delta_\theta\) in arcseconds is
$$
\delta_\theta = \frac{412.5296}{d_{b2}} \,\delta(t),
$$
where \(d_{b2}\) is the base circle diameter of the wheel in millimetres. This formula accounts for the conversion from micrometres to millimetres and from radians to arcseconds.
Table 16 compares the theoretical and experimental transmission error amplitudes for the standard tooth surface at the five test torque levels. The theoretical values are calculated from the ROMAX model, and the experimental values are the filtered results. It can be seen that the experimental transmission error amplitude increases with torque in the same way as the theoretical prediction. The absolute magnitudes differ because the experiment includes additional factors such as manufacturing errors, assembly misalignments, friction, time-varying meshing stiffness, bearing clearance, and dynamic effects, which are not fully included in the static simulation. Nevertheless, the monotonic trend of the transmission error with torque is consistent between theory and experiment.
| Case | Torque (N·m) | Theoretical amplitude (arcsec) | Experimental amplitude (arcsec) |
|---|---|---|---|
| 1 | 140 | 0.391 | 2.34 |
| 2 | 220 | 0.613 | 5.02 |
| 3 | 300 | 0.835 | 7.22 |
| 4 | 380 | 1.056 | 9.02 |
| 5 | 460 | 1.275 | 11.94 |
The experimental trend confirms the validity of the simulation approach, although the absolute values are higher due to the unavoidable dynamic effects in a real gear transmission. This verification provides confidence in the use of ROMAX for the static analysis of herringbone gear modification.
6. Conclusions and Future Work
In this thesis, I systematically investigated the tooth surface modification design of a herringbone gear pair using numerical simulation, sensitivity analysis, and experimental verification. The main conclusions can be summarised as follows:
- Both the Monte Carlo method and the genetic algorithm can effectively reduce the peak-to-peak transmission error and the maximum contact stress of a herringbone gear pair by means of topological modification. The genetic algorithm outperforms the Monte Carlo method in both effectiveness and success rate.
- The microscopic modification parameters do not affect the macroscopic strength of the gear teeth, such as bending stress and contact stress safety factors. However, they significantly improve the transmission error and contact stress distribution, moving the load away from the tooth edges into the central region of the flank.
- The sensitivity analysis reveals that profile modification is sensitive to transmission error but not to contact stress, while lead modification is not sensitive to either transmission error or contact stress. The centre distance error has a significant effect on lead-modified gears but a negligible effect on profile-modified gears. Topological modification exhibits behaviour that is largely governed by its profile modification component.
- The experimental measurement of the transmission error for the standard tooth surface shows the same increasing trend with torque as the theoretical prediction, despite higher absolute values due to dynamic and manufacturing effects. This validates the reliability of the simulation methodology.
Future work will focus on extending the experimental verification to modified herringbone gears, considering not only centre distance errors but also axes parallelism errors. In addition, dynamic analyses considering the time-varying mesh stiffness and damping will be incorporated to further improve the accuracy of the prediction. The use of more advanced optimisation algorithms, such as surrogate-based or multi-objective optimisation, will also be explored to achieve a more robust modification design for herringbone gears.